# How Timeframe and Risk Reward Ratio Work Together in Trading
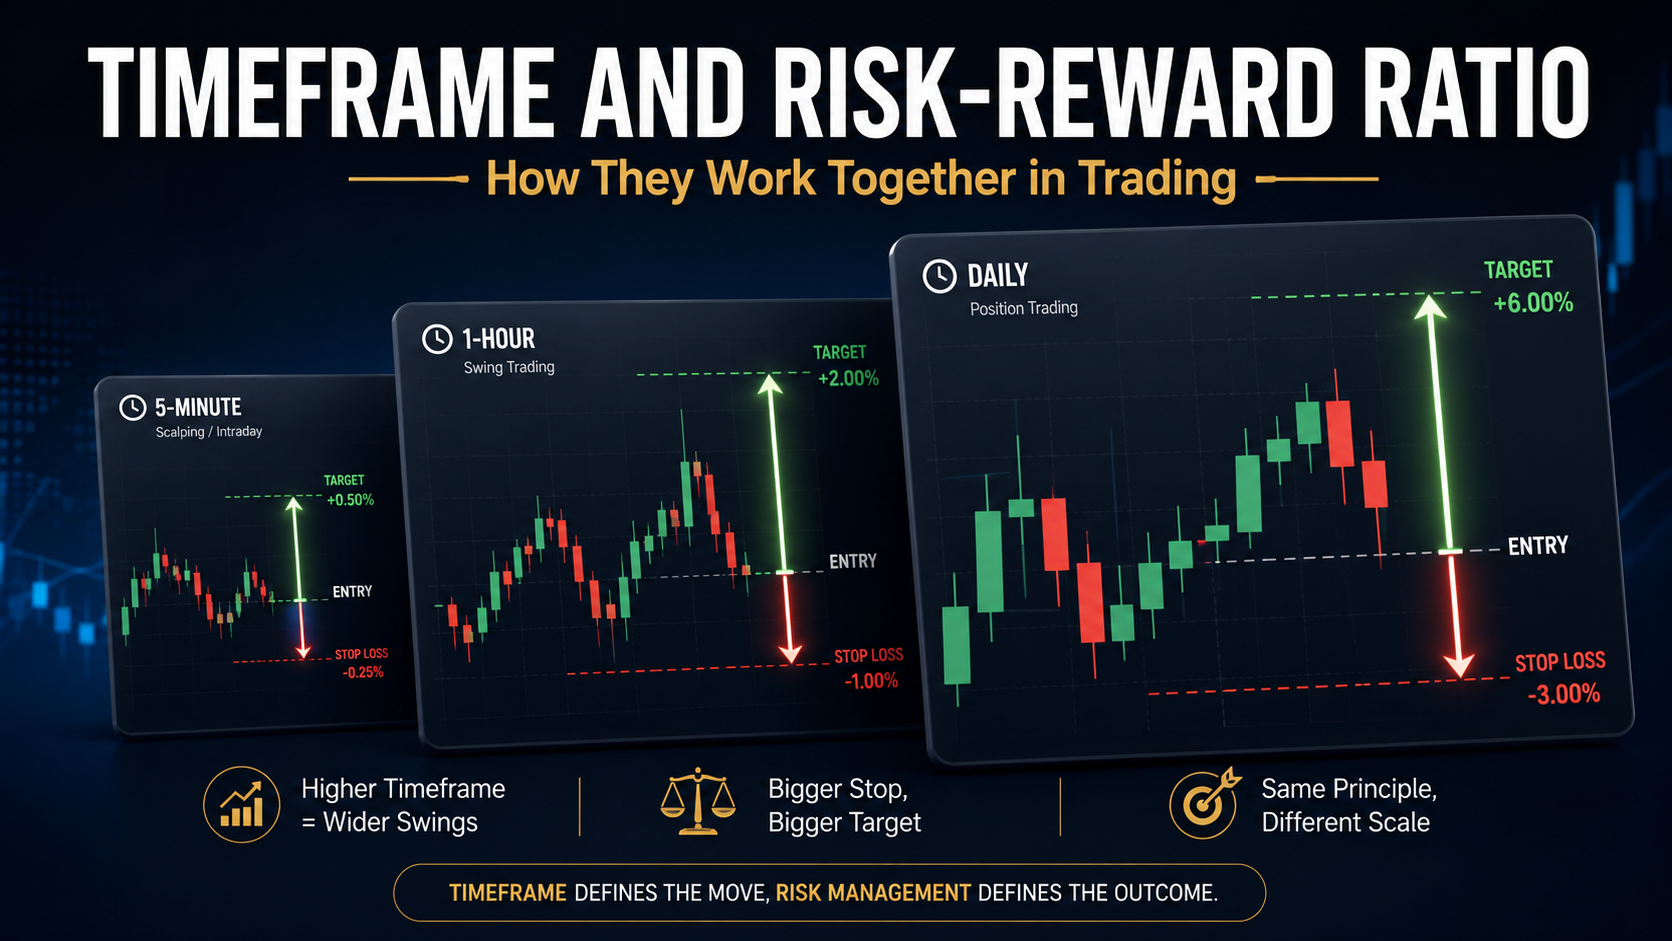
One of the most misunderstood relationships in trading is how your chosen timeframe fundamentally impacts your risk-to-reward ratio. Many traders struggle with consistency because they fail to align these two critical components of their trading strategy. Understanding this connection can mean the difference between sustainable profitability and frustrating losses.
The timeframe and risk reward ratio relationship affects everything from where you place your stop loss to how many trades you can realistically take per week. Whether you're scalping on the 1-minute chart or swing trading on the daily, your timeframe selection creates specific constraints and opportunities for your risk management approach.
Table of Contents
- [Understanding the Timeframe-Risk Relationship](#understanding-the-timeframe-risk-relationship)
- [How Different Timeframes Impact Risk Parameters](#how-different-timeframes-impact-risk-parameters)
- [Calculating Optimal Risk-Reward Across Timeframes](#calculating-optimal-risk-reward-across-timeframes)
- [Common Timeframe and Risk Reward Mistakes](#common-timeframe-and-risk-reward-mistakes)
- [Optimizing Your Strategy for Each Timeframe](#optimizing-your-strategy-for-each-timeframe)
- [Conclusion: Building Your Timeframe-Risk Framework](#conclusion-building-your-timeframe-risk-framework)
Understanding the Timeframe-Risk Relationship
The relationship between timeframe and risk reward ratio isn't arbitrary—it's governed by market structure, volatility patterns, and the mathematical reality of price movement across different time horizons.
Why Timeframe Matters for Risk Management
Every timeframe has distinct characteristics that directly influence your risk-reward parameters:
Market Noise vs. Meaningful Movement: Lower timeframes contain more random price fluctuations (noise), while higher timeframes filter out noise to show clearer trends. This affects where you can reasonably place stop losses without getting prematurely stopped out.
Volatility Compression: As you move to higher timeframes, volatility per unit of time appears compressed, but the absolute price range increases. A 1-hour candle might show a 50-pip range, while a daily candle on the same pair could show 150 pips.
Time Exposure: Your timeframe determines how long capital remains at risk. A 5-minute scalp might risk capital for minutes, while a weekly swing trade risks it for days or weeks.
:::key-concept The Core Principle: Larger timeframes generally allow for larger profit targets relative to stop loss distance, but require more patience and larger account sizes to maintain proper position sizing. Smaller timeframes offer more trade opportunities but require tighter risk-reward ratios and faster execution. :::
The Mathematical Reality
Consider this practical example across three timeframes looking at the same EUR/USD move:
- 5-Minute Chart: Price moves from 1.0850 to 1.0870 (20 pips). A reasonable stop might be 5 pips, giving a 4:1 reward-to-risk ratio.
- 1-Hour Chart: The same move appears as part of a larger pattern. Stop loss might be 15 pips below the entry for the same 20-pip target, yielding approximately 1.3:1.
- Daily Chart: This same 20-pip move is just noise. A meaningful daily setup might require a 40-pip stop for an 80-pip target, maintaining 2:1.
Notice how the same absolute price movement translates to vastly different risk-reward scenarios depending on your timeframe perspective.
How Different Timeframes Impact Risk Parameters
Let's examine how specific timeframe categories create unique risk-reward environments and what this means for your trading approach.
Scalping Timeframes (1-Minute to 15-Minute)
Typical Risk-Reward Ratios: 1.5:1 to 3:1
Scalping timeframes present the tightest relationship between timeframe and risk reward ratio. The rapid price action and frequent noise require specific adaptations:
Stop Loss Considerations:
- Must be tight (typically 5-15 pips in forex, $0.10-0.50 in stocks)
- Placed just beyond immediate support/resistance
- Higher risk of stop hunts and false breakouts
- Spread and commission costs consume a larger percentage of profits
Profit Target Realities:
- Limited by short-term volatility constraints
- Often based on recent ATR (Average True Range) or round numbers
- Need for quick decision-making reduces flexibility
:::example Scalping Example: Trading a breakout on the 5-minute EUR/USD chart. You enter at 1.0855 on a bullish candle close above resistance. Your stop sits at 1.0848 (7 pips below). Based on the current 5-minute ATR of 3 pips, a realistic target is 1.0867 (12 pips up), giving you roughly 1.7:1 risk-reward. You need a 60% win rate to be profitable after costs. :::
Day Trading Timeframes (15-Minute to 4-Hour)
Typical Risk-Reward Ratios: 2:1 to 5:1
Day trading timeframes offer the sweet spot for many traders, balancing opportunity frequency with meaningful risk-reward ratios.
Stop Loss Characteristics:
- Can be placed at logical market structure levels
- Typically 15-40 pips in forex, $0.50-2.00 in stocks
- Less susceptible to random noise than scalping
- Allows for proper price action analysis
Profit Target Opportunities:
- Can target multiple market structure levels
- Partial profit-taking becomes viable
- Intraday trends offer substantial reward potential
- Lower spread/commission impact as percentage of profit
:::tip On the 1-hour timeframe, align your stop losses with the most recent swing point rather than using arbitrary pip distances. This respects market structure and typically improves your timeframe and risk reward ratio by placing stops where price is genuinely invalidated. :::
Swing Trading Timeframes (4-Hour to Daily)
Typical Risk-Reward Ratios: 3:1 to 10:1+
Swing trading timeframes create the most favorable conditions for high risk-reward ratios, but with significant tradeoffs:
Stop Loss Dynamics:
- Placed at major support/resistance zones
- Typically 50-150 pips in forex, $2.00-10.00 in stocks
- Must account for overnight gaps and extended volatility events
- Requires larger account size for proper position sizing
Profit Potential:
- Can capture entire trend phases
- Multi-day or multi-week movements possible
- Reduced impact of spread and commission
- Allows for scaling in and out of positions
Time Commitment vs. Risk Exposure:
Here's a critical consideration: While swing trading offers superior risk-reward ratios, your capital remains at risk for extended periods. A daily chart trade might take two weeks to play out, during which market conditions can shift dramatically.
:::warning Overnight and Weekend Risk: Swing trading on higher timeframes exposes you to gap risk. Major news events, geopolitical developments, or earnings announcements can cause price to gap beyond your stop loss, resulting in larger-than-planned losses. Always factor gap risk into your position sizing on timeframes above 4-hour. :::
Position Trading Timeframes (Daily to Weekly)
Typical Risk-Reward Ratios: 5:1 to 20:1+
Position trading represents the extreme end of the timeframe spectrum, where the relationship between timeframe and risk reward ratio reaches its maximum potential—but with corresponding challenges:
- Stops might be 200+ pips or several percentage points
- Targets can be measured in thousands of pips or 20%+ moves
- Requires significant capital to maintain proper risk per trade
- Demands psychological fortitude to hold through intermediate pullbacks
Calculating Optimal Risk-Reward Across Timeframes
Understanding the theory is valuable, but traders need practical methods to calculate appropriate risk-reward ratios for their chosen timeframes.
The ATR Method for Timeframe-Appropriate Stops
The Average True Range (ATR) automatically adjusts to your timeframe's volatility:
1. Calculate ATR for your chosen timeframe (typically 14-period setting) 2. Set stops at 1.5-2.5x ATR below your entry (for longs) 3. Set targets at 3-6x ATR above your entry 4. Adjust multipliers based on timeframe:
- Lower timeframes: Use smaller multipliers (1.5x ATR stops, 3x targets)
- Higher timeframes: Use larger multipliers (2.5x ATR stops, 6x targets)
:::example ATR Calculation Example: On the 1-hour GBP/USD chart, the 14-period ATR reads 35 pips. For a long trade:
- Entry: 1.2650
- Stop Loss: 1.2650 - (35 × 2) = 1.2580 (70 pips)
- Target: 1.2650 + (35 × 5) = 1.2825 (175 pips)
- Risk-Reward: 175/70 = 2.5:1
This automatically creates a timeframe-appropriate risk-reward structure. :::
The Structure-Based Approach
Instead of using ATR, base your stops and targets on actual market structure:
For Stop Losses:
- Place beyond the most recent swing high/low
- Account for your timeframe's typical swing size
- Add a buffer (5-10 pips on lower timeframes, 20-50 on higher)
For Profit Targets:
- Identify the next major structure level (support becoming resistance, previous swing points)
- Measure the distance to projected Fibonacci extensions
- Look for confluence with psychological round numbers
Timeframe-Specific Structure Levels:
- 5-minute: Recent 15-30 minute swing points
- 1-hour: Recent 4-hour or daily swing points
- Daily: Weekly or monthly swing points, major round numbers
Position Sizing: The Missing Link
Your timeframe and risk reward ratio calculation is incomplete without proper position sizing. As timeframe increases and stop distances widen, position size must decrease to maintain consistent dollar risk:
Formula: Position Size = (Account Risk Amount) / (Stop Loss Distance in Pips × Pip Value)
Practical Application:
- $10,000 account, risking 1% = $100 per trade
- 5-minute setup: 10-pip stop = 1.0 lots (forex)
- 1-hour setup: 30-pip stop = 0.33 lots
- Daily setup: 100-pip stop = 0.10 lots
Notice how the same dollar risk requires dramatically different position sizes across timeframes. Many traders make the mistake of maintaining consistent position sizes across timeframes, leading to either over-leveraging on higher timeframes or under-utilizing capital on lower ones.
:::key-concept The Scaling Rule: As your timeframe increases by one level (e.g., from 15-minute to 1-hour), your typical stop distance might double or triple. To maintain consistent dollar risk, your position size must decrease proportionally. This is fundamental to proper risk management across timeframes. :::
Common Timeframe and Risk Reward Mistakes
Even experienced traders fall into predictable traps when aligning timeframes with risk-reward parameters. Recognizing these mistakes can save you significant capital.
Mistake #1: Using Lower Timeframe Stops on Higher Timeframe Setups
Many traders identify setups on the daily chart but then zoom into the 15-minute chart to "get a better entry" and place tighter stops. This creates a fundamental mismatch:
Why It Fails:
- Daily chart price action requires daily chart breathing room
- Lower timeframe noise will trigger your tight stop
- You've destroyed the favorable risk-reward ratio that made the daily setup attractive
The Solution: If you enter on a lower timeframe, place your stop based on the higher timeframe structure that generated your trade idea. Yes, this means occasionally taking larger stops, but your position sizing should reflect this reality.
Mistake #2: Expecting Higher Timeframe Reward Ratios on Lower Timeframes
The inverse problem: Traders on the 5-minute chart expect to achieve 5:1 or 10:1 risk-reward ratios consistently.
Why It's Unrealistic:
- Lower timeframes lack the price movement capacity for extreme ratios
- You'll either set unrealistic targets that rarely hit, or
- You'll set dangerously tight stops that get triggered by normal noise
The Solution: Accept that your timeframe and risk reward ratio potential has natural limits. On scalping timeframes, a consistent 2:1 ratio with a high win rate is more valuable than chasing 5:1 setups that rarely materialize.
Mistake #3: Ignoring Timeframe-Specific Win Rate Requirements
Different timeframes require different win rates for profitability, even with identical risk-reward ratios:
The Math:
- 2:1 risk-reward needs 40% win rate to break even
- But lower timeframes have more false signals and noise
- Scalpers might need 60-70% win rate to be profitable after costs
- Swing traders might be profitable with 40-45% win rate
:::warning Cost Structure Impact: On a 5-minute chart with 2:1 risk-reward and 10-pip targets, a 2-pip spread represents 20% of your profit. On a daily chart with 100-pip targets, the same spread is only 2% of profit. This dramatically affects the actual risk-reward ratio you're achieving after costs, especially on lower timeframes. :::
Mistake #4: Switching Timeframes Mid-Trade
This common error occurs when traders enter on one timeframe but manage the trade using another:
Scenario: Enter a 1-hour bullish setup, then watch the 5-minute chart and exit at the first sign of pullback.
The Problem:
- You're applying 5-minute price action logic to a 1-hour setup
- Normal 1-hour consolidation looks like trend reversal on 5-minute
- You exit prematurely, destroying your planned risk-reward ratio
The Fix: Commit to managing trades on the timeframe where you entered them. If you entered based on 1-hour structure, check that timeframe for exit signals, not lower ones.
Optimizing Your Strategy for Each Timeframe
Now that we understand the relationship and common pitfalls, let's build practical frameworks for optimizing your timeframe and risk reward ratio alignment.
Creating Timeframe-Specific Trading Rules
Your trading rules should explicitly account for timeframe characteristics:
For Scalping (1-15 Minute Charts):
- Minimum 1.5:1 risk-reward, target 2:1+
- Maximum 3-4 trades per session to avoid overtrading
- Mandatory use of limit orders to improve entries
- Strict adherence to time stops (exit if no movement within 30 minutes)
- Focus on high-volume periods only (London/New York overlap)
For Day Trading (15-Minute to 4-Hour Charts):
- Minimum 2:1 risk-reward, target 3:1+
- Allow partial profits at 1.5:1, letting remainder run to 3:1+
- Use trailing stops once 2:1 is achieved
- Maximum 2-3 quality setups per day
- Exit all positions by end of session (avoid overnight risk)
For Swing Trading (4-Hour to Daily Charts):
- Minimum 3:1 risk-reward, target 5:1+
- Scale out at predetermined structure levels
- Allow trades 3-10 days to develop
- Maximum 3-5 positions open simultaneously
- Weekly review and adjustment of stops to breakeven after favorable movement
:::tip The Timeframe Consistency Rule: Choose one primary timeframe and become an expert at its rhythms, typical ranges, and optimal risk-reward parameters. Many successful traders achieve better results specializing in one timeframe than jumping between multiple timeframes trying to force setups. :::
Multi-Timeframe Analysis Without Confusion
You can use multiple timeframes for analysis while maintaining clear risk-reward parameters:
The Top-Down Approach: 1. Higher Timeframe (for bias): Determine trend direction and major support/resistance 2. Trading Timeframe (for entry): Identify specific setup and calculate risk-reward 3. Lower Timeframe (for timing): Fine-tune entry point within the setup
Critical Rule: Always calculate your stop loss and profit target based on the trading timeframe (step 2), not the higher or lower timeframes. The higher timeframe provides context, the lower timeframe improves entry, but your risk-reward calculation lives on your trading timeframe.
Practical Example:
- Daily chart (higher): Shows EUR/USD in uptrend, approaching resistance at 1.1000
- 4-hour chart (trading): Shows bullish flag pattern forming at 1.0950
- 1-hour chart (lower): Shows entry trigger on breakout of flag at 1.0960
- Stop placement: Based on 4-hour flag structure at 1.0920 (40 pips)
- Target: Based on daily resistance at 1.1000 (40 pips) = 1:1 minimum, with extension target at 1.1050 for 2.25:1
Adapting to Market Conditions
The optimal timeframe and risk reward ratio relationship also depends on current market conditions:
Trending Markets:
- Higher timeframes perform better
- Risk-reward ratios can be more aggressive (targeting 5:1+)
- Wider stops are appropriate as trends have larger pullbacks
Ranging Markets:
- Lower timeframes may be preferable for range-bound plays
- More conservative risk-reward (2:1 to 3:1) as movements are constrained
- Tighter stops work better as ranges have defined boundaries
Volatile Markets:
- Consider moving to higher timeframes to avoid noise
- Widen stops proportionally to increased ATR
- Maintain same risk-reward ratio but with larger absolute pip values
:::example Volatility Adjustment Example: During normal conditions, your 1-hour EUR/USD strategy uses 25-pip stops for 75-pip targets (3:1). Major economic news releases increase hourly ATR from 15 pips to 35 pips. Proper adaptation:
- New stop distance: 45-50 pips (roughly 1.5x the new ATR)
- New target: 135-150 pips (maintaining 3:1 ratio)
- Reduced position size to maintain same dollar risk with wider stop
Alternatively, you might choose to avoid trading for a few hours until volatility normalizes, rather than adjusting parameters. :::
Tracking and Measuring Your Results
You cannot optimize what you don't measure. Track these metrics separately for each timeframe you trade:
Essential Metrics by Timeframe:
- Average risk-reward ratio achieved (not planned, but actual)
- Win rate percentage
- Expectancy: (Win Rate × Average Win) - (Loss Rate × Average Loss)
- Average time in trade
- Maximum favorable excursion (how far trades went in your favor)
- Maximum adverse excursion (how close stops came to being hit before winning)
What This Reveals: If your 1-hour trades consistently show maximum favorable excursion of 5:1 but you're only capturing 2:1, you're exiting too early. If your daily chart trades frequently show maximum adverse excursion touching your stops before reversing, you might need wider stops or better entry timing on a lower timeframe.
Conclusion: Building Your Timeframe-Risk Framework
The relationship between timeframe and risk reward ratio isn't just a technical consideration—it's the foundation of a sustainable trading approach. Understanding this connection allows you to:
Align Your Expectations: Each timeframe has natural risk-reward constraints. Scalpers shouldn't expect 10:1 ratios, and position traders shouldn't expect five setups per day. Aligning your expectations with timeframe realities prevents frustration and poor decision-making.
Optimize Position Sizing: As your stop distances change with timeframe, your position sizes must adapt proportionally. This ensures consistent dollar risk regardless of whether you're trading 5-minute or daily charts.
Choose Your Battles: Different timeframes suit different personality types and schedules. If you're employed full-time, the daily timeframe with 3:1+ risk-reward ratios and minimal screen time might be ideal. If you can actively monitor markets for hours, intraday timeframes offer more opportunities.
Manage Realistic Win Rates: Understanding that your chosen timeframe influences required win rates helps you develop appropriate strategies. Lower timeframes need higher accuracy; higher timeframes can succeed with lower win rates if risk-reward ratios compensate.
:::key-concept The Framework: Choose one primary timeframe based on your available time, personality, and account size. Master the typical risk-reward parameters for that timeframe. Calculate position sizes appropriate to your timeframe's stop distances. Track results separately for each timeframe you trade. Adjust only after collecting sufficient data—minimum 30 trades per timeframe. :::
The most successful traders don't fight their timeframe's natural characteristics—they embrace them. A master scalper achieves 2:1 ratios with 65% accuracy and trades frequently. A master swing trader achieves 5:1 ratios with 40% accuracy and trades selectively. Both are profitable because they've aligned their timeframe and risk reward ratio expectations with market realities.
Your next step is practical application. Choose one timeframe, define clear risk-reward parameters appropriate to that timeframe, and execute 20-30 trades tracking every metric discussed in this guide. The data will reveal your optimal timeframe and risk-reward combination far better than theory alone.
Take Action: Pull up your trading platform right now. Calculate the average ATR on your preferred timeframe. Based on that ATR, determine appropriate stop distances and profit targets. Write these down as rules. On your next trade, apply these timeframe-specific parameters without deviation. Then track the result. This simple practice, repeated consistently, will transform your understanding of how timeframe and risk reward ratio work together in your unique trading approach.
Remember: The perfect timeframe and risk-reward ratio is the one you can execute consistently with discipline, not the one that looks best in theory. Start with the framework provided here, adapt it to your personal circumstances, and refine it through systematic tracking and honest self-assessment. Your edge lies not in discovering a secret timeframe, but in mastering the timeframe that matches your trading personality and life circumstances.