# Master the Spring and Upthrust Pattern: A Wyckoff/VSA Guide to Reversal Trading
Market reversals are among the most profitable trading opportunities, yet they're also among the most challenging to identify. The spring and upthrust pattern represents one of the most reliable reversal signals when properly understood through the lens of Wyckoff Method and Volume Spread Analysis (VSA). These patterns reveal the hidden activities of smart money and provide traders with high-probability entry points at market turning points.
Developed by Richard Wyckoff in the early 1900s and refined through modern VSA principles, these patterns help traders understand when institutional money is positioning for major moves. By recognizing springs and upthrusts, you can align your trades with smart money rather than falling victim to false breakouts that trap retail traders.
Table of Contents
1. [Understanding Spring and Upthrust Patterns](#understanding-spring-and-upthrust-patterns) 2. [The Wyckoff Methodology Behind These Patterns](#the-wyckoff-methodology-behind-these-patterns) 3. [Volume Spread Analysis for Pattern Confirmation](#volume-spread-analysis-for-pattern-confirmation) 4. [Identifying and Trading Springs](#identifying-and-trading-springs) 5. [Recognizing and Trading Upthrusts](#recognizing-and-trading-upthrusts) 6. [Risk Management and Position Sizing](#risk-management-and-position-sizing) 7. [Common Mistakes and How to Avoid Them](#common-mistakes-and-how-to-avoid-them) 8. [Advanced Pattern Recognition Techniques](#advanced-pattern-recognition-techniques)
Understanding Spring and Upthrust Patterns
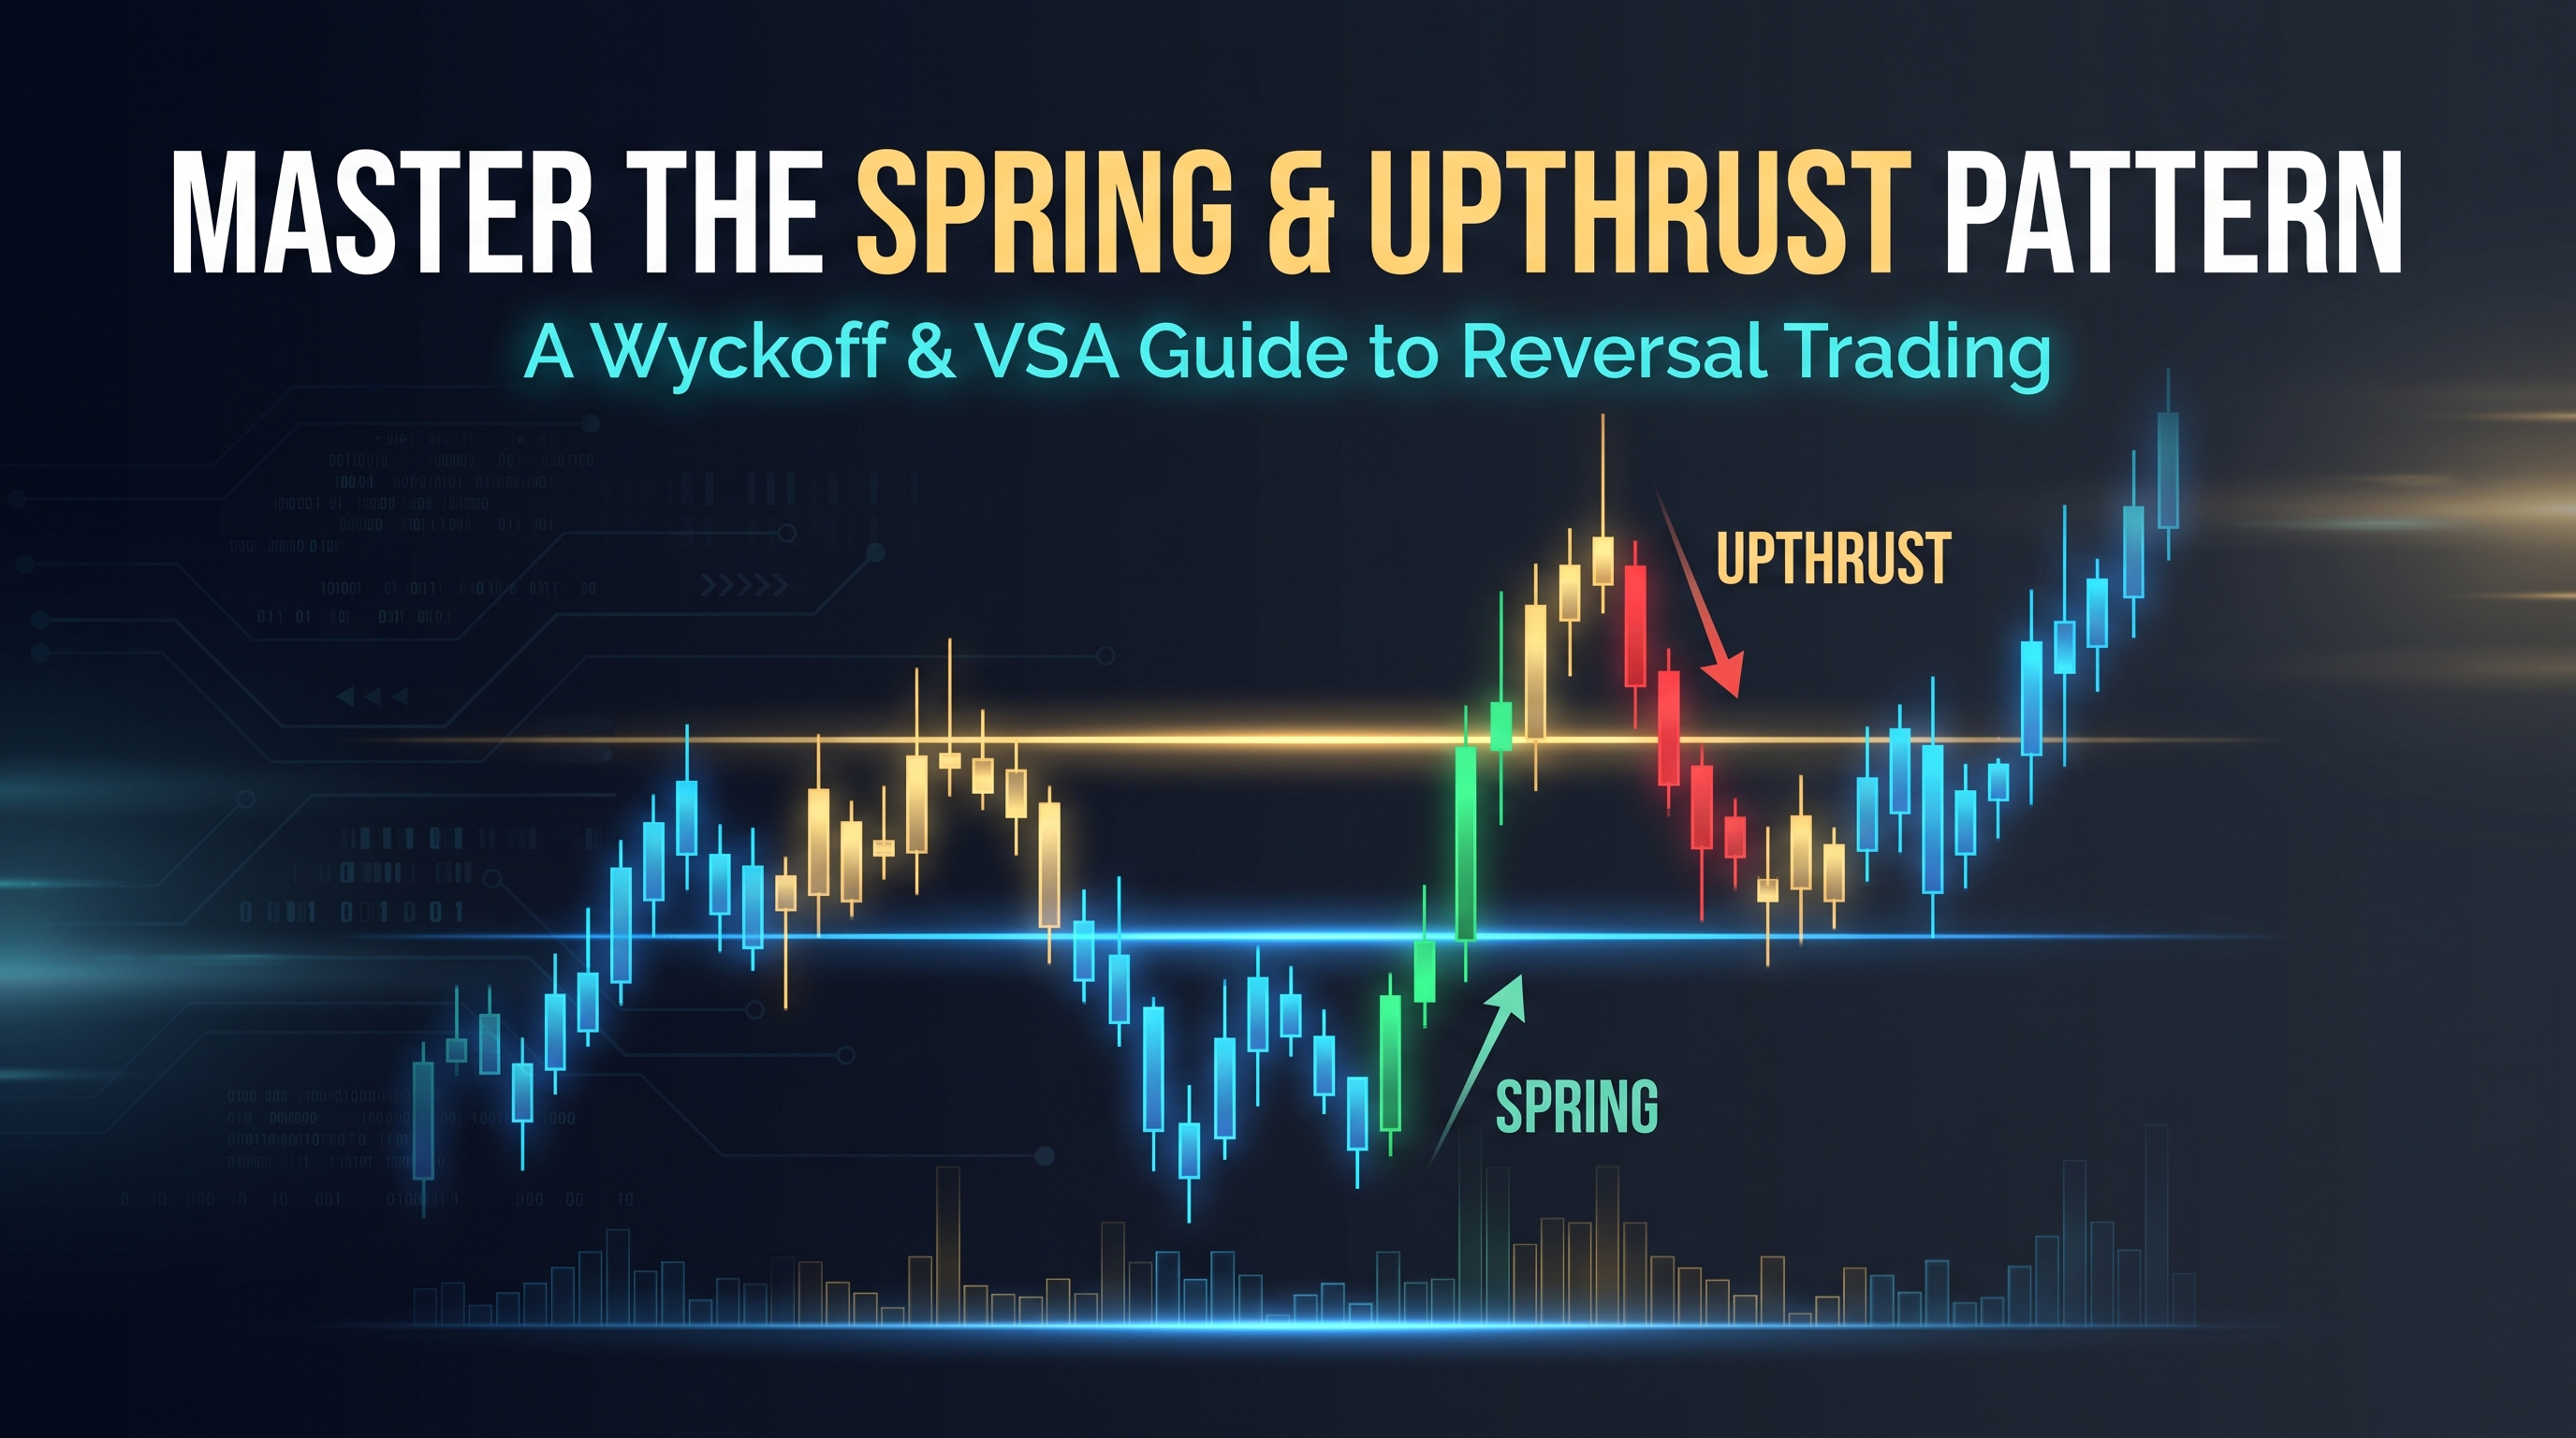
The spring and upthrust pattern represents two sides of the same coin - both are false breakouts that signal potential reversals. These patterns occur when price briefly penetrates significant support or resistance levels before quickly reversing, revealing the true intentions of institutional traders.
:::key-concept Spring: A false breakdown below support that quickly reverses upward, indicating buying interest from smart money and potential bullish reversal.
Upthrust: A false breakout above resistance that quickly reverses downward, showing distribution by institutions and signaling potential bearish reversal. :::
These patterns are particularly powerful because they exploit the predictable behavior of retail traders who often chase breakouts without understanding the underlying market structure. When price appears to break support or resistance, many traders enter positions expecting continuation, only to be stopped out when the market reverses.
Market Psychology Behind Springs and Upthrusts
The effectiveness of these patterns stems from their ability to reveal market manipulation. Institutional traders often create false breakouts to:
- Trigger stop losses of retail traders positioned against the intended direction
- Create liquidity for their larger positions
- Test the strength of support and resistance levels
- Shake out weak hands before the real move begins
:::warning Not every false breakout is a spring or upthrust. These patterns require specific volume and price action characteristics to be considered valid trading signals. :::
The Wyckoff Methodology Behind These Patterns
Richard Wyckoff's approach to market analysis focuses on understanding the activities of large operators (institutional traders) through price and volume analysis. The spring and upthrust pattern fits perfectly within Wyckoff's four-phase market cycle:
Wyckoff Market Phases
1. Accumulation: Smart money quietly builds positions 2. Markup: Price advances as institutions drive the market higher 3. Distribution: Institutions sell to retail traders at high prices 4. Markdown: Price declines as selling pressure overwhelms buying
Springs typically occur during accumulation phases, while upthrusts are common during distribution phases. Understanding these cycles helps traders anticipate when and where these patterns are most likely to develop.
:::example Spring Example: After a prolonged downtrend, price consolidates in a trading range. A brief break below the range support on low volume followed by immediate buying creates a spring, signaling that accumulation may be complete and markup phase is beginning. :::
Wyckoff's Three Laws
The spring and upthrust pattern demonstrates all three of Wyckoff's fundamental laws:
1. Law of Supply and Demand: The quick reversal shows a shift in the supply/demand balance 2. Law of Cause and Effect: The accumulation or distribution phase (cause) leads to the subsequent trend (effect) 3. Law of Effort vs. Result: The volume (effort) during the false breakout doesn't support the price movement (result)
Volume Spread Analysis for Pattern Confirmation
Volume Spread Analysis adds crucial confirmation to spring and upthrust identification. VSA examines the relationship between volume, spread (high-low range), and closing price to reveal institutional activity.
Key VSA Principles for Springs
Volume Characteristics:
- Low volume on the initial breakdown
- Increasing volume on the recovery
- Volume expansion as price moves back above support
Spread Analysis:
- Narrow spread on the breakdown indicates lack of selling pressure
- Wide spread on recovery shows renewed buying interest
Closing Price:
- Close near the high of the reversal bar
- Close well above the false breakdown level
:::tip The most reliable springs occur when the false breakdown happens on the lowest volume in several periods, followed by immediate volume expansion on the recovery. :::
VSA Confirmation for Upthrusts
Volume Characteristics:
- High volume on the false breakout (but price can't sustain gains)
- Decreasing volume on subsequent rallies
- Volume expansion on the breakdown
Spread Analysis:
- Wide spread on the false breakout with poor closing
- Narrow spreads on pullback attempts
Closing Price:
- Close in the lower portion of the breakout bar
- Subsequent closes below the resistance level
Identifying and Trading Springs
Successful spring trading requires patience and precise timing. The pattern unfolds in distinct phases that traders must recognize and act upon.
Phase 1: Range Development
Before a spring can occur, price must establish a clear trading range with defined support and resistance levels. Look for:
- At least 3-4 tests of support level
- Decreasing volume on support tests (showing selling exhaustion)
- Price action becoming tighter near support
- Evidence of accumulation through VSA analysis
Phase 2: The False Breakdown
The spring begins when price breaks below established support. Key characteristics:
- Volume: Typically lower than previous breakdown attempts
- Penetration: Usually minor (not deep into support)
- Duration: Brief penetration, often just 1-2 bars
- Follow-through: Lack of continued selling pressure
Phase 3: The Recovery
The most critical phase for confirming the spring:
- Immediate recovery: Price quickly moves back above support
- Volume increase: Buying volume expands on the recovery
- Momentum: Strong upward price movement
- Confirmation: Close well above the support level
:::example EUR/USD Spring Trade Setup: Price consolidates between 1.1800 support and 1.1900 resistance for several weeks. On low volume, price briefly breaks to 1.1785 before immediately recovering. Volume increases as price moves back above 1.1800 and continues toward 1.1850. This represents a classic spring setup for a long position. :::
Trading the Spring
Entry Strategy:
- Enter long as price reclaims support level
- Wait for volume confirmation before entry
- Consider entering on pullbacks to the reclaimed support
Stop Loss Placement:
- Below the low of the spring (false breakdown)
- Allow some buffer for normal price fluctuation
- Typical stop: 10-20 pips below the spring low
Profit Targets:
- First target: Previous resistance level
- Second target: 1.5-2 times the range height
- Final target: Based on longer-term resistance levels
Recognizing and Trading Upthrusts
Upthrusts signal potential bearish reversals and require different identification and trading criteria than springs.
Upthrust Development Process
Stage 1: Distribution Range
- Price establishes trading range after uptrend
- Multiple tests of resistance level
- Volume analysis shows potential distribution
- Price action becomes choppy and erratic
Stage 2: False Breakout
- Price breaks above resistance
- Volume may be high but price can't sustain gains
- Quick reversal back below resistance
- Often occurs on news or market excitement
Stage 3: Confirmation
- Price fails to return to resistance
- Volume increases on subsequent declines
- Lower highs and lower lows develop
- Market structure shifts bearish
VSA Analysis for Upthrusts
Volume behavior during upthrusts often reveals institutional selling:
- High volume, poor price performance: Large volume but price can't advance
- Selling climax characteristics: Exhaustion of buying pressure
- Lack of follow-through: No buying interest above resistance
:::warning Be cautious of upthrusts in strong uptrends. Sometimes apparent upthrusts are actually back-up moves before continuation higher. Always consider the broader market context. :::
Trading Upthrust Patterns
Entry Techniques:
- Short as price falls back below resistance
- Enter on pullback rallies that fail at resistance
- Wait for confirmation of bearish market structure
Risk Management:
- Stop loss above the high of the upthrust
- Position size based on distance to stop
- Monitor for signs of renewed buying interest
Profit Objectives:
- Target previous support levels
- Measure moves based on range height
- Trail stops as trend develops
Risk Management and Position Sizing
Effective risk management is crucial when trading spring and upthrust patterns, as false signals can result in significant losses.
Position Sizing Guidelines
Risk Percentage:
- Never risk more than 1-2% of account per trade
- Adjust position size based on stop distance
- Consider market volatility in sizing decisions
Stop Loss Calculation:
- Springs: Stop below false breakdown low + buffer
- Upthrusts: Stop above false breakout high + buffer
- Account for normal market noise in stop placement
:::tip Position Sizing Formula: Position Size = (Account Risk ÷ Stop Distance) × Account Balance
Example: $10,000 account, 1% risk ($100), 50 pip stop = 2,000 units :::
Risk-Reward Considerations
Minimum Risk-Reward Ratios:
- Springs: Target minimum 1:2 risk-reward
- Upthrusts: Look for 1:1.5 to 1:3 ratios
- Adjust targets based on market structure
Trade Management:
- Move stops to breakeven after 1:1 achieved
- Take partial profits at key levels
- Trail stops using market structure
Common Mistakes and How to Avoid Them
Trading spring and upthrust patterns requires discipline and proper execution. Avoid these common errors:
Mistake 1: Ignoring Volume Analysis
Problem: Focusing only on price action without volume confirmation Solution: Always analyze volume patterns using VSA principles Prevention: Develop checklist including volume criteria
Mistake 2: Premature Entry
Problem: Entering before pattern completion Solution: Wait for full confirmation before trading Prevention: Define clear entry criteria and stick to them
Mistake 3: Poor Stop Placement
Problem: Stops too tight or too wide Solution: Base stops on pattern structure, not arbitrary levels Prevention: Calculate stop distance before entering trades
:::warning The biggest mistake traders make is treating every false breakout as a spring or upthrust. These patterns require specific market context and volume characteristics to be valid. :::
Mistake 4: Neglecting Market Context
Problem: Trading patterns without considering broader market conditions Solution: Analyze multiple timeframes and market phases Prevention: Always assess the bigger picture before trading
Advanced Pattern Recognition Techniques
Experienced traders can enhance their spring and upthrust pattern recognition through advanced techniques:
Multiple Timeframe Analysis
Daily Chart Context:
- Identify major support/resistance levels
- Understand broader market phase (accumulation/distribution)
- Locate patterns within larger market structure
4-Hour Chart Patterns:
- Fine-tune entry and exit timing
- Confirm pattern validity
- Identify secondary patterns
1-Hour Chart Execution:
- Precise entry timing
- Intraday pattern confirmation
- Short-term risk management
Combined Pattern Analysis
Wyckoff Schematics:
- Place patterns within complete Wyckoff cycles
- Understand accumulation and distribution phases
- Anticipate future price movements
VSA Integration:
- Combine with other VSA signals
- Look for clustering of bullish/bearish signs
- Use volume climax analysis
:::example Advanced Setup: A spring develops at the end of a Wyckoff accumulation phase on the daily chart. The 4-hour chart shows a clear trading range, and the 1-hour chart provides precise entry timing as price reclaims support with expanding volume. This multi-timeframe confirmation significantly increases the probability of success. :::
Pattern Variations
Secondary Springs:
- Springs that develop after initial springs
- Often provide excellent entry opportunities
- Require careful volume analysis
Compound Upthrusts:
- Multiple false breakouts above resistance
- Show persistent distribution by institutions
- Often lead to significant declines
Terminal Springs/Upthrusts:
- Final patterns before major trend changes
- Occur at the end of long-term trends
- Provide exceptional risk-reward opportunities
Conclusion
Mastering the spring and upthrust pattern through Wyckoff Method and Volume Spread Analysis provides traders with powerful tools for identifying high-probability reversal opportunities. These patterns reveal the hidden activities of institutional traders and offer precise entry points when properly executed.
Key takeaways for successful trading of these patterns:
- Context is crucial: Always analyze patterns within broader market structure and phases
- Volume tells the story: Use VSA principles to confirm pattern validity
- Patience pays: Wait for complete pattern development before entering trades
- Risk management first: Always define stops and position size before entering
- Practice makes perfect: Study historical examples and paper trade before risking capital
The spring and upthrust pattern represents one of the most reliable reversal signals available to traders. By understanding the underlying market psychology and institutional behavior that creates these patterns, you can position yourself to profit from market turning points while avoiding the traps that catch retail traders.
Remember that successful pattern trading requires combining technical analysis with proper risk management and psychological discipline. These patterns are not foolproof signals but rather high-probability setups that, when traded correctly, can significantly improve your trading results.
Ready to enhance your trading skills? Start by studying charts to identify historical spring and upthrust patterns. Practice your pattern recognition on demo accounts before implementing these strategies with real money. Focus on quality setups rather than quantity, and always prioritize risk management over profit potential.