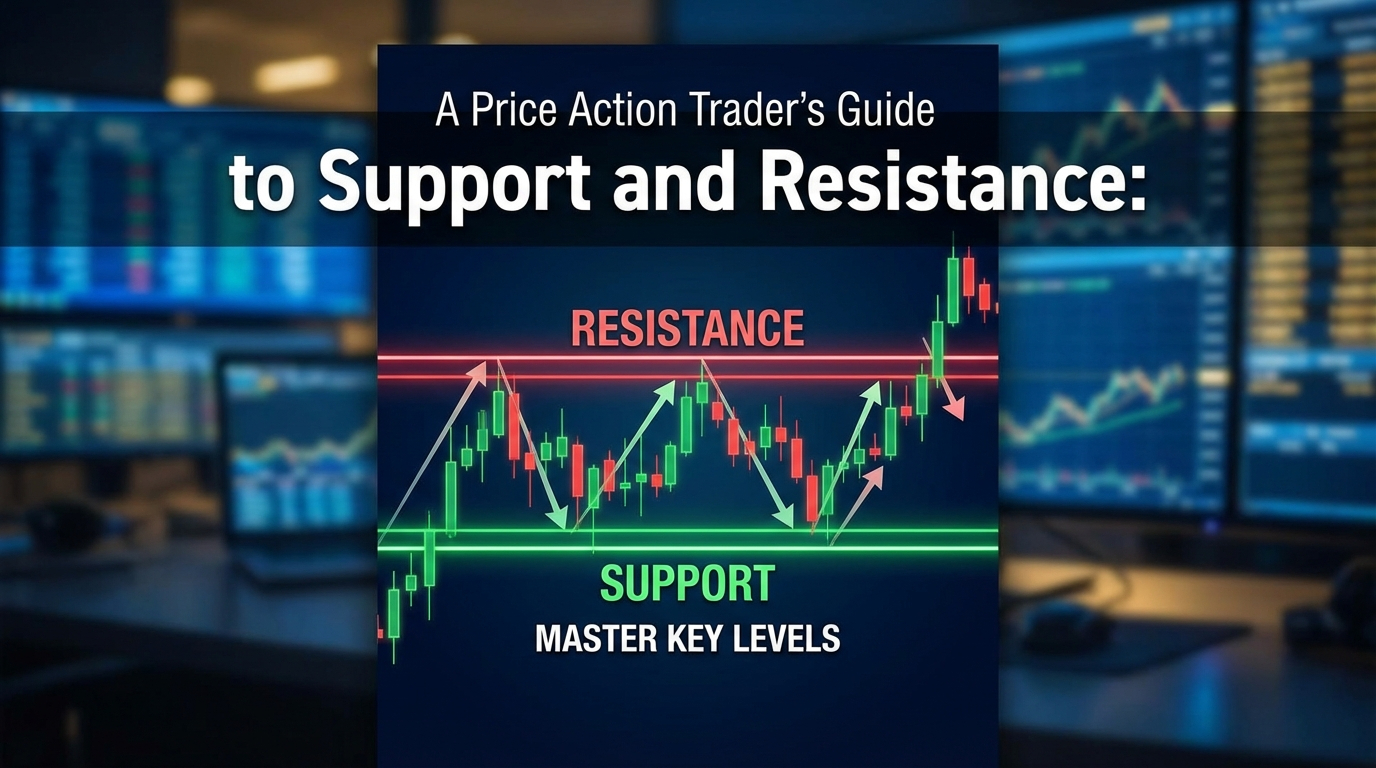
# A Price Action Trader's Guide to Support and Resistance: Master Key Levels
Support and resistance levels form the backbone of price action trading, serving as critical decision points where buying and selling pressure converge. Understanding how to identify and trade these key levels can dramatically improve your trading performance and provide a solid foundation for making informed trading decisions.
:::key-concept Support and resistance represent psychological and technical price levels where the balance between buyers and sellers shifts, creating potential turning points in market direction. :::
Table of Contents
- [Understanding Support and Resistance Fundamentals](#understanding-support-and-resistance-fundamentals)
- [Identifying Key Levels Through Price Action](#identifying-key-levels-through-price-action)
- [Types of Support and Resistance Levels](#types-of-support-and-resistance-levels)
- [Trading Strategies for Key Levels](#trading-strategies-for-key-levels)
- [Advanced Techniques and Confirmation Signals](#advanced-techniques-and-confirmation-signals)
- [Common Mistakes and Risk Management](#common-mistakes-and-risk-management)
- [Conclusion](#conclusion)
Understanding Support and Resistance Fundamentals
Support and resistance levels are among the most fundamental concepts in technical analysis and price action trading. These levels represent areas where price has historically shown a tendency to reverse or pause, creating natural barriers to price movement.
Support occurs when a downtrend pauses due to increased buying interest at a particular price level. Think of it as a floor that temporarily prevents price from falling further. When price approaches a support level, buyers step in, absorbing selling pressure and potentially pushing price higher.
Resistance forms when an uptrend stalls due to increased selling pressure at a specific price point. This acts like a ceiling, preventing price from moving higher. At resistance levels, sellers become more aggressive, overwhelming buying pressure and potentially driving price lower.
:::example Consider a stock that repeatedly bounces off $50 during pullbacks in an uptrend. This $50 level becomes a key support zone. Conversely, if the same stock struggles to break above $75 multiple times, that level acts as resistance. :::
The psychological aspect of these levels cannot be overstated. Traders remember significant price points where major moves began or ended, creating a self-fulfilling prophecy as market participants react similarly when price revisits these areas.
The Role of Market Memory
Markets have memory, and price action support and resistance levels reflect this collective memory of previous price interactions. When price returns to a level where significant trading activity occurred previously, market participants often react based on their previous experiences at that level.
This market memory manifests in several ways:
- Round Numbers: Psychological levels ending in 00, 50, or other round numbers
- Previous Highs and Lows: Swing points that marked important turning points
- Volume Clusters: Areas where significant trading volume occurred
- Gap Levels: Price gaps that may act as future support or resistance
Identifying Key Levels Through Price Action
Successful identification of support and resistance requires developing a keen eye for price behavior and understanding what makes certain levels more significant than others. Price action traders rely on pure chart analysis without the need for complex indicators.
Historical Price Reactions
The most reliable support and resistance levels are those where price has reacted multiple times. Look for areas where:
1. Multiple Touches: Price has tested the level at least twice with clear reactions 2. Time Significance: The level has held relevance over extended periods 3. Volume Confirmation: Higher volume accompanied the price reactions at these levels 4. Clean Reactions: Price showed decisive moves away from the level rather than choppy, indecisive action
:::tip Focus on levels that stand out visually on your charts. If you need to squint or draw multiple lines to justify a level, it's probably not as significant as you think. :::
Drawing Support and Resistance Lines
When marking these levels on your charts:
- Use Zones, Not Lines: Think of support and resistance as areas rather than exact price points
- Connect Meaningful Points: Draw lines through significant swing highs and lows
- Consider Wicks vs. Bodies: Decide whether to focus on candlestick wicks or closing prices
- Maintain Perspective: What matters on a daily chart may be irrelevant on a 5-minute chart
The Strength Hierarchy
Not all support and resistance levels are created equal. Understanding the hierarchy helps prioritize which levels deserve more attention:
1. Weekly/Monthly Levels: Strongest and most reliable 2. Daily Levels: Strong for swing trading decisions 3. 4-Hour Levels: Good for intraday position management 4. 1-Hour and Below: Tactical entry and exit points
Types of Support and Resistance Levels
Price action support and resistance manifests in various forms, each with unique characteristics and trading implications. Recognizing these different types enhances your ability to anticipate price behavior.
Horizontal Support and Resistance
These are the most common and easiest to identify. Horizontal levels form when price repeatedly reacts at similar price points, creating clear zones of buying or selling interest.
Characteristics:
- Clear horizontal price level
- Multiple touches with visible reactions
- Often coincide with round numbers or previous significant levels
:::example A currency pair that consistently finds support at 1.2000 during pullbacks creates a strong horizontal support level. Traders anticipate buying opportunities near this level. :::
Dynamic Support and Resistance
Dynamic levels move with price over time, typically following trend lines, moving averages, or other price-based constructs.
Trend Line Support/Resistance:
- Connect consecutive swing lows (support) or highs (resistance)
- Steeper angles indicate stronger momentum
- Breaks often signal trend changes
Moving Average Dynamic Levels:
- Price often respects key moving averages as support or resistance
- 50, 100, and 200-period averages are commonly watched
- Multiple time frame alignment increases significance
Fibonacci Levels
While technically an indicator, Fibonacci retracements identify potential support and resistance levels based on natural mathematical ratios observed in markets.
Key Fibonacci Levels:
- 38.2% retracement: Shallow pullback level
- 50.0% retracement: Psychological midpoint
- 61.8% retracement: Golden ratio, often significant
- 78.6% retracement: Deep pullback level
:::warning Fibonacci levels work best when combined with other price action confirmations rather than traded in isolation. :::
Pivot Points and Floor Levels
These mathematical levels, calculated from previous period's high, low, and close, provide predetermined support and resistance levels for the current trading session.
Standard Pivot Levels:
- Central Pivot Point (PP)
- Support levels (S1, S2, S3)
- Resistance levels (R1, R2, R3)
Trading Strategies for Key Levels
Having identified significant price action support and resistance levels, the next step involves developing systematic approaches to trade these levels profitably.
The Bounce Strategy
This approach involves buying at support levels or selling at resistance levels, anticipating price will reverse direction.
Entry Criteria: 1. Price approaches a well-established support or resistance level 2. Look for rejection signals (long wicks, reversal candlestick patterns) 3. Volume should ideally increase on the rejection 4. Enter on confirmation, not prediction
Risk Management:
- Place stop loss beyond the support/resistance level
- Target the opposite level or previous swing point
- Use position sizing appropriate to your account
:::example EUR/USD approaches strong support at 1.1800. You notice a hammer candlestick with high volume at this level. Enter long above the hammer's high with a stop loss below 1.1780 and target resistance at 1.1900. :::
The Breakout Strategy
This strategy capitalizes on momentum when price decisively breaks through established support or resistance levels.
Breakout Confirmation:
- Strong volume accompanying the break
- Decisive price movement, not slow grinding
- Follow-through in subsequent periods
- Retest of broken level as new support/resistance
Entry Approaches: 1. Immediate Entry: Enter as price breaks the level 2. Pullback Entry: Wait for retest of broken level before entering 3. Continuation Entry: Enter after brief consolidation above/below the level
False Break Recognition
Not all breaks are genuine. Recognizing false breakouts protects capital and can provide profitable counter-trend opportunities.
False Break Characteristics:
- Low volume on the break
- Immediate return back inside the range
- Weak follow-through after the break
- Break occurs during low liquidity periods
:::tip False breaks often lead to strong moves in the opposite direction as trapped traders exit their positions. :::
Advanced Techniques and Confirmation Signals
Seasoned price action traders enhance their support and resistance analysis with additional techniques that improve timing and reduce false signals.
Multiple Time Frame Analysis
Analyzing support and resistance across different time frames provides context and improves decision-making.
Time Frame Alignment Process: 1. Identify key levels on higher time frames (daily/weekly) 2. Use intermediate time frames (4H/1H) for entry timing 3. Employ lower time frames for precise entry points 4. Ensure all time frames support your trading bias
Volume Analysis Integration
Volume provides crucial confirmation for support and resistance levels:
High Volume at Levels:
- Increases level significance
- Suggests strong institutional interest
- Often precedes major moves
Volume Patterns:
- Increasing volume on approach to level
- Volume spikes on rejections
- High volume breakouts more likely to succeed
:::key-concept Volume is the fuel behind price movement. Without volume, even the strongest-looking levels may fail to hold. :::
Candlestick Pattern Confirmation
Combining support/resistance analysis with candlestick patterns enhances signal reliability:
Reversal Patterns at Levels:
- Hammer/Shooting Star at key levels
- Engulfing patterns showing momentum shift
- Doji indicating indecision at critical points
Continuation Patterns:
- Flag/Pennant formations near levels
- Inside bars showing consolidation
- Marubozu candles indicating strong momentum
Market Structure Context
Understanding broader market structure provides context for support and resistance trading:
Trend Context:
- Support more reliable in uptrends
- Resistance more reliable in downtrends
- Range-bound markets offer both opportunities
Market Phases:
- Accumulation phases: Support levels hold better
- Distribution phases: Resistance levels more significant
- Markup/Markdown phases: Dynamic levels more relevant
Common Mistakes and Risk Management
Even experienced traders make mistakes when trading support and resistance levels. Understanding common pitfalls helps avoid costly errors.
Typical Trading Mistakes
Overconfidence in Levels:
- Assuming all support/resistance will hold
- Ignoring broader market context
- Trading every level regardless of quality
Poor Entry Timing:
- Entering too early without confirmation
- Chasing price after significant moves
- Ignoring multiple time frame analysis
Inadequate Risk Management:
- Stops placed too close to entry
- Position sizes too large for account
- No profit-taking strategy
:::warning Never risk more than you can afford to lose on any single trade, regardless of how confident you are in a support or resistance level. :::
Proper Risk Management Framework
Position Sizing:
- Risk only 1-2% of account per trade
- Adjust position size based on stop loss distance
- Consider correlation between positions
Stop Loss Placement:
- Place stops beyond significant levels, not just beyond entry
- Account for normal market volatility
- Consider using percentage-based or ATR-based stops
Profit Taking Strategies:
- Take partial profits at logical resistance/support
- Trail stops to protect gains
- Have predetermined exit criteria
Building a Support and Resistance Trading Plan
Developing a systematic approach ensures consistent application of your analysis:
1. Market Preparation:
- Identify key levels across multiple time frames
- Note upcoming news/events that might affect levels
- Prepare multiple scenarios and responses
2. Trade Execution:
- Wait for confirmation before entering
- Execute according to predetermined rules
- Document reasoning for later review
3. Trade Management:
- Monitor price action around levels
- Adjust stops and targets based on developing action
- Be prepared to exit if analysis proves wrong
4. Post-Trade Analysis:
- Review what worked and what didn't
- Update level significance based on market reaction
- Learn from both winning and losing trades
Conclusion
Mastering price action support and resistance is fundamental to successful trading across all markets and time frames. These levels represent the collective psychology of market participants and provide valuable insights into potential price behavior.
Key takeaways for effective support and resistance trading include:
- Quality over Quantity: Focus on the most significant, well-tested levels rather than marking every minor swing point
- Context Matters: Always consider broader market structure, trend direction, and multiple time frame analysis
- Confirmation is Critical: Wait for price action confirmation rather than anticipating reactions at levels
- Risk Management: Proper position sizing and stop loss placement are essential for long-term success
- Continuous Learning: Market dynamics evolve, so continuously refine your approach based on experience and changing conditions
Successful price action support and resistance trading requires patience, discipline, and consistent application of sound principles. The levels themselves are just part of the equation – how you interpret and act on the price action around these levels determines your trading success.
Remember that no support or resistance level is guaranteed to hold forever. Markets are dynamic, and what was once strong support can become resistance, and vice versa. Stay flexible in your analysis while maintaining disciplined execution of your trading plan.
Develop your skills by practicing chart analysis across different markets and time frames. Start with clear, obvious levels before progressing to more subtle or complex situations. With time and experience, you'll develop the intuition necessary to identify high-probability setups and manage trades effectively around these critical price levels.
Take action today by analyzing your favorite trading instruments for key support and resistance levels. Practice identifying these levels, planning potential trades, and managing risk appropriately. The combination of solid technical analysis and disciplined execution will serve you well in your trading journey.