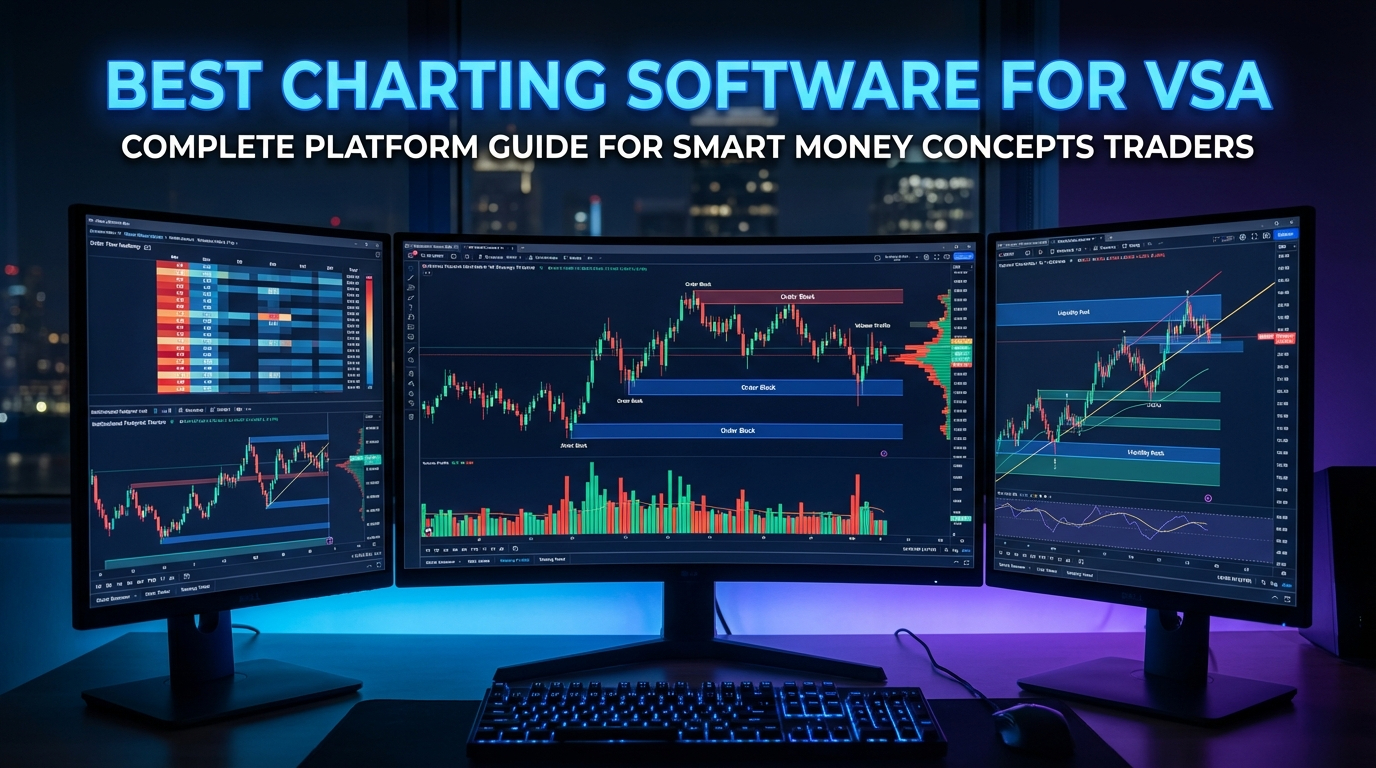
# Best Charting Software for VSA: Complete Platform Guide for Smart Money Concepts Traders
Volume Spread Analysis (VSA) and Smart Money Concepts (SMC) have revolutionized how professional traders read market dynamics. However, the effectiveness of these methodologies heavily depends on having the right charting software that can properly display volume data, price action patterns, and institutional footprints.
Choosing the best charting software for VSA isn't just about having fancy indicators—it's about finding platforms that provide clean price visualization, accurate volume data, and the analytical tools necessary to track smart money movements. Whether you're analyzing order blocks, liquidity grabs, or volume climaxes, your charting platform becomes your window into institutional trading behavior.
In this comprehensive guide, we'll explore the top charting platforms specifically suited for VSA and SMC analysis, examining their unique features, strengths, and how they can enhance your trading performance.
Table of Contents
- [Essential Features for VSA Charting Software](#essential-features-for-vsa-charting-software)
- [Top Charting Platforms for VSA Traders](#top-charting-platforms-for-vsa-traders)
- [Advanced Tools for Smart Money Analysis](#advanced-tools-for-smart-money-analysis)
- [Platform Comparison and Selection Guide](#platform-comparison-and-selection-guide)
- [Setting Up Your VSA Trading Environment](#setting-up-your-vsa-trading-environment)
- [Conclusion](#conclusion)
Essential Features for VSA Charting Software
Before diving into specific platforms, it's crucial to understand what makes charting software truly effective for Volume Spread Analysis and Smart Money Concepts trading.
Volume Data Accuracy and Display
The foundation of VSA lies in accurate volume interpretation. The best charting software for VSA must provide:
- Real-time volume data: Tick-by-tick volume updates for precise analysis
- Volume histogram customization: Ability to modify colors, transparency, and scaling
- Multiple volume types: Support for tick volume, real volume, and delta volume
- Historical volume data: Access to extensive volume history for pattern recognition
:::key-concept Volume Spread Analysis requires precise volume data because the relationship between price movement and volume reveals institutional activity. Inaccurate or delayed volume data can lead to misreading market intentions. :::
Price Action Visualization
Clean price action display is non-negotiable for VSA and SMC traders:
- Multiple timeframe analysis: Seamless switching between timeframes without losing context
- Candlestick customization: Adjustable colors, wicks, and body styles for better pattern recognition
- Clean chart interface: Minimal distractions to focus on pure price action
- Overlay capabilities: Ability to overlay multiple instruments for correlation analysis
Drawing and Annotation Tools
SMC and VSA require extensive chart markup capabilities:
- Advanced drawing tools: Trend lines, rectangles, ellipses, and custom shapes
- Order block marking: Tools to highlight institutional order zones
- Liquidity level marking: Horizontal lines and zones for key levels
- Note-taking functionality: Ability to add context and observations directly on charts
:::tip The most successful VSA traders use extensive chart annotations to track institutional behavior patterns. Look for platforms that save your markings across sessions and allow easy template creation. :::
Top Charting Platforms for VSA Traders
TradingView: The Popular Choice
TradingView has gained massive popularity among retail traders, and for good reason when it comes to VSA analysis.
Strengths for VSA Trading:
- Excellent volume visualization with customizable histograms
- Pine Script capability for custom VSA indicators
- Multiple timeframe analysis in a single view
- Social features for sharing VSA setups and ideas
- Clean, intuitive interface ideal for price action reading
- Extensive replay functionality for backtesting VSA concepts
Limitations:
- Volume data quality can vary by market and data provider
- Limited order flow data compared to professional platforms
- Some advanced institutional tools require third-party indicators
:::example A VSA trader using TradingView might create a custom Pine Script indicator that highlights high volume reversals with specific spread characteristics, automatically marking potential climactic action points on the chart. :::
NinjaTrader: Professional-Grade Analysis
NinjaTrader stands out as one of the most comprehensive platforms for serious VSA practitioners.
Strengths for VSA Trading:
- Superior volume analysis tools including Volume Profile and Market Profile
- Advanced order flow indicators like Cumulative Delta and Volume Delta
- Extensive backtesting capabilities for VSA strategies
- Professional-grade drawing tools and chart management
- Real-time Level II data for deeper market insight
- Custom indicator development with C# programming
Considerations:
- Steeper learning curve compared to simpler platforms
- Higher cost for professional features
- Primarily focused on futures markets (limited forex VSA capabilities)
MetaTrader 5: Forex VSA Specialist
While MetaTrader 5 might not be the first choice for many traders, it offers unique advantages for forex VSA analysis.
Strengths for VSA Trading:
- True tick volume data for forex markets
- Robust custom indicator capabilities through MQL5
- Economic calendar integration for fundamental VSA context
- Multiple timeframe analysis capabilities
- Built-in volume indicators suitable for VSA base analysis
Best Use Cases:
- Forex-focused VSA trading
- Traders requiring basic but reliable VSA tools
- Cost-conscious traders seeking professional features
:::warning Forex markets don't have centralized volume data like stock or futures markets. The volume shown in forex platforms is typically tick volume, which can still be valuable for VSA analysis but represents price changes rather than actual traded volume. :::
Sierra Chart: Advanced Volume Analysis
Sierra Chart represents the pinnacle of technical analysis platforms, particularly for volume-based strategies.
Strengths for VSA Trading:
- Unmatched volume analysis capabilities
- Advanced studies like Volume by Price, Market Profile, and Liquidity tracking
- Professional-grade order flow tools
- Extensive historical data access
- High-frequency data support for precise volume analysis
- Custom study development capabilities
Considerations:
- Complex interface requiring significant learning investment
- Higher cost structure
- Primarily designed for professional traders
Advanced Tools for Smart Money Analysis
Order Flow Integration
The best charting software for VSA should integrate order flow analysis seamlessly with traditional volume analysis.
Key Order Flow Features:
- Cumulative Delta: Shows buying vs. selling pressure over time
- Volume Profile: Displays volume distribution across price levels
- Market Profile: Reveals market acceptance and rejection zones
- Footprint Charts: Shows volume at each price level within individual candles
:::key-concept Order flow analysis complements VSA by providing granular insight into how volume is distributed across different price levels, revealing institutional accumulation and distribution patterns that pure VSA might miss. :::
Smart Money Concept Tools
Modern charting platforms are increasingly incorporating SMC-specific tools:
- Order Block Detection: Automated identification of institutional order zones
- Fair Value Gap Marking: Tools to highlight imbalanced price areas
- Liquidity Pool Identification: Markers for areas of concentrated stop losses
- Structure Break Analysis: Tools to identify market structure changes
Custom Indicator Development
The ability to create custom VSA indicators separates professional platforms from basic charting software:
Programming Capabilities:
- Pine Script (TradingView): Accessible for traders with basic programming knowledge
- NinjaScript (NinjaTrader): More powerful but requires C# knowledge
- MQL5 (MetaTrader 5): Extensive capabilities for custom VSA tools
- ACSIL (Sierra Chart): Professional-grade development environment
:::tip Many successful VSA traders develop custom indicators that combine multiple VSA principles into single, easy-to-read signals. Consider platforms that offer indicator development capabilities as you advance in your VSA journey. :::
Platform Comparison and Selection Guide
Feature Comparison Matrix
| Platform | Volume Quality | VSA Tools | Order Flow | Learning Curve | Cost | |----------|---------------|-----------|------------|---------------|------| | TradingView | Good | Excellent | Limited | Easy | Low-Medium | | NinjaTrader | Excellent | Excellent | Excellent | Steep | High | | MetaTrader 5 | Good (Forex) | Good | Limited | Medium | Low | | Sierra Chart | Excellent | Excellent | Excellent | Very Steep | High |
Selection Criteria by Trader Type
Beginner VSA Traders:
- TradingView for its user-friendly interface and learning resources
- MetaTrader 5 for cost-effective forex VSA analysis
- Focus on platforms with extensive educational content and community support
Intermediate Traders:
- NinjaTrader for balanced features and professional tools
- TradingView Pro for advanced charting and indicator development
- Consider platforms offering both manual analysis tools and some automation
Professional/Advanced Traders:
- Sierra Chart for maximum analytical depth
- NinjaTrader for futures-focused VSA trading
- Prioritize platforms with extensive customization and development capabilities
:::example A day trader focusing on ES futures VSA analysis might choose NinjaTrader for its superior volume analysis tools and real-time order flow data, while a swing trader analyzing forex pairs might find TradingView's multi-timeframe analysis and social features more valuable. :::
Market-Specific Considerations
Stock Market VSA:
- Requires platforms with access to real volume data (not tick volume)
- TradingView and NinjaTrader offer excellent stock market VSA capabilities
- Consider data feed quality and real-time vs. delayed data options
Forex VSA:
- Must work with tick volume data effectively
- MetaTrader 5 and TradingView handle forex VSA well
- Look for platforms that clearly distinguish between tick and real volume
Futures VSA:
- Benefits from true volume and order flow data
- NinjaTrader and Sierra Chart excel in futures VSA analysis
- Consider platforms with advanced order flow and market profile tools
Cryptocurrency VSA:
- Requires exchanges with accurate volume reporting
- TradingView offers excellent crypto VSA capabilities
- Be aware of volume manipulation in some crypto markets
Setting Up Your VSA Trading Environment
Chart Configuration for VSA Analysis
Proper chart setup is crucial for effective VSA analysis, regardless of your chosen platform.
Essential Chart Elements: 1. Clean candlestick display: Use colors that clearly distinguish bullish from bearish candles 2. Volume histogram: Position below price action with appropriate scaling 3. Key level markings: Horizontal lines for significant support/resistance 4. Multiple timeframes: Quick access to higher and lower timeframe contexts
Recommended Timeframe Combinations:
- Day Trading: 1-minute, 5-minute, 15-minute, and 1-hour
- Swing Trading: 15-minute, 1-hour, 4-hour, and daily
- Position Trading: 1-hour, 4-hour, daily, and weekly
:::tip The best VSA traders often use a "top-down" approach, starting with higher timeframes to identify the overall market context before drilling down to their trading timeframe for precise entry and exit points. :::
Workspace Organization
Multi-Monitor Setup:
- Primary monitor: Main trading timeframe with full VSA indicators
- Secondary monitor: Higher timeframe context and watchlists
- Third monitor: Lower timeframe for precise entries (if day trading)
Single Monitor Optimization:
- Use tabbed layouts to quickly switch between timeframes
- Implement split-screen views for simultaneous multi-timeframe analysis
- Utilize pop-up windows for detailed volume analysis
Custom Indicator Setup
Regardless of platform, certain custom indicators can enhance VSA analysis:
Volume-Based Indicators:
- Volume Rate of Change (VROC)
- Volume-Weighted Average Price (VWAP)
- On-Balance Volume (OBV) variations
- Custom volume climax indicators
Price Action Indicators:
- Support and resistance zone indicators
- Trend strength indicators
- Volatility-adjusted volume indicators
:::warning While indicators can enhance VSA analysis, remember that VSA is fundamentally about reading raw price and volume relationships. Don't let indicators replace your ability to read charts manually—use them as confirmation tools rather than primary decision-makers. :::
Data Feed Considerations
The quality of your VSA analysis depends heavily on data feed quality:
Real-Time vs. Delayed Data:
- Real-time data essential for day trading VSA
- Delayed data acceptable for swing and position trading
- Consider cost vs. benefit for your trading style
Volume Data Quality:
- Verify volume data accuracy with your broker or data provider
- Understand the difference between tick volume and real volume
- Consider multiple data feeds for cross-verification
Historical Data Depth:
- Ensure sufficient historical data for pattern recognition
- Consider platforms offering tick-level historical data for detailed analysis
- Verify data integrity, especially around market events
Conclusion
Selecting the best charting software for VSA requires balancing your specific trading needs, experience level, and budget constraints. TradingView offers an excellent entry point with its user-friendly interface and robust VSA capabilities, while NinjaTrader provides professional-grade tools for serious practitioners. MetaTrader 5 serves forex-focused VSA traders well, and Sierra Chart delivers unmatched analytical depth for advanced users.
The key to success lies not just in choosing the right platform, but in properly configuring it for VSA analysis and developing the skills to interpret the volume-price relationships it reveals. Remember that even the most sophisticated charting software is only as effective as the trader using it.
Start with a platform that matches your current skill level and gradually upgrade as your VSA knowledge and trading capital grow. Focus on mastering the core VSA principles using your chosen platform's tools, and don't get caught up in having every possible indicator or feature.
Ready to enhance your VSA trading analysis? Choose a platform from this guide, set up your charts using the configurations we've discussed, and start practicing your volume spread analysis skills. The combination of the right tools and dedicated practice will significantly improve your ability to read smart money movements and make more informed trading decisions.