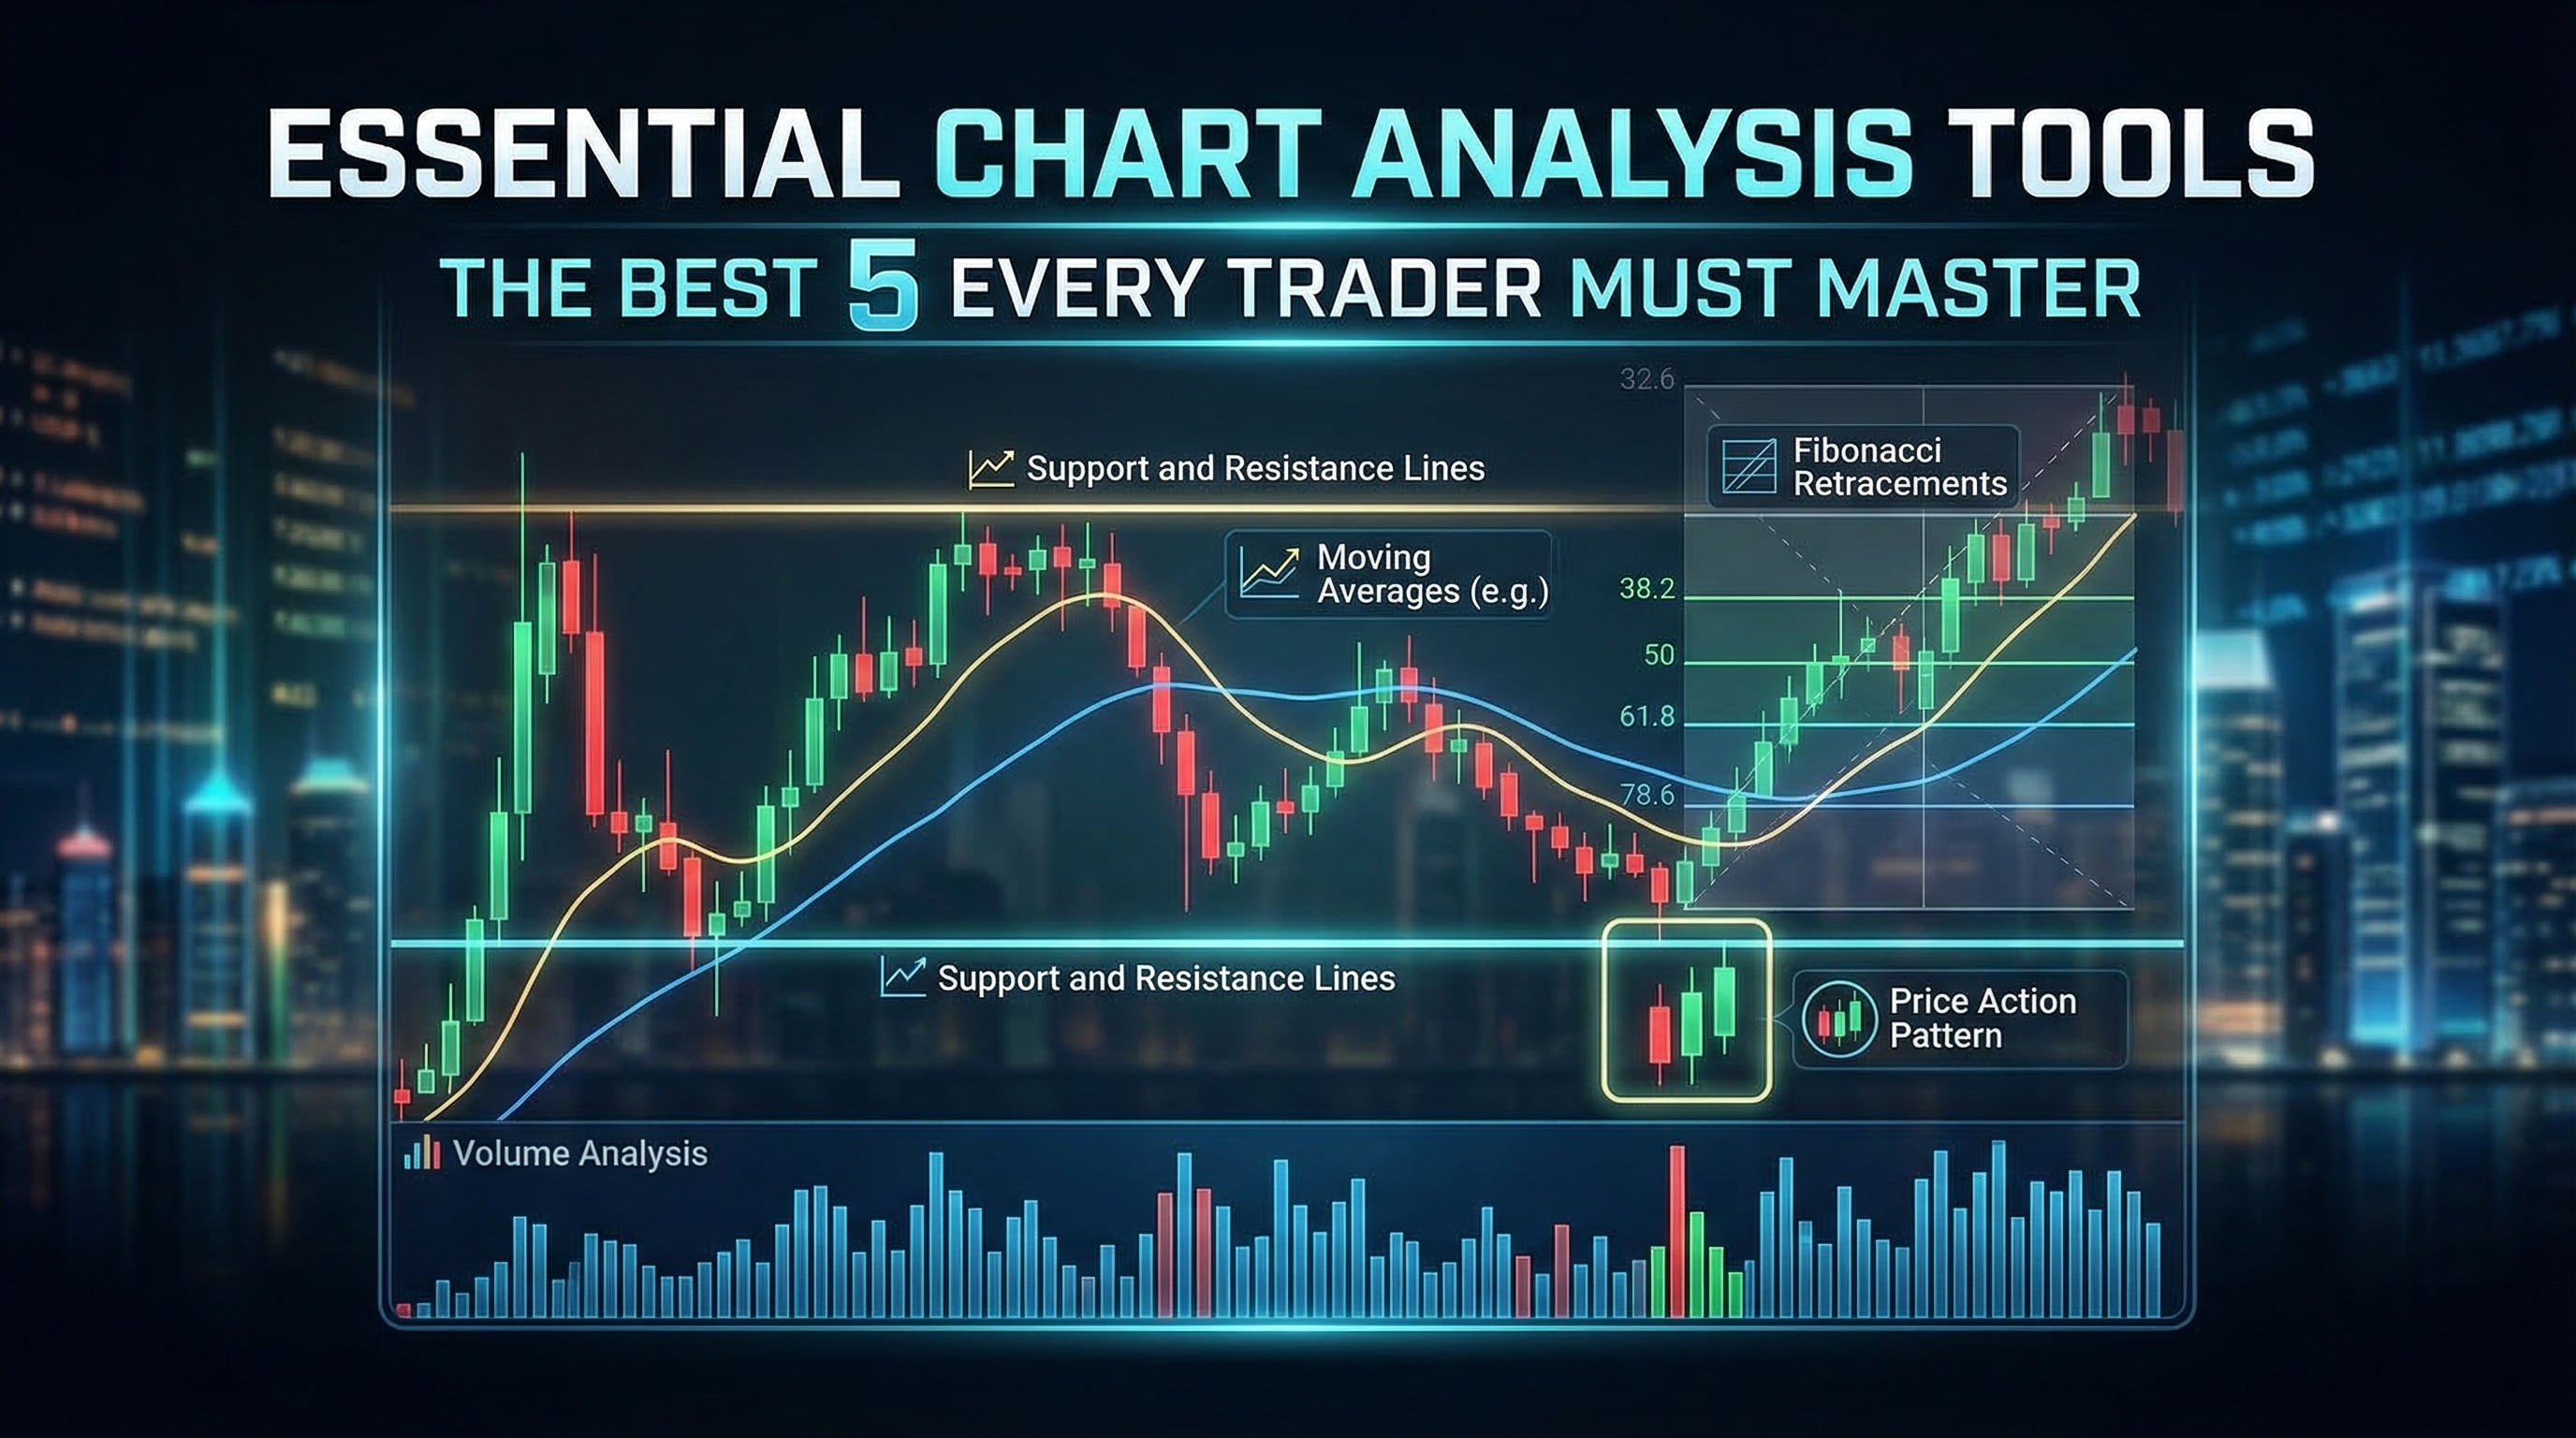
# Essential Chart Analysis Tools: The Best 5 Every Trader Must Master
Chart analysis forms the backbone of successful trading. Whether you're analyzing forex pairs, stocks, or cryptocurrencies, having the right tools at your disposal can mean the difference between profitable trades and costly mistakes. In this comprehensive guide, we'll explore the best chart analysis tools that every serious trader should master.
From identifying market structure to timing precise entries and exits, these five essential tools will transform how you approach the markets. Let's dive into each tool and discover how to leverage them for consistent trading success.
Table of Contents
- [Why Chart Analysis Tools Matter](#why-chart-analysis-tools-matter)
- [Tool 1: Support and Resistance Lines](#tool-1-support-and-resistance-lines)
- [Tool 2: Moving Averages](#tool-2-moving-averages)
- [Tool 3: Volume Analysis](#tool-3-volume-analysis)
- [Tool 4: Fibonacci Retracements](#tool-4-fibonacci-retracements)
- [Tool 5: Price Action Patterns](#tool-5-price-action-patterns)
- [Combining Tools for Maximum Effectiveness](#combining-tools-for-maximum-effectiveness)
- [Conclusion](#conclusion)
Why Chart Analysis Tools Matter
Chart analysis tools serve as your roadmap through the complex world of financial markets. These tools help you:
- Identify high-probability trading opportunities
- Determine optimal entry and exit points
- Manage risk effectively
- Understand market sentiment and momentum
- Make objective, data-driven decisions
:::key-concept The most successful traders don't rely on gut feelings or market rumors. They use proven chart analysis tools to make informed decisions based on price action and market data. :::
Professional traders understand that markets move in patterns, and these patterns can be identified and analyzed using the right tools. By mastering these best chart analysis tools, you'll develop the skills needed to read market intentions and position yourself ahead of major moves.
Tool 1: Support and Resistance Lines
Support and resistance levels are fundamental concepts that form the foundation of technical analysis. These horizontal lines represent price levels where buying or selling pressure has historically been strong enough to halt or reverse price movement.
Understanding Support and Resistance
Support represents a price level where demand is strong enough to prevent further decline. Think of it as a floor that price bounces off.
Resistance represents a price level where selling pressure is strong enough to prevent further advance. This acts like a ceiling that price struggles to break through.
How to Draw Support and Resistance Lines
1. Identify significant highs and lows on your chart 2. Connect multiple touch points - the more touches, the stronger the level 3. Use horizontal lines for clear support and resistance zones 4. Consider round numbers - psychological levels often act as support/resistance
:::example On a EUR/USD daily chart, if price has bounced off 1.1000 three times over several months, this becomes a strong support level. Traders often look to buy near this level with tight stop losses below. :::
Trading Strategies Using Support and Resistance
- Bounce plays: Buy at support, sell at resistance
- Breakout trades: Enter when price breaks through key levels
- Role reversal: Previous support becomes resistance and vice versa
:::tip Always wait for confirmation before trading support and resistance breaks. A single candle close beyond the level isn't enough - look for follow-through and volume confirmation. :::
Tool 2: Moving Averages
Moving averages are among the most versatile and widely used chart analysis tools. They smooth out price data to help identify trend direction, momentum, and potential reversal points.
Types of Moving Averages
Simple Moving Average (SMA): Calculates the average price over a specific number of periods Exponential Moving Average (EMA): Gives more weight to recent prices, making it more responsive to current market conditions
Popular Moving Average Combinations
- 20 and 50 EMA: Great for identifying short-term trends
- 50 and 200 SMA: Classic combination for long-term trend analysis
- 8, 21, and 55 EMA: Popular among swing traders
Moving Average Trading Strategies
1. Trend Following: Trade in the direction of the moving average slope 2. Crossover Strategy: Enter trades when faster MA crosses above/below slower MA 3. Dynamic Support/Resistance: Use MAs as areas where price might bounce 4. Golden Cross/Death Cross: 50 MA crossing above/below 200 MA signals major trend changes
:::example When the 20 EMA crosses above the 50 EMA on a stock chart, this often signals the beginning of an uptrend. Traders might enter long positions and use the 20 EMA as a dynamic support level for stop loss placement. :::
Advanced Moving Average Techniques
- Multiple timeframe analysis: Check MA alignment across different timeframes
- MA ribbon: Use multiple MAs to gauge trend strength
- Price and MA relationship: Strong trends keep price above/below key MAs
:::warning Moving averages work best in trending markets. In sideways, choppy conditions, they can produce false signals and whipsaws. :::
Tool 3: Volume Analysis
Volume is the fuel that drives price movement. Without adequate volume, even the most promising chart patterns can fail. Understanding volume analysis gives you insight into the strength and conviction behind price moves.
Why Volume Matters
Volume provides crucial information that price alone cannot:
- Confirms price movements: High volume validates breakouts and trends
- Reveals accumulation/distribution: Smart money often moves with volume
- Identifies exhaustion: Declining volume can signal trend weakness
- Spots manipulation: Unusual volume spikes may indicate institutional activity
Key Volume Indicators
Volume Bars: The most basic form of volume analysis Volume Moving Average: Smoothed volume to identify above/below average activity On-Balance Volume (OBV): Cumulative volume indicator showing money flow Volume Profile: Shows volume distribution at different price levels
Volume Analysis Strategies
1. Confirm breakouts: Look for increasing volume on breakouts 2. Identify reversals: Climax volume often marks trend ends 3. Validate trends: Healthy trends show consistent volume participation 4. Spot accumulation: Rising prices on increasing volume suggests strong demand
:::key-concept The relationship between price and volume tells a story. Rising prices on increasing volume shows genuine buying interest, while rising prices on declining volume suggests weakness. :::
Practical Volume Analysis Tips
- Compare current volume to recent average volume
- Look for volume spikes at key support/resistance levels
- Use volume to confirm chart pattern breakouts
- Watch for volume divergences with price action
:::example If Bitcoin breaks above a major resistance level at $50,000 with volume that's 3x the daily average, this suggests genuine buying pressure and increases the likelihood of continued upward movement. :::
Tool 4: Fibonacci Retracements
Fibonacci retracements are powerful tools for identifying potential reversal levels during pullbacks in trending markets. Based on mathematical ratios found throughout nature, these levels often act as support and resistance zones.
Understanding Fibonacci Levels
The key Fibonacci retracement levels are:
- 23.6%: Minor retracement level
- 38.2%: Common retracement in strong trends
- 50%: Psychological level (not technically a Fibonacci ratio)
- 61.8%: The "golden ratio" - most significant level
- 78.6%: Deep retracement level
How to Use Fibonacci Retracements
1. Identify the trend: Determine if you're in an uptrend or downtrend 2. Find the swing points: Locate the most recent significant high and low 3. Draw the Fibonacci tool: Connect the swing low to swing high (uptrend) or high to low (downtrend) 4. Watch for reactions: Price often finds support/resistance at these levels
:::example In an uptrending stock that moves from $100 to $150, the 61.8% retracement level would be around $119. Traders often look to buy near this level, expecting the uptrend to resume. :::
Fibonacci Trading Strategies
- Retracement entries: Enter trades at key Fibonacci levels in trending markets
- Extension targets: Use Fibonacci extensions to project price targets
- Confluence trading: Combine Fibonacci with other tools for higher probability setups
Advanced Fibonacci Techniques
- Multiple swing analysis: Use Fibonacci from different swing points
- Time-based Fibonacci: Apply ratios to time cycles
- Fibonacci clusters: Areas where multiple Fib levels converge
:::tip Fibonacci levels work best when combined with other chart analysis tools. Look for confluence between Fibonacci levels, support/resistance, and moving averages for the highest probability trades. :::
Tool 5: Price Action Patterns
Price action patterns represent the purest form of market analysis, focusing on how price moves without relying on indicators or oscillators. These patterns reveal the psychology and intentions of market participants.
Essential Candlestick Patterns
Single Candle Patterns:
- Doji: Indecision and potential reversal
- Hammer/Hanging Man: Potential reversal after trending moves
- Shooting Star/Inverted Hammer: Bearish reversal patterns
Multi-Candle Patterns:
- Engulfing Patterns: Strong reversal signals
- Inside Bars: Consolidation and potential breakout setups
- Pin Bars: Rejection of price levels
Chart Patterns for Analysis
Continuation Patterns:
- Flags and pennants
- Triangles (ascending, descending, symmetrical)
- Rectangles and channels
Reversal Patterns:
- Head and shoulders
- Double tops and bottoms
- Rising and falling wedges
:::key-concept Price action patterns work because they represent recurring market psychology. Fear, greed, and uncertainty create predictable patterns that repeat across all timeframes and markets. :::
Trading Price Action Patterns
1. Pattern identification: Learn to spot patterns as they develop 2. Context analysis: Consider the broader market context 3. Entry timing: Wait for confirmation before entering 4. Risk management: Use pattern structure to define stop losses 5. Target setting: Project targets based on pattern measurements
:::example A bullish engulfing pattern forming at a key Fibonacci level in an uptrending market provides a high-probability long entry. The stop loss goes below the engulfing candle's low, while the target might be the next resistance level. :::
Combining Patterns with Market Structure
- Higher highs and higher lows: Uptrend structure
- Lower highs and lower lows: Downtrend structure
- Break of structure: Potential trend change signals
- Market phases: Identify accumulation, markup, distribution, and decline phases
:::warning Not all patterns lead to successful trades. Always consider volume confirmation, broader market context, and risk management when trading price action patterns. :::
Combining Tools for Maximum Effectiveness
While each of these best chart analysis tools is powerful individually, their true strength emerges when used together. Professional traders create comprehensive analysis by combining multiple tools to identify high-probability setups.
Creating a Multi-Tool Analysis Framework
1. Start with market structure: Use support/resistance and price action to understand the bigger picture 2. Add trend analysis: Apply moving averages to confirm trend direction 3. Include volume confirmation: Use volume to validate your analysis 4. Fine-tune with Fibonacci: Apply Fibonacci levels for precise entry and exit points 5. Confirm with patterns: Look for price action patterns that support your thesis
Sample Multi-Tool Setup
:::example Perfect Setup Example:
:::
- Price is in an uptrend (higher highs, higher lows)
- Currently pulling back to the 50 EMA (moving average support)
- The pullback has reached the 61.8% Fibonacci retracement
- Volume is decreasing during the pullback (healthy correction)
- A hammer candlestick forms at the confluence zone
- This creates a high-probability long entry with clear risk management
Tool Hierarchy for Decision Making
1. Primary: Market structure and key support/resistance levels 2. Secondary: Trend direction via moving averages 3. Confirmation: Volume analysis and Fibonacci levels 4. Timing: Price action patterns for precise entries
Common Mistakes to Avoid
- Tool overload: Using too many tools can create analysis paralysis
- Conflicting signals: Learn to prioritize when tools disagree
- Ignoring context: Always consider the broader market environment
- Perfectionism: No setup is 100% certain - manage risk accordingly
:::tip Develop a systematic approach to your analysis. Create a checklist that includes all five tools and only take trades when multiple tools align in your favor. :::
Conclusion
Mastering these five best chart analysis tools will significantly improve your trading performance. Support and resistance lines provide the foundation, moving averages reveal trend direction, volume confirms price movements, Fibonacci retracements offer precise entry levels, and price action patterns time your trades perfectly.
Remember that becoming proficient with these tools takes time and practice. Start by focusing on one tool at a time, gradually building your expertise before combining multiple tools in your analysis. The key to success lies not in using every tool for every trade, but in understanding when and how to apply the right tool for each market situation.
Successful traders develop a systematic approach that incorporates these essential chart analysis tools while maintaining strict risk management principles. By following the strategies and techniques outlined in this guide, you'll be well-equipped to navigate the markets with confidence and precision.
Ready to elevate your trading game? Start practicing with these chart analysis tools on your favorite trading platform. Begin with historical analysis to build your pattern recognition skills, then gradually apply these tools to live market conditions. Remember, consistent practice with proper risk management is the path to long-term trading success.