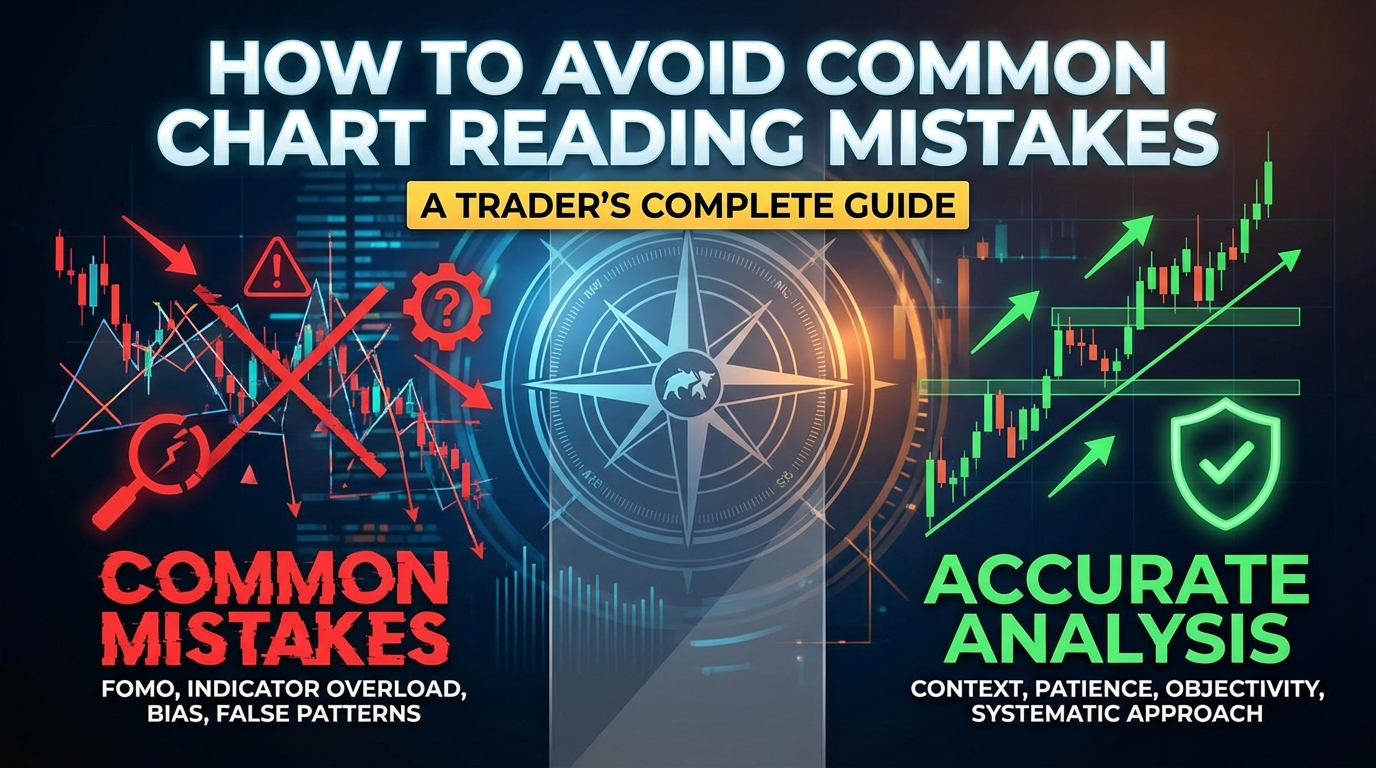
# How to Avoid Common Chart Reading Mistakes: A Trader's Complete Guide
Chart reading forms the backbone of technical analysis, yet even experienced traders fall victim to common interpretation errors that can sabotage their trading success. Understanding how to avoid chart reading mistakes is crucial for developing consistent profitability and making informed trading decisions.
Whether you're analyzing price action patterns, identifying support and resistance levels, or timing your entries and exits, the ability to read charts accurately separates successful traders from those who struggle. This comprehensive guide will help you recognize and eliminate the most frequent chart analysis errors that plague traders across all markets.
Table of Contents
- [The Psychology Behind Chart Reading Errors](#the-psychology-behind-chart-reading-errors)
- [Common Technical Analysis Mistakes](#common-technical-analysis-mistakes)
- [Price Action Misinterpretation Errors](#price-action-misinterpretation-errors)
- [Support and Resistance Level Mistakes](#support-and-resistance-level-mistakes)
- [Time Frame Analysis Errors](#time-frame-analysis-errors)
- [How to Develop Better Chart Reading Skills](#how-to-develop-better-chart-reading-skills)
The Psychology Behind Chart Reading Errors
Before diving into specific chart reading mistakes, it's essential to understand why traders make these errors in the first place. The human mind naturally seeks patterns and confirmation, often leading to biased interpretations of market data.
:::key-concept Confirmation Bias in Trading: Traders often see what they want to see on charts, focusing on information that confirms their existing beliefs while ignoring contradictory signals. :::
Emotional Influences on Chart Analysis
Emotions play a significant role in how we interpret charts. Fear of missing out (FOMO) can cause traders to see bullish signals where none exist, while fear of losses might make them overly cautious and miss legitimate opportunities.
Common Psychological Triggers:
- Overconfidence after a winning streak
- Desperation to recover losses
- Analysis paralysis from information overload
- Recency bias affecting pattern recognition
:::warning Never analyze charts when you're emotionally charged. Take breaks between trades and approach each analysis with a clear, objective mindset. :::
Common Technical Analysis Mistakes
Over-Reliance on Lagging Indicators
One of the most prevalent chart reading mistakes involves placing too much emphasis on lagging indicators while ignoring price action itself. Moving averages, MACD, and RSI provide valuable insights but should never replace fundamental price analysis.
:::example Scenario: A trader sees a bullish MACD crossover and immediately enters a long position, ignoring the fact that price is approaching a major resistance level. The trade fails because the indicator signal conflicted with the actual price structure. :::
Indicator Overload
Cluttering charts with multiple indicators creates confusion and contradictory signals. Many traders fall into the trap of thinking more indicators equal better analysis.
Problems with Indicator Overload:
- Conflicting signals from different indicators
- Delayed decision-making due to analysis paralysis
- Missing clear price action signals
- Reduced chart readability
:::tip Limit yourself to 2-3 complementary indicators maximum. Focus primarily on price action and use indicators to confirm your analysis, not drive it. :::
Misunderstanding Signal Reliability
Not all chart patterns and indicator signals carry equal weight. Context matters significantly in determining the reliability of any technical signal.
Factors Affecting Signal Strength:
- Market structure and trend direction
- Volume confirmation
- Time frame alignment
- Overall market sentiment
- News and fundamental factors
Price Action Misinterpretation Errors
False Pattern Recognition
Traders often force patterns to fit their expectations, seeing head and shoulders, triangles, or flags where none actually exist. This wishful thinking leads to poor trade entries and exits.
:::key-concept Valid Pattern Criteria: Legitimate chart patterns must have clear, well-defined boundaries, adequate volume confirmation, and occur within proper market context. :::
Ignoring Market Context
Analyzing patterns in isolation without considering the broader market structure is a critical chart reading mistake. A bullish pattern in a strong downtrend carries much less weight than the same pattern in an uptrend.
Context Factors to Consider:
- Primary trend direction
- Market phase (accumulation, distribution, trending)
- Volume characteristics
- Recent significant events or news
Candlestick Misinterpretation
While candlestick patterns provide valuable insights, many traders misinterpret their significance or apply them incorrectly.
Common Candlestick Errors:
- Treating single candlesticks as strong reversal signals
- Ignoring the surrounding price action context
- Misidentifying pattern formations
- Overemphasizing small-time frame patterns
:::example Hammer Candlestick Mistake: A trader sees a hammer candlestick at what appears to be support and immediately goes long. However, the "support" level was only tested once before and lacks significance. The trade fails when price continues lower. :::
Support and Resistance Level Mistakes
Drawing Arbitrary Lines
One of the most common chart reading mistakes involves drawing support and resistance lines without proper justification. These levels must be based on actual price action history, not arbitrary placement.
:::warning Support and resistance lines should connect at least two significant highs or lows. Lines drawn through random price points have no predictive value. :::
Treating All Levels Equally
Not all support and resistance levels carry equal weight. Understanding the hierarchy of significance helps prioritize which levels deserve attention.
Level Significance Ranking: 1. Major psychological levels (round numbers, all-time highs/lows) 2. Historical swing highs and lows with multiple touches 3. Moving average levels (especially 200-period) 4. Fibonacci retracement levels 5. Minor intraday levels
Expecting Perfect Reactions
Support and resistance levels are zones, not exact price points. Expecting perfect bounces or breaks often leads to missed opportunities or premature exits.
:::tip Think of support and resistance as zones rather than precise lines. Allow for some price action "noise" around these levels when planning your trades. :::
Time Frame Analysis Errors
Single Time Frame Tunnel Vision
Analyzing only one time frame creates a narrow perspective and increases the likelihood of chart reading mistakes. Multi-time frame analysis provides crucial context for trade decisions.
Proper Time Frame Analysis:
- Higher time frame: Identifies primary trend and major levels
- Trading time frame: Determines entry and exit points
- Lower time frame: Fine-tunes entry timing
Conflicting Time Frame Signals
When different time frames show conflicting signals, many traders either ignore the conflict or choose the signal that matches their bias.
:::key-concept Time Frame Priority: When time frames conflict, give more weight to the higher time frame trend and structure. Trade in the direction of the higher time frame bias. :::
Inadequate Time Frame Selection
Choosing inappropriate time frames for your trading style leads to analysis errors and poor trade timing.
Time Frame Guidelines:
- Scalping: 1-5 minute primary, 15-30 minute context
- Day trading: 5-15 minute primary, hourly context
- Swing trading: Hourly primary, daily context
- Position trading: Daily primary, weekly context
How to Develop Better Chart Reading Skills
Systematic Chart Analysis Approach
Developing a consistent methodology for chart analysis helps eliminate common mistakes and improves accuracy over time.
Step-by-Step Chart Analysis:
1. Start with higher time frames to understand the big picture 2. Identify the primary trend and current market phase 3. Mark significant support and resistance levels 4. Look for high-probability setups that align with the trend 5. Confirm with volume and indicators if needed 6. Plan entry, stop-loss, and target levels
Practice with Historical Data
Regular practice with historical charts helps train your eye to recognize legitimate patterns and avoid false signals.
:::tip Use chart replay features or practice accounts to analyze past market movements. This trains your pattern recognition without the pressure of real money at stake. :::
Keep a Trading Journal
Documenting your chart analysis and trade rationale helps identify recurring mistakes and areas for improvement.
Journal Elements to Track:
- Pre-trade chart analysis and reasoning
- Entry and exit points with screenshots
- What went right or wrong with the analysis
- Lessons learned from each trade
Continuous Education and Review
Staying current with trading education and regularly reviewing your chart reading skills prevents stagnation and helps eliminate persistent errors.
Improvement Activities:
- Study successful traders' chart analysis
- Join trading communities for feedback
- Take advanced technical analysis courses
- Regular self-assessment of past analyses
:::example Weekly Review Process: Every weekend, review your trades from the past week. Identify any chart reading mistakes you made and note patterns in your errors. Create a checklist to avoid these mistakes in future analysis. :::
Building Objective Analysis Skills
Developing the ability to analyze charts objectively, without emotional bias, is crucial for avoiding chart reading mistakes.
Objectivity Techniques:
- Use a systematic checklist for each analysis
- Seek contrary opinions before making trade decisions
- Wait for clear confirmations rather than forcing trades
- Practice meditation or mindfulness to improve focus
Conclusion
Mastering chart reading requires awareness of common pitfalls and consistent practice in avoiding them. The chart reading mistakes outlined in this guide represent the most frequent errors that traders make, but with proper knowledge and discipline, these errors are entirely preventable.
Remember that accurate chart analysis is both an art and a science. While technical rules provide structure, market context and psychological awareness complete the picture. Focus on developing a systematic approach to chart analysis, practice regularly with historical data, and maintain detailed records of your analysis process.
The journey to becoming proficient at chart reading takes time and patience. Don't expect perfection immediately, but commit to continuous improvement and learning from your mistakes. By avoiding these common chart reading mistakes and developing strong analytical habits, you'll significantly improve your trading results over time.
Ready to improve your chart reading skills? Start by reviewing your recent trades and identifying which of these common mistakes you might be making. Then, implement the systematic approach outlined in this guide and begin practicing with historical data to sharpen your analysis skills.