# How to Combine OBV and VSA Strategy for Superior Trade Analysis
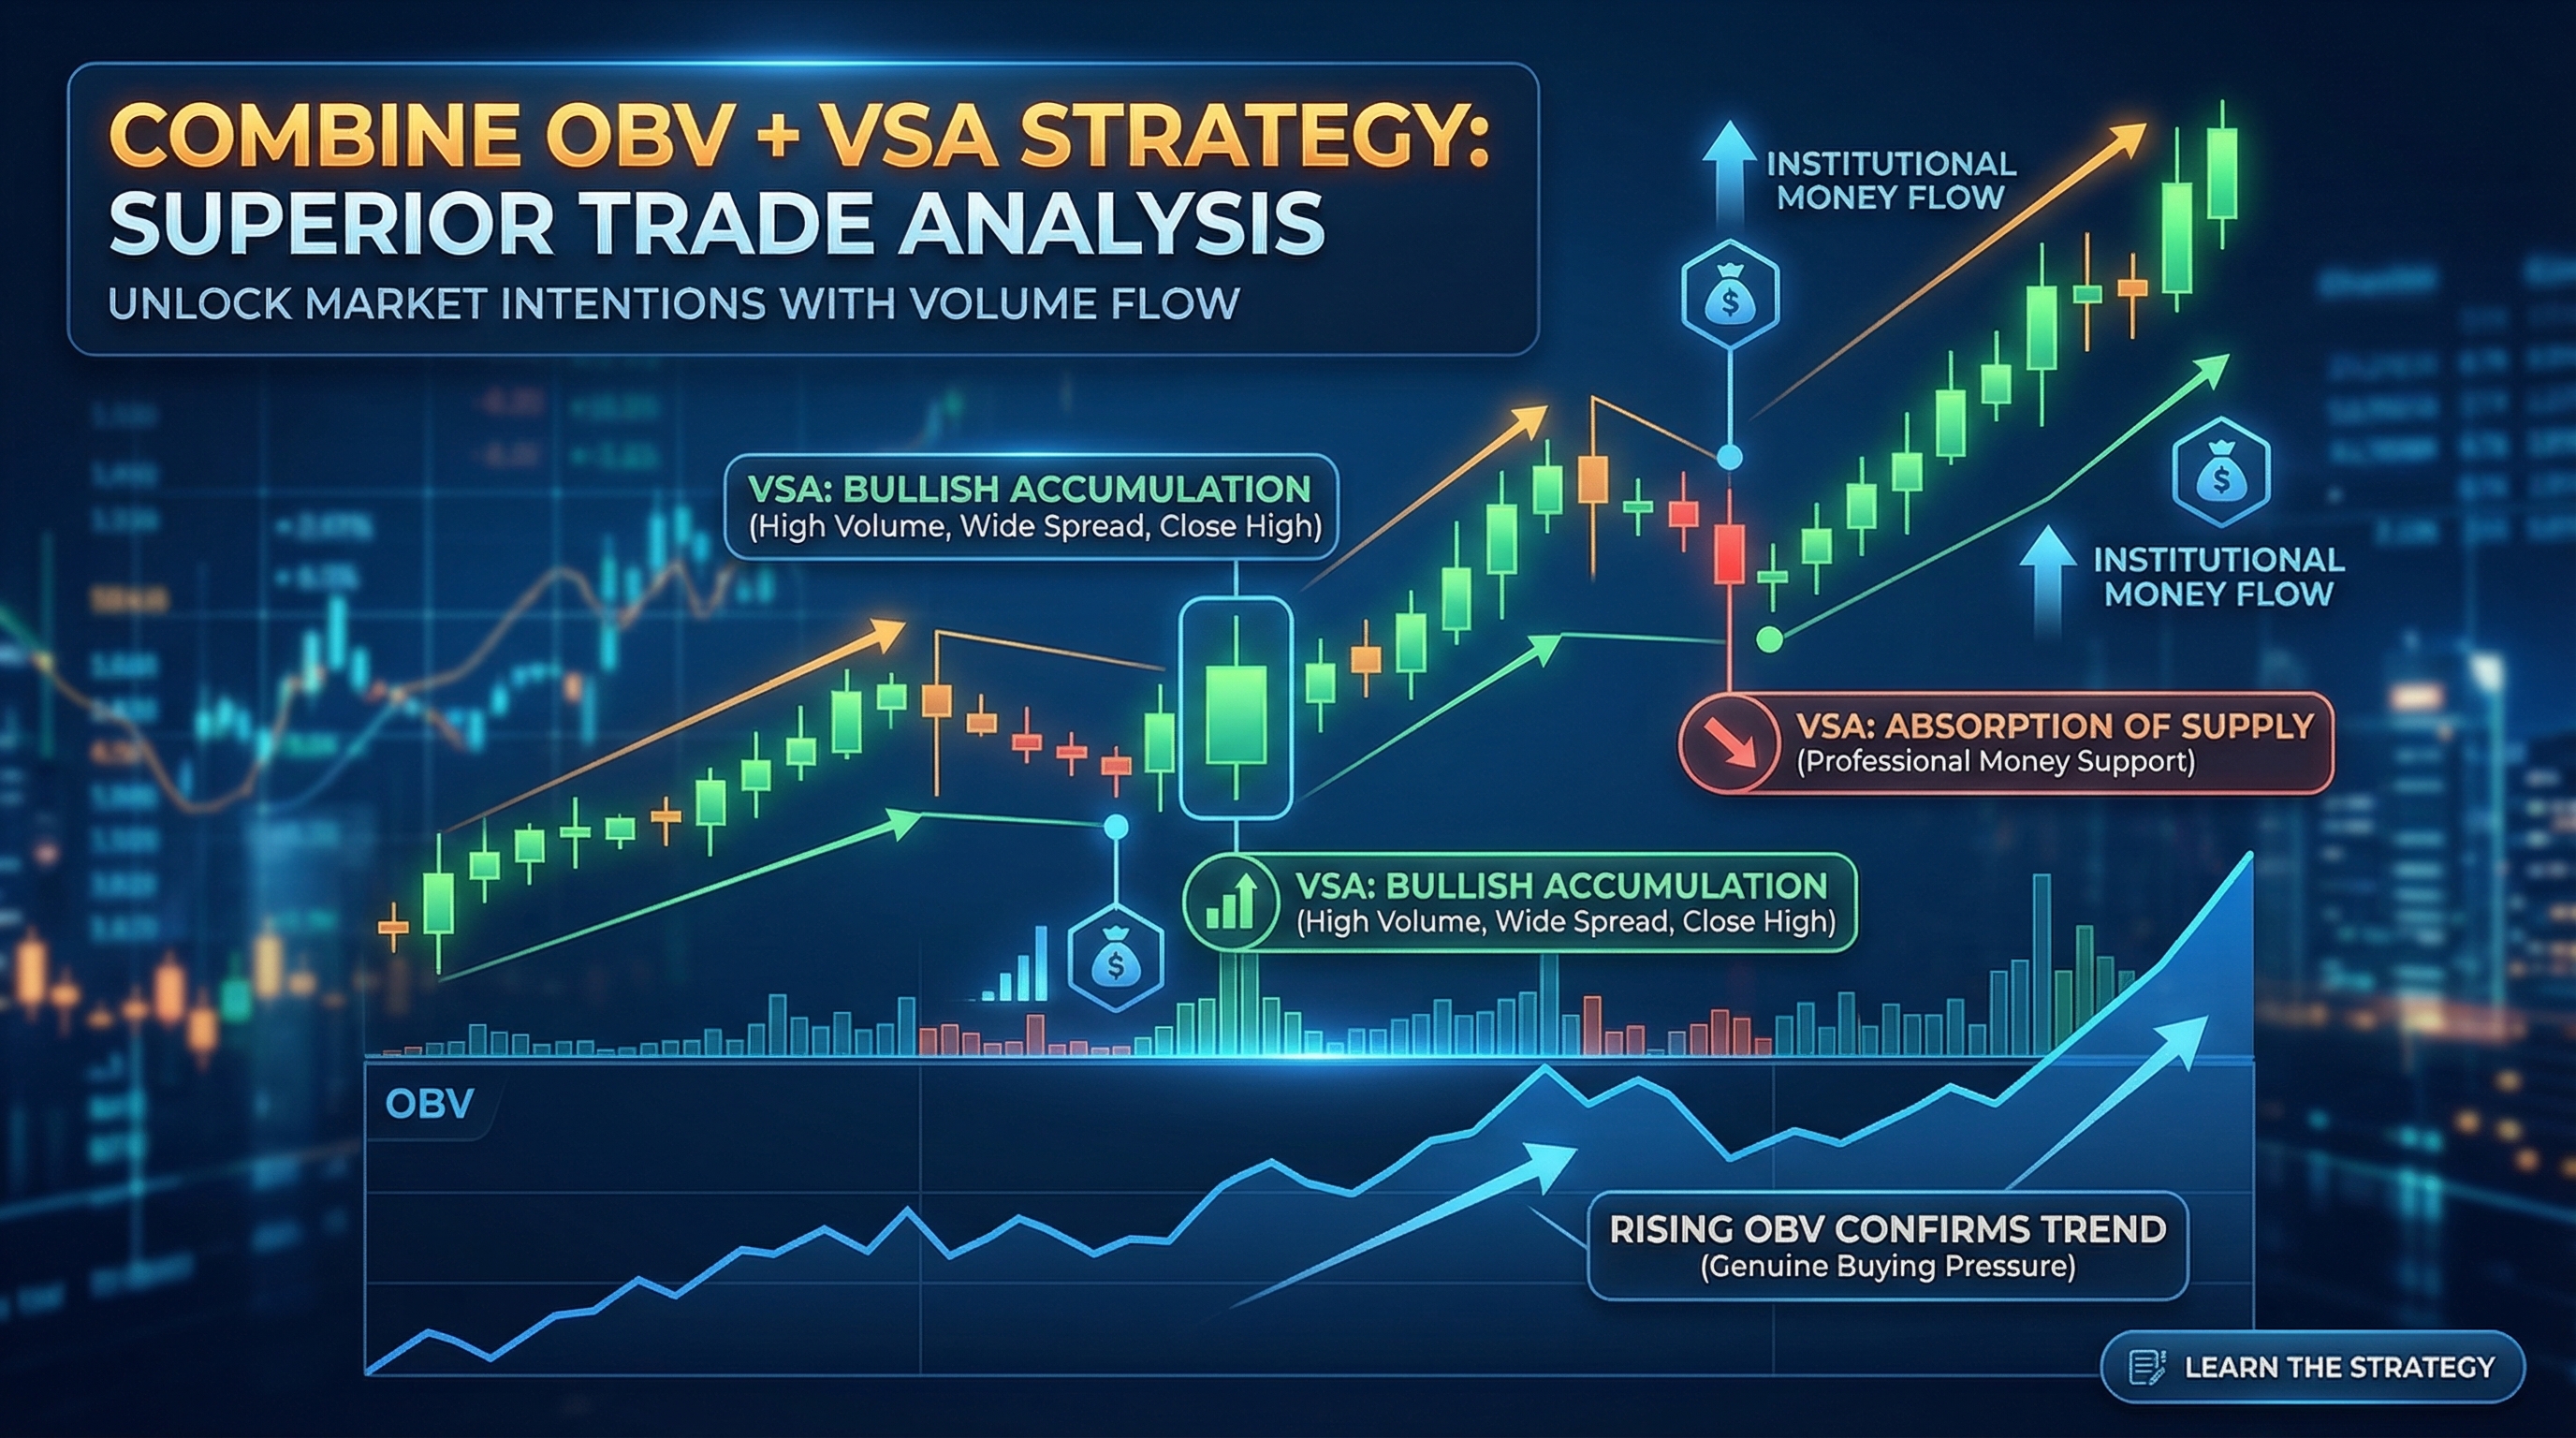
Volume is the heartbeat of the market, revealing the true intentions of institutional traders and smart money. While individual volume indicators provide valuable insights, combining On-Balance Volume (OBV) with Volume Spread Analysis (VSA) creates a powerful analytical framework that can significantly improve your trading accuracy. This obv and vsa strategy helps traders identify when price movements are supported by genuine buying or selling pressure.
The combination of these two volume-based approaches offers a comprehensive view of market dynamics that neither indicator can provide alone. OBV tracks the cumulative volume flow to confirm trends, while VSA analyzes the relationship between volume, spread (range), and closing price to identify professional money activity.
Table of Contents
- [Understanding On-Balance Volume (OBV)](#understanding-on-balance-volume-obv)
- [Core Principles of Volume Spread Analysis](#core-principles-of-volume-spread-analysis)
- [Combining OBV with VSA for Market Confirmation](#combining-obv-with-vsa-for-market-confirmation)
- [Practical Trading Strategies Using OBV and VSA](#practical-trading-strategies-using-obv-and-vsa)
- [Common Pitfalls and How to Avoid Them](#common-pitfalls-and-how-to-avoid-them)
- [Advanced Applications and Case Studies](#advanced-applications-and-case-studies)
Understanding On-Balance Volume (OBV)
On-Balance Volume is a momentum indicator that uses volume flow to predict changes in stock price. Developed by Joe Granville, OBV operates on the principle that volume precedes price movement. When incorporating this into an obv and vsa strategy, understanding OBV's mechanics becomes crucial for successful implementation.
:::key-concept OBV adds volume to a cumulative total when the closing price is higher than the previous close, and subtracts volume when the closing price is lower. If prices close unchanged, OBV remains the same. :::
How OBV Works
The OBV calculation is straightforward:
- If today's close > yesterday's close: OBV = Previous OBV + Today's Volume
- If today's close < yesterday's close: OBV = Previous OBV - Today's Volume
- If today's close = yesterday's close: OBV = Previous OBV
Key OBV Signals
Rising OBV with Rising Prices: This confirms an uptrend and suggests continued bullish momentum. The volume is supporting the price advance, indicating genuine buying interest.
Falling OBV with Falling Prices: This confirms a downtrend and suggests continued bearish momentum. Volume is supporting the price decline, showing real selling pressure.
Divergences: When OBV moves opposite to price, it often signals potential trend reversals. These divergences are particularly powerful when combined with VSA principles.
:::example Consider a stock making new highs while OBV fails to confirm with new highs. This bearish divergence suggests the rally lacks volume support and may be vulnerable to reversal. :::
Core Principles of Volume Spread Analysis
Volume Spread Analysis examines the relationship between three key elements: volume, price spread (high to low range), and where the price closes within that range. VSA helps identify the activities of professional traders and market makers.
The Three Pillars of VSA
1. Volume: The amount of activity in the market 2. Spread: The difference between high and low prices 3. Close: Where the price closes relative to the high and low
:::key-concept VSA operates on the principle that professional money moves markets, and their activities can be detected through careful analysis of volume and price behavior. :::
VSA Bar Types and Their Meanings
High Volume, Wide Spread, Close Near High:
- Indicates strong buying pressure
- Professional money is accumulating
- Bullish signal for continuation or reversal
High Volume, Wide Spread, Close Near Low:
- Shows strong selling pressure
- Professional money is distributing
- Bearish signal for continuation or reversal
High Volume, Narrow Spread:
- Suggests absorption of supply or demand
- Often indicates a pause before continuation
- Look for context to determine direction
Low Volume, Wide Spread:
- Indicates lack of interest
- Often seen in false breakouts
- Generally bearish for the move
:::warning Never analyze VSA bars in isolation. Always consider the context of preceding price action and volume patterns. :::
Combining OBV with VSA for Market Confirmation
The true power of an obv and vsa strategy emerges when these two approaches work together to provide confluence in your analysis. This combination helps filter out false signals and increases the probability of successful trades.
Confluence Signals to Look For
Bullish Confluence:
- OBV making higher highs and higher lows
- VSA showing absorption of selling on down moves
- High volume, wide spread bars closing near highs
- OBV breaking above previous resistance levels
Bearish Confluence:
- OBV making lower highs and lower lows
- VSA showing distribution on up moves
- High volume, wide spread bars closing near lows
- OBV breaking below previous support levels
Divergence Analysis Using Both Methods
Divergences become more reliable when confirmed by both OBV and VSA:
1. Hidden Bullish Divergence: Price makes higher lows while OBV makes lower lows, combined with VSA showing absorption of selling pressure 2. Regular Bearish Divergence: Price makes higher highs while OBV makes lower highs, combined with VSA showing signs of distribution
:::example A stock makes a new high, but OBV fails to confirm. Simultaneously, VSA shows high volume with a wide spread but closes in the lower half of the range. This dual confirmation suggests professional selling and potential reversal. :::
Volume Confirmation Techniques
When using this obv and vsa strategy, always seek volume confirmation:
- Breakouts: OBV should break its trendline in the same direction as price, while VSA should show strong volume with wide spreads
- Reversals: Look for OBV divergences confirmed by VSA showing opposite professional activity
- Continuation Patterns: OBV should maintain its trend direction while VSA shows absorption of counter-trend moves
Practical Trading Strategies Using OBV and VSA
Strategy 1: Trend Continuation Trades
This strategy focuses on entering trades in the direction of the established trend when both OBV and VSA confirm continuation.
Setup Requirements: 1. Clear trend established (uptrend or downtrend) 2. OBV trending in same direction as price 3. Pullback occurs with specific VSA characteristics 4. OBV holds above/below key levels during pullback
Entry Criteria:
- Bullish: OBV maintains upward trajectory, VSA shows absorption of selling during pullback
- Bearish: OBV maintains downward trajectory, VSA shows distribution during bounce
Risk Management:
- Stop loss below/above the VSA absorption/distribution level
- Position size based on distance to stop loss
- Target previous swing high/low or OBV resistance/support
:::tip Use multiple timeframes to confirm your obv and vsa strategy signals. What appears as absorption on a 1-hour chart should align with OBV trends on daily charts. :::
Strategy 2: Reversal Trading
This approach identifies potential trend reversals using divergences between price, OBV, and VSA patterns.
Reversal Setup Process: 1. Identify potential reversal zone (support/resistance, Fibonacci levels) 2. Look for OBV divergence with price 3. Confirm with VSA showing opposite professional activity 4. Wait for price confirmation signal
Entry Timing:
- Enter when price breaks structure in the reversal direction
- Ensure OBV confirms the break
- VSA should show follow-through volume
Strategy 3: Breakout Validation
Use both indicators to validate genuine breakouts and avoid false breaks.
Validation Checklist:
- [ ] OBV breaks its trendline before or with price breakout
- [ ] VSA shows high volume, wide spread, close in direction of break
- [ ] No immediate signs of absorption in breakout direction
- [ ] OBV maintains momentum after breakout
:::warning False breakouts often show high volume but narrow spreads in VSA, while OBV fails to confirm the move. These are warning signs to avoid the trade. :::
Common Pitfalls and How to Avoid Them
Over-Reliance on Single Timeframes
Many traders make the mistake of analyzing their obv and vsa strategy on only one timeframe. This can lead to conflicting signals and poor trade timing.
Solution: Always check higher timeframes for context:
- If trading on 1-hour charts, check daily OBV trends
- Ensure VSA patterns align across timeframes
- Use lower timeframes for precise entry timing only
Ignoring Market Context
Analyzing volume indicators without considering overall market conditions reduces effectiveness.
Best Practices:
- Consider major market events and news
- Understand sector rotation and market cycles
- Adjust position sizes based on market volatility
Misinterpreting Volume Spikes
Not all volume spikes are significant. Context matters tremendously in VSA analysis.
Guidelines:
- Compare volume to recent average (20-50 period)
- Consider time of day and day of week effects
- Look for sustained volume patterns, not isolated spikes
Forcing Trades
The temptation to force trades when signals are unclear is common but dangerous.
:::tip The best obv and vsa strategy traders wait for clear confluence between both indicators before entering trades. Patience is crucial for long-term success. :::
Prevention Methods:
- Maintain a trading journal with setup criteria
- Set minimum confidence levels for trade entry
- Practice on demo accounts until proficient
Advanced Applications and Case Studies
Multi-Asset Correlation Analysis
Advanced traders use OBV and VSA across related assets to confirm market moves:
- Currency Pairs: Analyze OBV on EUR/USD while checking USD index VSA patterns
- Sector Analysis: Compare individual stock OBV with sector ETF VSA
- Commodity Relationships: Gold OBV with dollar index VSA analysis
Integration with Other Technical Tools
While powerful alone, the obv and vsa strategy becomes even more effective when combined with:
Price Action Concepts:
- Support and resistance levels
- Chart patterns and formations
- Candlestick patterns
Market Structure Analysis:
- Higher highs and higher lows
- Break of structure signals
- Liquidity zones
:::example A trader identifies a double top formation. OBV shows bearish divergence at the second peak, while VSA reveals high volume with narrow spreads, indicating absorption of buying pressure. This triple confirmation provides high-confidence short entry. :::
Algorithmic Implementation
For systematic traders, OBV and VSA can be coded into algorithms:
Key Programming Elements:
- OBV calculation and trend identification
- VSA pattern recognition algorithms
- Confluence detection systems
- Risk management protocols
Backtesting Considerations:
- Account for varying market conditions
- Include transaction costs and slippage
- Test across multiple asset classes
- Validate with out-of-sample data
Real-Time Application
Implementing this strategy in live markets requires:
Preparation Phase:
- Pre-market analysis of key levels
- OBV trend identification on higher timeframes
- VSA context from previous session
Execution Phase:
- Real-time monitoring of volume patterns
- Quick VSA assessment of significant bars
- OBV confirmation of price moves
Post-Trade Analysis:
- Review what VSA patterns actually developed
- Analyze OBV behavior during the trade
- Document lessons learned for improvement
:::key-concept The most successful implementation of an obv and vsa strategy requires consistent practice and continuous learning. Markets evolve, and your understanding of volume patterns must evolve with them. :::
Conclusion
Combining On-Balance Volume with Volume Spread Analysis creates a powerful analytical framework that provides deeper insights into market behavior than either method alone. This obv and vsa strategy helps traders identify genuine institutional activity, validate price movements, and avoid many common trading pitfalls.
The key to success lies in understanding that volume tells the real story behind price movements. OBV provides the cumulative flow picture, while VSA reveals the immediate professional activity. Together, they offer a comprehensive view of market dynamics that can significantly improve your trading accuracy.
Remember that mastering this approach requires patience and practice. Start by analyzing historical charts to understand how OBV and VSA patterns develop in different market conditions. Focus on finding clear confluence between both indicators before risking capital.
The most important aspect is developing the discipline to wait for high-probability setups rather than forcing trades when signals are unclear. Quality over quantity remains the cornerstone of successful trading.
Ready to implement these concepts? Begin by analyzing your favorite trading instruments using both OBV and VSA. Practice identifying confluence signals and paper trade your setups until you develop confidence in reading volume patterns. The combination of these two powerful tools can transform your market analysis and trading results.