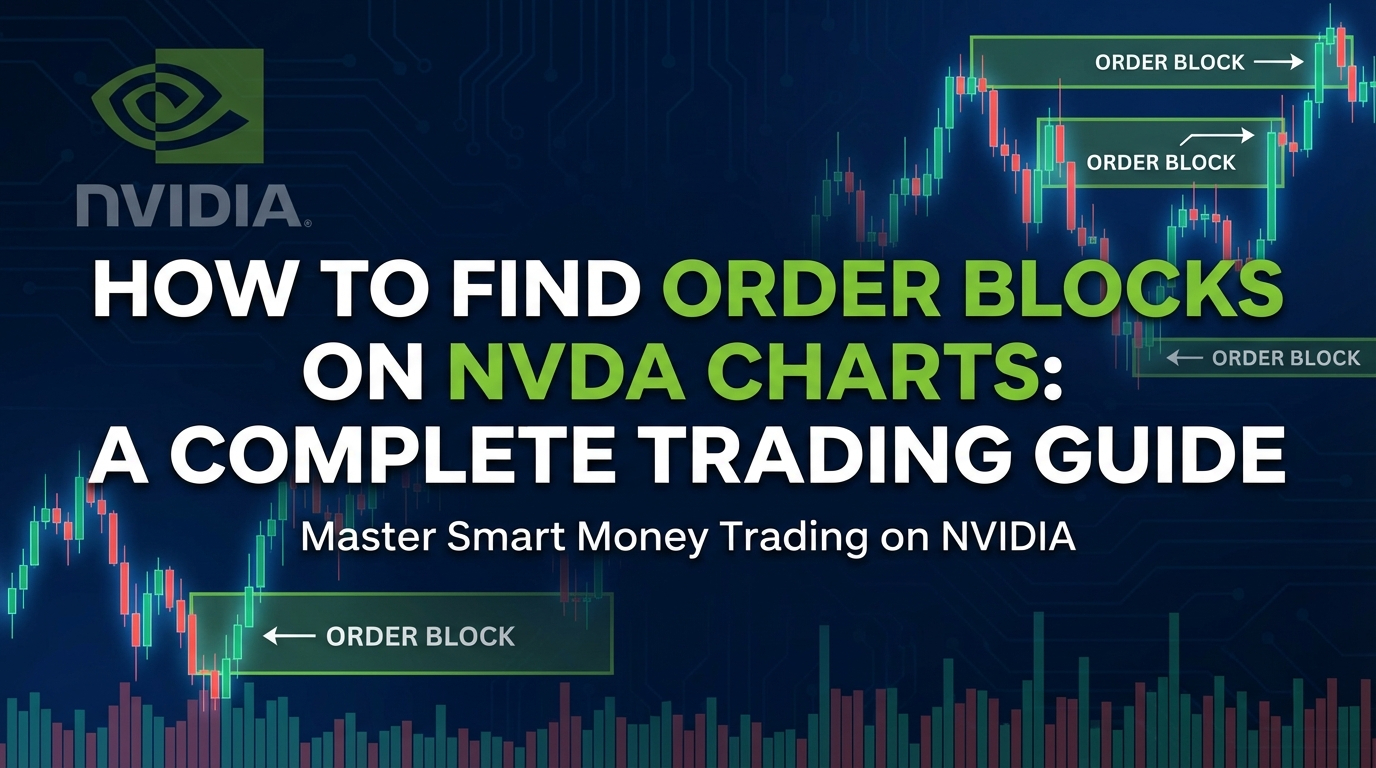
# How to Find Order Blocks on NVDA Charts: A Complete Trading Guide
Order blocks represent one of the most powerful concepts in smart money trading, and when applied to high-volume stocks like NVIDIA (NVDA), they can provide exceptional trading opportunities. Understanding how to find order blocks effectively can transform your approach to reading price action and identifying institutional trading zones.
NVIDIA's status as a leading semiconductor stock makes it particularly suitable for order block analysis. The stock experiences significant institutional activity, creating clear order blocks that retail traders can learn to identify and trade. This guide will teach you exactly how to find order blocks on NVDA charts and use them to improve your trading performance.
Table of Contents
- [Understanding Order Blocks Fundamentals](#understanding-order-blocks-fundamentals)
- [Setting Up Your NVDA Charts for Order Block Analysis](#setting-up-your-nvda-charts-for-order-block-analysis)
- [Step-by-Step Process to Identify Order Blocks](#step-by-step-process-to-identify-order-blocks)
- [Advanced Order Block Trading Strategies](#advanced-order-block-trading-strategies)
- [Common Mistakes When Finding Order Blocks](#common-mistakes-when-finding-order-blocks)
- [Practical Examples on NVDA Charts](#practical-examples-on-nvda-charts)
- [Conclusion](#conclusion)
Understanding Order Blocks Fundamentals
Before diving into how to find order blocks on NVDA specifically, it's crucial to understand what order blocks represent in the market structure. Order blocks are zones where institutional traders have placed significant orders, creating areas of supply or demand that often act as support or resistance levels.
:::key-concept An order block is the last bullish candle before a bearish move (bearish order block) or the last bearish candle before a bullish move (bullish order block). These zones represent where smart money has accumulated or distributed positions. :::
Types of Order Blocks
Bullish Order Blocks:
- Form during downtrends
- Represent areas where institutions accumulated long positions
- Often act as support levels when price returns
- Characterized by strong buying pressure after formation
Bearish Order Blocks:
- Form during uptrends
- Represent areas where institutions distributed short positions
- Often act as resistance levels when price returns
- Characterized by strong selling pressure after formation
:::tip NVDA's high liquidity makes order blocks particularly reliable because they represent genuine institutional activity rather than retail-driven movements. :::
Why NVDA is Ideal for Order Block Trading
NVIDIA presents excellent opportunities for order block analysis due to several factors:
- High institutional ownership: Major funds regularly trade NVDA
- Significant volume: Ensures order blocks represent real smart money activity
- Clear price action: NVDA often shows clean moves that create obvious order blocks
- Multiple timeframe opportunities: From scalping to swing trading
Setting Up Your NVDA Charts for Order Block Analysis
Proper chart setup is essential when learning how to find order blocks effectively. Your chart configuration directly impacts your ability to spot these crucial zones.
Optimal Timeframe Selection
Primary Timeframes for Order Block Analysis:
1. Daily Charts: Best for swing trading and identifying major order blocks 2. 4-Hour Charts: Excellent balance for day trading and short-term swings 3. 1-Hour Charts: Ideal for intraday order block trades 4. 15-Minute Charts: Suitable for scalping order block setups
:::warning Avoid timeframes below 15 minutes for order block analysis as they often contain too much noise and false signals. :::
Essential Chart Settings
Candlestick Configuration:
- Use standard Japanese candlesticks
- Enable body and wick visibility
- Set appropriate contrast for easy pattern recognition
Volume Display:
- Always include volume indicators
- Look for volume spikes at order block formation
- Use volume to confirm order block validity
Clean Chart Approach:
- Remove unnecessary indicators
- Focus on pure price action
- Mark key levels manually for better visualization
Step-by-Step Process to Identify Order Blocks
Learning how to find order blocks systematically ensures consistent identification across different market conditions. Follow this proven methodology:
Step 1: Identify Market Structure
For Bullish Order Blocks: 1. Look for a clear downtrend or bearish market structure 2. Identify swing lows being broken 3. Locate the last bullish candle before a significant bearish move 4. Ensure this candle shows strong buying activity (large body, high volume)
For Bearish Order Blocks: 1. Look for a clear uptrend or bullish market structure 2. Identify swing highs being broken 3. Locate the last bearish candle before a significant bullish move 4. Ensure this candle shows strong selling activity (large body, high volume)
:::example On NVDA's daily chart, if you see a strong uptrend followed by a sharp reversal, the last red candle before the reversal often becomes a bearish order block that price may respect on future retests. :::
Step 2: Validate Order Block Quality
High-Quality Order Block Characteristics:
- Forms at significant support/resistance levels
- Shows substantial volume during formation
- Creates a clean break in market structure
- Demonstrates strong institutional footprint
Volume Confirmation:
- Order block formation should coincide with volume spikes
- Look for above-average volume during the order block candle
- Confirm that volume supports the directional bias
Step 3: Mark and Monitor Order Blocks
Marking Techniques:
- Draw rectangles around the order block zone
- Include the full range from high to low of the candle
- Use different colors for bullish and bearish order blocks
- Add notes about formation context
:::tip Use your charting platform's alert system to notify you when NVDA price approaches marked order blocks. :::
Advanced Order Block Trading Strategies
Once you understand how to find order blocks, implementing advanced strategies can significantly improve your trading results.
The Order Block Retest Strategy
This strategy focuses on trading the retest of established order blocks:
Entry Criteria: 1. Identify a valid order block formation 2. Wait for price to move away and return to the order block 3. Look for rejection signals at the order block level 4. Enter in the direction of the order block bias
Risk Management:
- Place stops beyond the order block zone
- Target previous swing levels for profit taking
- Use 1:2 or better risk-reward ratios
Multi-Timeframe Order Block Analysis
Higher Timeframe Bias:
- Use daily charts to identify major order blocks
- Switch to 4-hour charts for entry refinement
- Execute trades on 1-hour charts for precision
Lower Timeframe Confirmation:
- Look for smaller order blocks within larger ones
- Use 15-minute charts for final entry timing
- Confirm with volume and price action signals
:::key-concept Always ensure your trade direction aligns with higher timeframe order block bias. Trading against major order blocks significantly reduces success probability. :::
Order Block Break and Retest
Sometimes order blocks get broken, creating new trading opportunities:
Bullish Break Strategy: 1. Identify when price breaks above a bearish order block 2. Wait for a retest of the broken level 3. Look for bullish rejection on the retest 4. Enter long positions with stops below the retest low
Bearish Break Strategy: 1. Identify when price breaks below a bullish order block 2. Wait for a retest of the broken level 3. Look for bearish rejection on the retest 4. Enter short positions with stops above the retest high
Common Mistakes When Finding Order Blocks
Avoiding these frequent errors will improve your order block identification accuracy:
Mistake 1: Ignoring Market Context
Problem: Marking every candle as an order block without considering market structure
Solution:
- Only mark order blocks that align with clear structure breaks
- Consider the broader market trend
- Ensure institutional logic supports the order block
Mistake 2: Using Too Many Timeframes
Problem: Overcomplicating analysis with excessive timeframe switching
Solution:
- Stick to 2-3 primary timeframes
- Maintain consistency in your analysis approach
- Focus on quality over quantity
Mistake 3: Neglecting Volume Analysis
Problem: Identifying order blocks without volume confirmation
Solution:
- Always check volume during order block formation
- Look for above-average volume spikes
- Use volume to validate institutional activity
:::warning Never trade order blocks formed on low volume, as they likely represent retail activity rather than institutional positioning. :::
Mistake 4: Poor Risk Management
Problem: Not properly defining stop losses and profit targets
Solution:
- Always place stops beyond order block zones
- Use logical profit targets based on market structure
- Maintain consistent risk-reward ratios
Practical Examples on NVDA Charts
Example 1: Daily Chart Bullish Order Block
Consider a scenario where NVDA has been in a downtrend, breaking multiple support levels. You notice a strong bullish candle (order block formation) followed by a sharp decline that breaks market structure. This bullish candle becomes your order block.
Key Characteristics:
- High volume during formation
- Clear market structure break
- Strong institutional buying visible
Trading Approach:
- Wait for price to return to the order block zone
- Look for bullish rejection signals
- Enter long with stops below the order block
- Target previous resistance levels
Example 2: 4-Hour Chart Bearish Order Block
Imagine NVDA rallying strongly, breaking resistance levels. You identify a bearish candle followed by continued upward movement that creates a new market structure. This bearish candle represents a bearish order block.
Validation Points:
- Volume spike during formation
- Clean break of market structure
- Institutional distribution evident
Trading Strategy:
- Monitor for price return to order block
- Watch for bearish rejection patterns
- Enter short with stops above order block
- Target support levels below
:::example In both examples, the key is patience. Wait for price to return to your identified order blocks rather than chasing immediate moves. :::
Example 3: Intraday Order Block Trading
For shorter timeframe trading, focus on 1-hour and 15-minute charts:
Setup Process: 1. Identify order blocks on 1-hour NVDA charts 2. Wait for price to approach these zones 3. Switch to 15-minute charts for entry timing 4. Look for confluence with other technical factors 5. Execute trades with tight risk management
Success Factors:
- Quick execution capability
- Strict adherence to risk rules
- Focus on high-probability setups only
Conclusion
Mastering how to find order blocks on NVDA charts requires practice, patience, and a systematic approach. By understanding the fundamental concepts, setting up your charts properly, and following the step-by-step identification process, you can begin recognizing these powerful trading zones consistently.
Remember that order blocks represent institutional activity zones where smart money has positioned itself. When price returns to these levels, it often provides excellent trading opportunities with favorable risk-reward ratios. The key is combining proper identification techniques with sound risk management and realistic expectations.
NVIDIA's high liquidity and institutional interest make it an ideal stock for practicing order block analysis. Start by studying historical charts, marking obvious order blocks, and observing how price reacts when returning to these zones. Over time, you'll develop the pattern recognition skills necessary to identify these opportunities in real-time.
Consistency in your approach, combined with proper risk management, will help you leverage order blocks effectively in your NVDA trading strategy. Focus on quality setups over quantity, and always ensure your trades align with the broader market structure and institutional bias.
Ready to start applying these concepts? Begin by analyzing NVDA charts across multiple timeframes, marking clear order blocks, and paper trading your setups before risking real capital. Practice makes perfect in developing this valuable skill set.