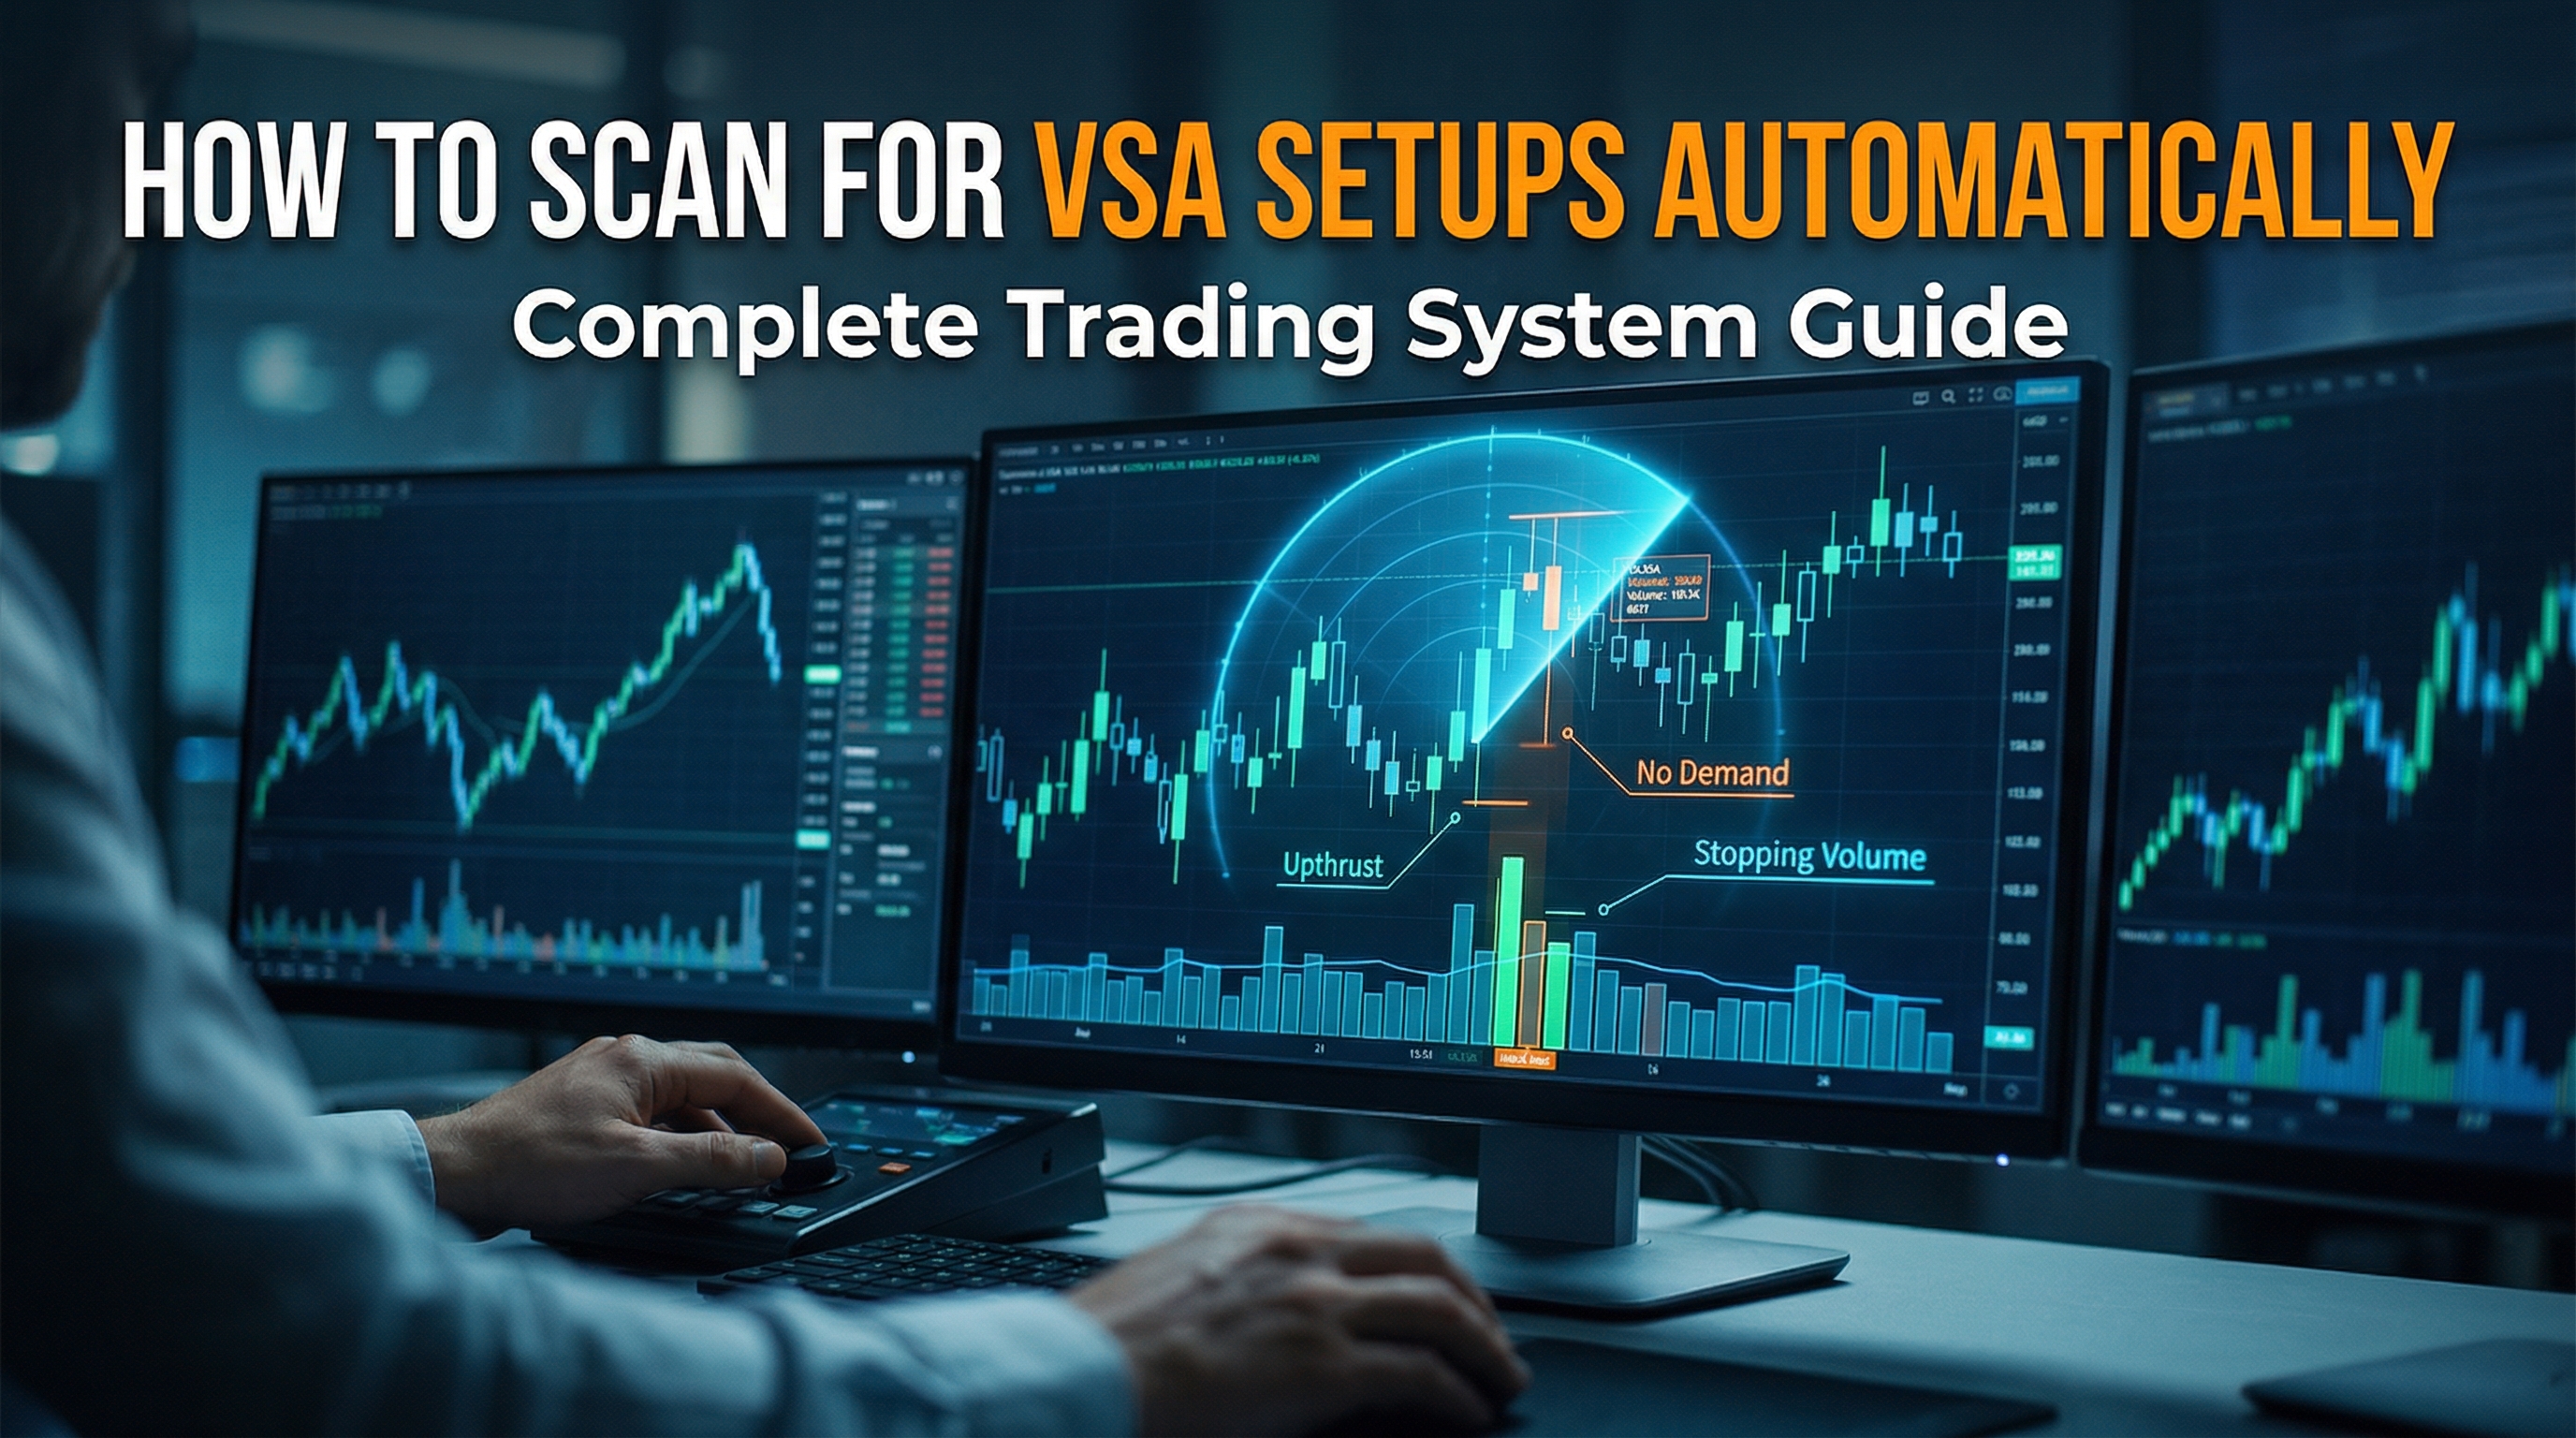
# How to Scan for VSA Setups Automatically: Complete Trading System Guide
Volume Spread Analysis (VSA) is one of the most powerful methodologies for understanding market intentions and identifying high-probability trading opportunities. The ability to scan for VSA setups automatically can transform your trading efficiency and help you catch moves before they happen. In this comprehensive guide, we'll explore everything you need to know about automating your VSA setup identification process.
Table of Contents
- [Understanding VSA Fundamentals](#understanding-vsa-fundamentals)
- [Essential Components for VSA Scanning](#essential-components-for-vsa-scanning)
- [Setting Up Automated VSA Scanners](#setting-up-automated-vsa-scanners)
- [Key VSA Patterns to Scan For](#key-vsa-patterns-to-scan-for)
- [Advanced Scanning Techniques](#advanced-scanning-techniques)
- [Optimizing Your VSA Scanning System](#optimizing-your-vsa-scanning-system)
- [Conclusion](#conclusion)
Understanding VSA Fundamentals
Before diving into how to scan for VSA setups automatically, it's crucial to understand what makes VSA so effective. Volume Spread Analysis examines the relationship between three key elements: volume, price spread (range), and closing price position within that spread.
:::key-concept VSA works on the principle that professional money (smart money) leaves footprints in the market through volume and price action. By analyzing these footprints, retail traders can follow the smart money's lead. :::
The core premise of VSA is that volume drives price. When you see unusual volume combined with specific price behavior, it often indicates that informed traders are taking positions. This creates opportunities for those who can recognize these patterns.
The Three Pillars of VSA Analysis
Volume: The fuel that drives price movement. High volume suggests strong interest from professional traders, while low volume often indicates lack of serious participation.
Spread: The difference between high and low prices for a given period. Wide spreads on high volume suggest strong moves, while narrow spreads on high volume often indicate accumulation or distribution.
Close Position: Where the price closes within the bar's range provides insight into who was in control - buyers or sellers.
:::example Imagine a stock that typically trades 1 million shares daily suddenly sees 5 million shares traded with a narrow price range and closes near the high. This suggests accumulation by smart money, creating a potential buying opportunity. :::
Essential Components for VSA Scanning
To effectively scan for VSA setups automatically, you need the right combination of tools, data, and criteria. Let's break down each component:
Data Requirements
Volume Data: Accurate, real-time volume information is non-negotiable. Many free data feeds provide delayed or inaccurate volume data, which can lead to false signals.
Price Data: You need reliable OHLC (Open, High, Low, Close) data with proper historical depth for context.
Market Breadth Data: For stocks, having access to sector and market-wide volume data helps confirm broader market conditions.
Technical Platform Requirements
Scanning Capabilities: Your platform must allow custom scans based on volume, price action, and mathematical relationships between these variables.
Alert Systems: Real-time notifications when setups meet your criteria are essential for timely execution.
Backtesting Features: The ability to test your scanning criteria against historical data helps refine your approach.
:::tip Popular platforms for VSA scanning include TradingView, ThinkOrSwim, MetaTrader, and TradingAnalysis.ai. Each has unique strengths for different market types. :::
Key Metrics to Track
When you scan for VSA setups, focus on these critical metrics:
- Relative Volume: Compare current volume to average volume over specific periods
- Volume Rate of Change: Percentage increase in volume compared to previous periods
- Price-Volume Divergence: Situations where price and volume move in opposite directions
- Spread Analysis: Range size relative to recent average ranges
Setting Up Automated VSA Scanners
Creating effective automated scanners requires careful setup and continuous refinement. Here's a step-by-step approach to building your VSA scanning system:
Step 1: Define Your Universe
Start by determining which instruments you want to scan. This could be:
- All stocks above a certain market cap
- Specific sectors or indices
- Forex pairs with sufficient liquidity
- Cryptocurrency markets
- Commodities and futures
Step 2: Set Volume Criteria
Establish clear volume thresholds that indicate unusual activity:
Relative Volume Ratio: Set minimum thresholds (e.g., current volume must be 150% of 20-day average)
Absolute Volume: Define minimum daily volume requirements to ensure liquidity
Volume Spike Detection: Identify when volume exceeds normal patterns by significant margins
:::example A basic volume criterion might be: "Current bar volume > 2 × 20-period average volume AND total daily volume > 500,000 shares." :::
Step 3: Price Action Parameters
Define the price behavior that accompanies your volume criteria:
Spread Requirements: Set parameters for bar ranges (e.g., current range > 1.5 × 10-period average range)
Close Position Rules: Specify where closes should be within the range (e.g., close in top 25% for bullish setups)
Price Context: Consider recent support/resistance levels and trend direction
Step 4: Combine Criteria for Specific Setups
Create scanning formulas that combine volume and price criteria to identify specific VSA patterns. Here are some examples:
No Demand Pattern:
- Low volume on down bar
- Close near low of range
- Occurs after downtrend
- Suggests selling exhaustion
Upthrust Pattern:
- High volume on up bar
- Close in lower portion of range
- New high or test of resistance
- Suggests distribution
:::warning Always test your scanning criteria on historical data before using them for live trading. What looks good in theory may not work in practice. :::
Key VSA Patterns to Scan For
When you scan for VSA setups automatically, focus on these high-probability patterns that have proven effective across different markets:
Accumulation Patterns
Stopping Volume: Occurs at support levels with very high volume and narrow spread, suggesting major buying interest.
Scanning Criteria:
- Volume > 300% of average
- Range < 50% of average range
- Close in upper 50% of range
- At or near support level
No Demand: Low volume on down bars after decline, indicating selling exhaustion.
Scanning Criteria:
- Volume < 50% of average
- Red/down bar
- Close near low of range
- Following downtrend
Distribution Patterns
Upthrust: High volume on up bar that closes poorly, suggesting smart money selling.
Scanning Criteria:
- Volume > 200% of average
- New high or near resistance
- Close in lower 40% of range
- Wide spread
No Supply: Low volume on up bars at resistance, suggesting lack of selling pressure.
Scanning Criteria:
- Volume < 60% of average
- Green/up bar
- At resistance level
- Close near high of range
:::example A classic Stopping Volume pattern might show: 500% above average volume, price range 30% smaller than usual, closing in the top 25% of the bar, occurring exactly at a major support level. This creates a high-probability buying opportunity. :::
Confirmation Patterns
Test: Return to previous support/resistance with low volume, confirming the level holds.
Spring: False break below support with immediate recovery on increased volume.
Backup: Pullback to breakout level with low volume, confirming the move.
Advanced Scanning Techniques
Once you've mastered basic VSA scanning, these advanced techniques can significantly improve your results:
Multi-Timeframe Analysis
Scan for VSA setups across multiple timeframes simultaneously. A pattern might appear on the daily chart while being confirmed by hourly chart action.
Implementation Steps: 1. Identify primary pattern on main timeframe 2. Check for confirmation on higher timeframe 3. Look for precise entry on lower timeframe 4. Ensure all timeframes align for strongest signals
Sector and Market Context
Incorporate broader market analysis into your scanning:
Market Health Check: Only trade bullish setups when market indices show strength
Sector Rotation: Identify which sectors are receiving the most professional attention
Relative Strength: Compare individual stocks to their sector performance
:::tip The strongest VSA setups often occur when individual security patterns align with broader market or sector trends. :::
Volume Profile Integration
Combine traditional VSA with volume profile analysis:
High Volume Nodes: Look for VSA patterns at significant volume levels
Volume Gaps: Identify areas with low volume that price might move through quickly
Point of Control: Use volume-weighted average price levels as context for VSA signals
Machine Learning Enhancement
Modern traders can use AI to improve their VSA scanning:
Pattern Recognition: Train algorithms to identify complex VSA patterns
Success Rate Optimization: Use historical data to refine scanning criteria
Market Regime Detection: Adjust scanning parameters based on current market conditions
Optimizing Your VSA Scanning System
To maximize the effectiveness of your VSA scanning approach, continuous optimization is essential:
Performance Tracking
Maintain detailed records of:
- Hit rate of different scanning criteria
- Average profit/loss per setup type
- Time decay of signal effectiveness
- Market condition impact on performance
Regular Calibration
Markets evolve, and your scanning criteria should too:
Monthly Reviews: Analyze which patterns performed best and worst
Criteria Adjustment: Modify volume and price thresholds based on recent market behavior
False Signal Analysis: Study why certain scans produced losing trades
:::warning Over-optimization can lead to curve-fitting. Always balance historical performance with logical market principles. :::
Risk Management Integration
Your scanning system should incorporate risk management from the start:
Position Sizing: Calculate appropriate position sizes based on setup quality and risk
Stop Loss Levels: Identify logical stop levels for each pattern type
Risk-Reward Ratios: Only include setups that offer favorable risk-reward profiles
Technology Considerations
Processing Speed: Ensure your scanning system can handle large datasets quickly
Reliability: Build redundancy into critical scanning operations
Scalability: Design systems that can grow with your trading operation
Data Backup: Maintain historical scan results for analysis and improvement
:::key-concept The most successful VSA scanning systems combine technical accuracy with practical trading considerations like execution speed and risk management. :::
Conclusion
Learning how to scan for VSA setups automatically represents a significant step forward in your trading development. By systematically identifying high-probability opportunities based on volume spread analysis principles, you can gain a substantial edge in the markets.
The key to success lies in understanding that VSA scanning is both an art and a science. While the technical setup of scanning criteria requires precision and attention to detail, the interpretation and execution of signals demands experience and market intuition.
Remember that even the best scanning system is only as good as the trader using it. Combine your automated VSA scanning with solid risk management, proper position sizing, and continuous learning. Start with basic patterns and gradually incorporate more sophisticated techniques as your understanding deepens.
The markets are constantly evolving, and your scanning approach should evolve with them. Regular analysis of your results, combined with adjustments to your criteria, will help maintain and improve your edge over time.
Ready to implement VSA scanning in your trading? Start by identifying 2-3 basic patterns that resonate with your trading style, set up simple scanning criteria, and begin paper trading the signals. As you gain confidence and experience, gradually expand your scanning universe and incorporate more advanced techniques. The journey to mastering VSA scanning takes time, but the potential rewards make it well worth the effort.