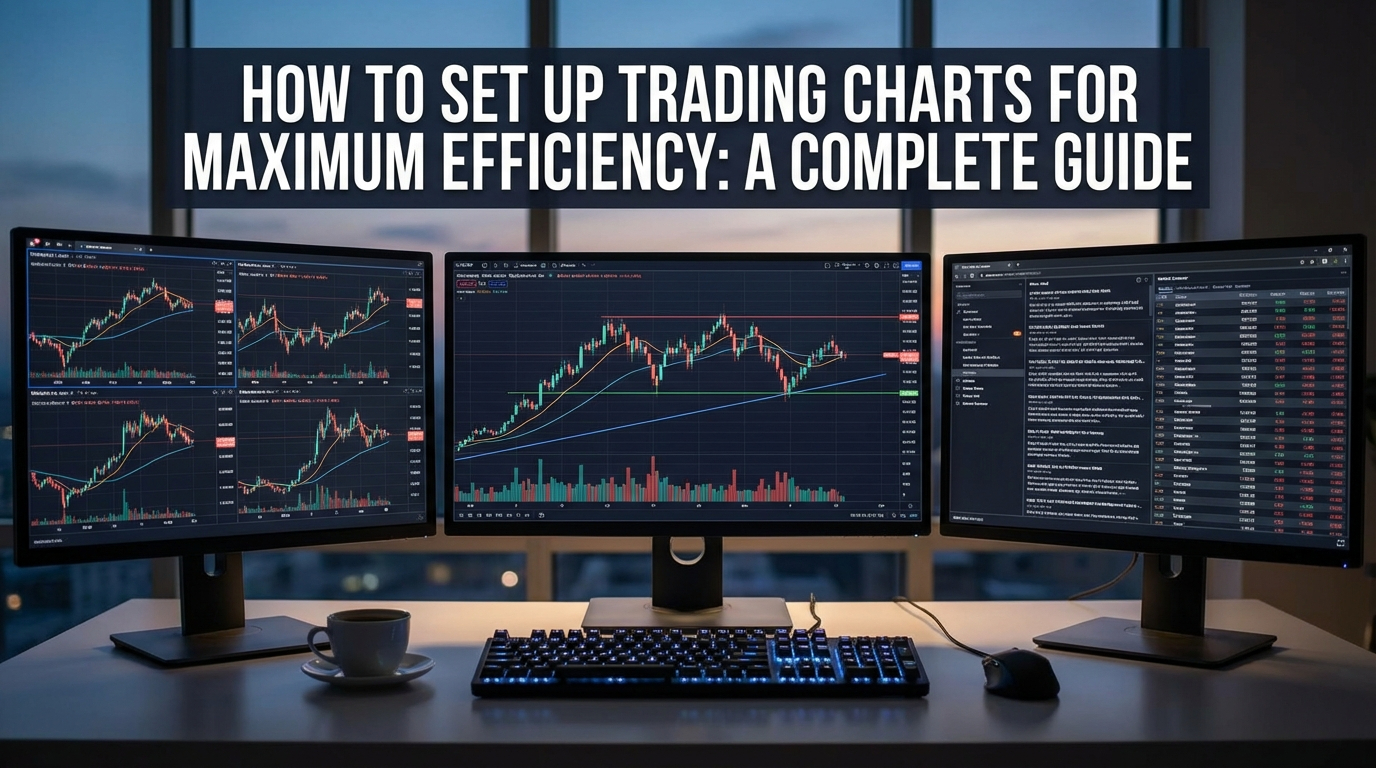
# How to Set Up Trading Charts for Maximum Efficiency: A Complete Guide
Effective chart setup is the foundation of successful trading analysis. A well-configured trading workspace can mean the difference between catching profitable opportunities and missing them entirely. Your chart configuration directly impacts your ability to analyze market conditions, identify trading signals, and execute trades with confidence.
Many traders underestimate the importance of proper chart organization, leading to cluttered screens, overlooked signals, and reduced trading performance. By learning how to set up trading charts systematically, you'll create a professional workspace that supports consistent analysis and decision-making.
Table of Contents
- [Essential Chart Components](#essential-chart-components)
- [Optimal Time Frame Configuration](#optimal-time-frame-configuration)
- [Indicator Selection and Placement](#indicator-selection-and-placement)
- [Screen Layout and Workspace Organization](#screen-layout-and-workspace-organization)
- [Advanced Chart Customization](#advanced-chart-customization)
- [Maintaining Chart Efficiency](#maintaining-chart-efficiency)
- [Conclusion](#conclusion)
Essential Chart Components
When learning how to set up trading charts effectively, start with the fundamental components that every chart should include. These core elements form the backbone of your technical analysis.
Price Action Display
Your primary focus should be on clean price action visualization. Choose between candlestick, bar, or line charts based on your trading style:
- Candlestick charts: Ideal for most traders as they display open, high, low, and close prices clearly
- Bar charts: Provide similar information with less visual clutter
- Line charts: Best for identifying overall trends and key levels
:::key-concept Price action should always be the primary focus of your charts. All other elements should support, not overshadow, the price movement analysis. :::
Volume Integration
Volume is crucial for confirming price movements and identifying potential reversals. Position volume indicators where they're easily visible but don't interfere with price analysis:
- Place volume bars at the bottom of your chart
- Use volume-weighted average price (VWAP) for intraday trading
- Consider volume profile for identifying key support and resistance levels
Support and Resistance Levels
Mark significant support and resistance levels using horizontal lines or zones. These levels should be:
- Clearly visible across all timeframes
- Updated regularly as market structure changes
- Color-coded for easy identification (e.g., support in green, resistance in red)
:::example A day trader might mark the previous day's high and low, overnight levels, and key pivot points, while a swing trader focuses on weekly and monthly levels. :::
Optimal Time Frame Configuration
Understanding how to set up trading charts across multiple timeframes is essential for comprehensive market analysis. The key is creating a logical hierarchy that supports your trading strategy.
Multiple Timeframe Analysis
Set up your charts using a top-down approach:
1. Higher timeframe (trend identification): 4-hour or daily charts for overall market direction 2. Intermediate timeframe (entry timing): 1-hour charts for refining entry points 3. Lower timeframe (execution): 15-minute or 5-minute charts for precise timing
Time Frame Ratios
Maintain logical ratios between timeframes to ensure coherent analysis:
- Use 4:1 or 6:1 ratios (e.g., daily, 4-hour, 1-hour)
- Avoid excessive timeframe compression that creates noise
- Ensure your trading timeframe aligns with your strategy duration
:::tip Keep your primary trading timeframe in the center of your screen, with higher and lower timeframes positioned for quick reference. :::
Synchronization Across Timeframes
Ensure all charts display the same instrument and maintain consistent:
- Color schemes and visual elements
- Key level markings
- Indicator settings and parameters
Indicator Selection and Placement
When configuring how to set up trading charts with indicators, less is often more. Focus on a select few indicators that complement your trading strategy rather than overwhelming your charts with multiple oscillators and overlays.
Core Indicator Categories
Organize indicators into functional categories:
Trend Indicators:
- Moving averages (20, 50, 200 periods)
- Trend lines and channels
- Ichimoku Cloud for comprehensive trend analysis
Momentum Indicators:
- RSI (14-period) for overbought/oversold conditions
- MACD for trend changes and momentum shifts
- Stochastic oscillator for entry timing
Volume Indicators:
- Volume bars for confirmation
- On-balance volume (OBV) for trend strength
- Volume-weighted average price (VWAP)
:::warning Avoid indicator redundancy. Using multiple indicators that provide similar signals can lead to analysis paralysis and conflicting information. :::
Indicator Placement Strategy
Position indicators strategically to maximize chart real estate:
- Price overlays: Moving averages, Bollinger Bands directly on price chart
- Lower panels: Oscillators like RSI, MACD in separate panes
- Side panels: Volume profile or market depth information
Customization for Clarity
Adjust indicator appearance for optimal visibility:
- Use contrasting colors that stand out against your background
- Adjust line thickness for important indicators
- Set appropriate scaling to prevent distortion
:::example A swing trader might use daily charts with 20/50/200 moving averages, weekly RSI, and volume confirmation, while keeping the price action clean and uncluttered. :::
Screen Layout and Workspace Organization
Efficient screen organization is crucial when learning how to set up trading charts for professional analysis. Your layout should minimize eye movement while maximizing information accessibility.
Multi-Monitor Configuration
For serious traders, multiple monitors provide significant advantages:
Primary Monitor:
- Main trading charts (multiple timeframes)
- Order entry platform
- Key market levels and annotations
Secondary Monitor:
- Market scanner and watchlists
- News feeds and economic calendar
- Portfolio and position management tools
Optional Third Monitor:
- Additional timeframes or instruments
- Research and analysis tools
- Communication platforms
Single Monitor Optimization
If using one monitor, maximize efficiency through:
- Tabbed chart layouts for quick switching
- Split-screen configurations for multiple timeframes
- Collapsible panels for temporary tool access
Template Creation
Develop standardized templates for different trading scenarios:
Day Trading Template:
- 5-minute, 15-minute, and 1-hour charts
- Intraday levels and pivot points
- Volume and momentum indicators
Swing Trading Template:
- Daily and 4-hour primary charts
- Weekly chart for context
- Trend and support/resistance analysis
:::tip Save multiple templates for different market conditions (trending, ranging, high volatility) to quickly adapt your analysis approach. :::
Advanced Chart Customization
Once you've mastered basic chart setup, advanced customization techniques can further enhance your trading efficiency and analysis capabilities.
Color Scheme Optimization
Choose colors that reduce eye strain and improve pattern recognition:
- Dark backgrounds: Reduce eye fatigue during long trading sessions
- High contrast: Ensure clear visibility of all elements
- Consistent coding: Use the same colors across all timeframes and instruments
Advanced Drawing Tools
Utilize sophisticated drawing tools for comprehensive analysis:
- Fibonacci retracements: For identifying potential reversal levels
- Trend channels: For containing price action and identifying breakouts
- Elliott Wave patterns: For long-term trend analysis
- Harmonic patterns: For precise reversal trading opportunities
Alert Configuration
Set up intelligent alerts to monitor opportunities without constant screen watching:
- Price level breaks (support/resistance)
- Indicator signal confirmations
- Volume spike notifications
- Pattern completion alerts
:::key-concept Advanced customization should enhance, not complicate, your analysis process. Every element should serve a specific purpose in your trading strategy. :::
Market-Specific Adaptations
Customize chart setups for different markets:
Forex Charts:
- Include relevant session markers (London, New York, Tokyo)
- Display correlation analysis with related pairs
- Add central bank meeting schedules
Stock Charts:
- Include earnings dates and corporate events
- Add sector performance comparisons
- Display relevant fundamental ratios
Cryptocurrency Charts:
- Monitor 24/7 trading patterns
- Include social sentiment indicators
- Track on-chain analysis metrics
Maintaining Chart Efficiency
Regular maintenance ensures your chart setup remains optimized for changing market conditions and evolving trading strategies.
Regular Review and Updates
Schedule periodic reviews of your chart configuration:
Weekly Reviews:
- Update key support and resistance levels
- Adjust indicator parameters if necessary
- Clean up outdated annotations and drawings
Monthly Reviews:
- Evaluate indicator effectiveness
- Consider template modifications based on performance
- Update market-specific customizations
Performance Monitoring
Track how your chart setup impacts trading performance:
- Monitor decision-making speed and accuracy
- Assess signal clarity and reliability
- Evaluate overall trading efficiency improvements
Adaptation Strategies
Modify your setup based on:
- Changing market volatility
- Evolving trading strategies
- New tool availability
- Performance feedback
:::warning Avoid constantly changing your chart setup. Give any modifications sufficient time to prove their effectiveness before making further adjustments. :::
Backup and Recovery
Protect your customized setup:
- Save template files regularly
- Export custom indicators and scripts
- Document your configuration settings
- Create backup copies of workspace layouts
Conclusion
Mastering how to set up trading charts effectively is a crucial skill that directly impacts your trading success. A well-organized, efficient chart setup provides the foundation for accurate analysis, timely decision-making, and consistent trading performance.
Remember these key principles:
- Start with clean price action as your primary focus
- Use multiple timeframes for comprehensive analysis
- Select indicators that complement rather than complicate your strategy
- Organize your workspace for maximum efficiency
- Regularly review and optimize your setup based on performance
Your chart configuration should evolve with your trading experience and market understanding. Begin with the fundamental components outlined in this guide, then gradually add advanced features as your skills develop.
The time invested in properly configuring your trading charts will pay dividends through improved analysis quality, faster decision-making, and ultimately, better trading results. Start implementing these chart setup techniques today and experience the difference that professional workspace organization can make in your trading journey.