# How to Spot Internal vs External Range Liquidity in Trading: A Complete Guide
Understanding liquidity patterns is crucial for successful trading, yet many traders struggle to distinguish between internal and external range liquidity. This fundamental concept in smart money trading can dramatically improve your entry and exit timing, helping you align with institutional flow and avoid common retail trader traps.
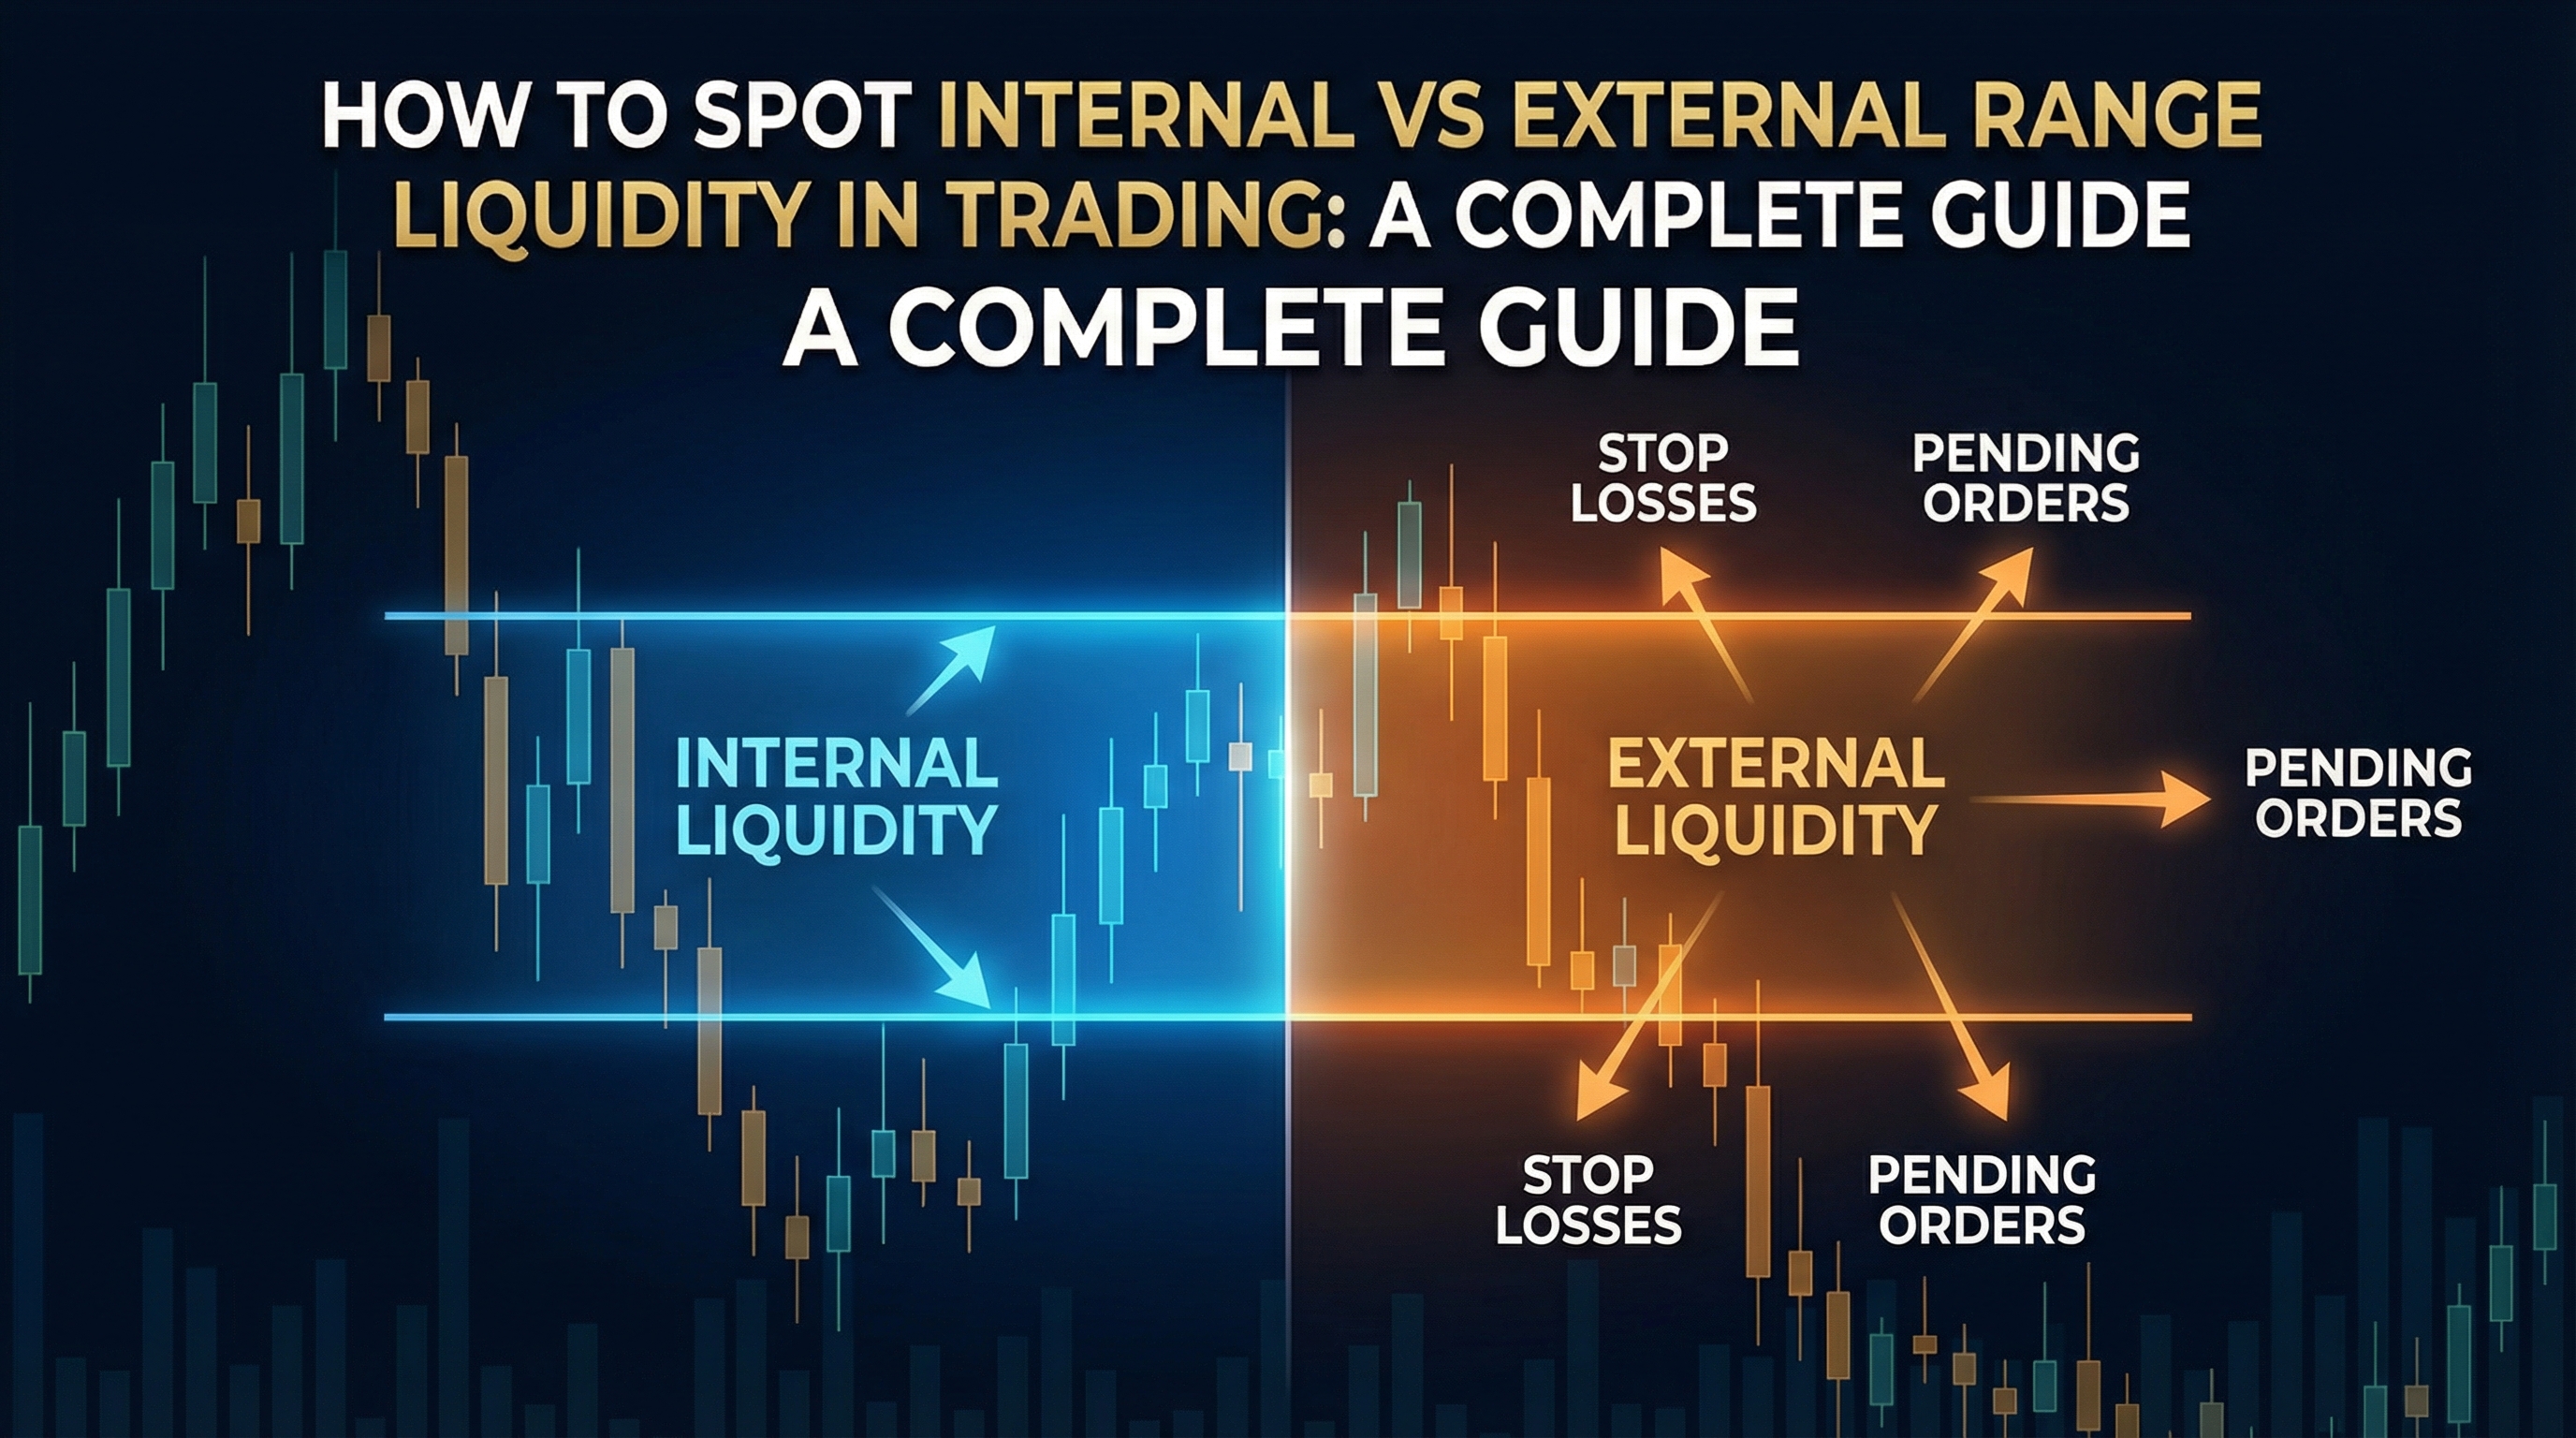
Liquidity refers to areas where stop losses and pending orders cluster, creating pools of potential buying or selling pressure. When you master identifying internal vs external range liquidity, you gain insight into where smart money is likely to move price next, giving you a significant edge in the markets.
Table of Contents
- [Understanding Range Liquidity Basics](#understanding-range-liquidity-basics)
- [Internal Range Liquidity Explained](#internal-range-liquidity-explained)
- [External Range Liquidity Patterns](#external-range-liquidity-patterns)
- [How to Identify Liquidity Zones on Charts](#how-to-identify-liquidity-zones-on-charts)
- [Trading Strategies for Liquidity Patterns](#trading-strategies-for-liquidity-patterns)
- [Common Mistakes and How to Avoid Them](#common-mistakes-and-how-to-avoid-them)
- [Conclusion](#conclusion)
Understanding Range Liquidity Basics
Before diving into internal vs external range liquidity, you need to understand what creates liquidity in the first place. Liquidity forms where traders place their stop losses and pending orders, typically at obvious technical levels.
:::key-concept Liquidity represents unfilled orders that create buying or selling pressure when price reaches these levels. Smart money often targets these areas to fill large positions efficiently. :::
Ranges are consolidation periods where price moves between defined support and resistance levels. During these periods, retail traders often place:
- Buy stops above resistance (expecting breakouts)
- Sell stops below support (protecting long positions)
- Limit orders at support and resistance (range trading)
Institutional traders recognize these patterns and often manipulate price to collect this liquidity before moving in their intended direction.
Types of Liquidity Pools
Resting Liquidity:
- Stop losses from existing positions
- Pending buy/sell orders
- Institutional limit orders
Induced Liquidity:
- Stops triggered by false breakouts
- Panic selling/buying at key levels
- Emotional decision-making zones
Internal Range Liquidity Explained
Internal range liquidity refers to liquidity pools that form within the boundaries of an established trading range. This liquidity typically accumulates at intermediate levels where price has previously shown reaction.
:::example Imagine a range between $100 support and $110 resistance. Internal liquidity might form at $103, $105, and $107 where price previously bounced or stalled. Traders place stops and limits at these "obvious" levels within the range. :::
Characteristics of Internal Liquidity
Formation Patterns:
- Equal highs/lows within the range
- Previous swing points that held multiple times
- Round numbers between range extremes
- Fibonacci retracement levels within the range
Smart Money Behavior: Institutions often target internal liquidity to:
- Accumulate positions gradually
- Test market sentiment
- Create false signals for retail traders
- Build larger positions before major moves
Identifying Internal Liquidity Zones
Look for these key markers when scanning for internal range liquidity:
1. Multiple touches at the same level 2. Clean rejection wicks showing respect for the level 3. Volume spikes at these intermediate levels 4. Time spent consolidating near these areas
:::tip Internal liquidity often gets taken before external liquidity, as smart money tests these levels first to gauge market strength and build positions. :::
External Range Liquidity Patterns
External range liquidity exists beyond the established range boundaries - above resistance and below support. This represents the most obvious liquidity that retail traders typically target with their breakout strategies.
Why External Liquidity Forms
Retail traders commonly:
- Place buy stops above resistance expecting upside breakouts
- Set sell stops below support to protect long positions
- Enter breakout trades at range extremes
- Use obvious technical levels for risk management
This predictable behavior creates large liquidity pools that institutions can exploit.
:::warning External liquidity sweeps often result in false breakouts, trapping retail traders in poor positions while smart money enters at favorable prices. :::
External Liquidity Characteristics
High-Probability Locations:
- Previous swing highs/lows beyond the range
- Equal highs/lows outside current structure
- Round psychological numbers
- Daily/weekly/monthly highs and lows
Market Behavior Patterns:
- Quick spikes beyond range boundaries
- Immediate reversal after liquidity collection
- High volume on the liquidity grab
- Weak follow-through on breakout attempts
How to Identify Liquidity Zones on Charts
Successful liquidity analysis requires a systematic approach to chart reading. Here's a step-by-step process to identify both internal vs external range liquidity effectively.
Step 1: Define the Range Structure
1. Identify clear support and resistance levels 2. Mark the range boundaries with horizontal lines 3. Note the time frame - higher timeframes show more significant ranges 4. Observe price behavior at these levels over time
Step 2: Map Internal Liquidity
Look for:
- Swing highs/lows within the range
- Areas where price struggled to break through
- Levels with multiple touches and reactions
- Previous breakout attempts that failed
Mark these levels and observe how price behaves when approaching them.
Step 3: Identify External Liquidity
Above the range:
- Previous highs that haven't been tested
- Equal highs from earlier price action
- Round numbers above resistance
- Obvious breakout levels
Below the range:
- Previous lows beyond current support
- Equal lows from recent structure
- Round numbers below support
- Obvious breakdown levels
:::example On a EUR/USD daily chart, if price ranges between 1.0800-1.0900, internal liquidity might exist at 1.0825, 1.0850, and 1.0875. External liquidity could be at 1.0920 (previous high) above and 1.0780 (previous low) below. :::
Step 4: Analyze Volume and Price Action
Volume Indicators:
- High volume at liquidity levels suggests significant interest
- Volume spikes during liquidity sweeps confirm manipulation
- Low volume breakouts often fail quickly
Price Action Signals:
- Long wicks at liquidity levels show rejection
- Quick reversals after touching liquidity zones
- Consolidation patterns before major moves
Trading Strategies for Liquidity Patterns
Once you can identify internal vs external range liquidity, you can develop trading strategies that align with smart money flow rather than fighting against it.
Internal Liquidity Trading Strategy
Setup Requirements:
- Clear range structure established
- Multiple internal liquidity levels identified
- Confluence with other technical factors
Entry Signals:
- Price approaches internal liquidity zone
- Volume increases on the approach
- Rejection candlestick patterns form
- Price fails to break through cleanly
Trade Management:
- Set stops beyond the liquidity zone
- Target the opposite range boundary
- Scale out at intermediate levels
- Trail stops as price moves favorably
:::tip Internal liquidity trades work best in well-established ranges with clear boundaries and multiple successful tests of the levels. :::
External Liquidity Trading Strategy
Liquidity Grab Setup:
- Wait for price to sweep external liquidity
- Look for immediate reversal signals
- Enter on the pullback after the sweep
- Target internal range levels initially
Breakout Failure Strategy:
- Identify obvious external liquidity zones
- Wait for false breakout attempts
- Enter when price returns inside the range
- Target the opposite range boundary
Risk Management for Liquidity Trading
Position Sizing:
- Use smaller positions on initial liquidity tests
- Increase size on confirmed reversals
- Never risk more than 1-2% per trade
Stop Loss Placement:
- Place stops beyond significant liquidity zones
- Use time-based stops for ranging markets
- Adjust stops based on market volatility
Common Mistakes and How to Avoid Them
Understanding internal vs external range liquidity is just the beginning. Avoiding these common pitfalls will improve your trading success significantly.
Mistake 1: Trading Every Liquidity Level
The Problem: Not all liquidity zones are created equal. Trading every potential level leads to overtrading and poor risk/reward ratios.
The Solution:
- Focus on high-probability setups with multiple confluences
- Prioritize liquidity zones with strong historical significance
- Wait for clear price action confirmation
Mistake 2: Ignoring Market Context
The Problem: Liquidity analysis works best within the broader market context. Ignoring trends and sentiment reduces effectiveness.
The Solution:
- Consider overall market direction
- Analyze multiple timeframes
- Factor in fundamental developments
- Respect major trend momentum
:::warning Liquidity zones in strong trending markets often get broken decisively. Always consider the bigger picture before taking trades. :::
Mistake 3: Poor Timing on Entries
The Problem: Entering too early at liquidity zones without confirmation can result in premature stops.
The Solution:
- Wait for price action confirmation
- Use lower timeframe signals for precise entries
- Look for volume confirmation
- Be patient with setup development
Mistake 4: Inadequate Risk Management
The Problem: Liquidity trading can be whippy, requiring proper risk management to survive the learning curve.
The Solution:
- Use appropriate position sizes
- Set realistic stop losses
- Take partial profits at key levels
- Maintain consistent risk per trade
Conclusion
Mastering the identification of internal vs external range liquidity provides a significant edge in trading by helping you understand where institutional money is likely to move price next. Internal liquidity typically gets tested first as smart money builds positions, while external liquidity often represents areas where retail traders get trapped in false breakouts.
The key to successful liquidity trading lies in:
- Systematic identification of both internal and external liquidity zones
- Patient execution waiting for high-probability setups
- Proper risk management to survive the learning process
- Continuous analysis of how price behaves at these levels
Remember that liquidity analysis is most effective when combined with other technical analysis tools and market context. No single approach guarantees success, but understanding these concepts will significantly improve your market timing and trade selection.
Start practicing by identifying internal vs external range liquidity on your charts today. Focus on major currency pairs or liquid stocks to see these patterns clearly, and gradually develop your eye for spotting these crucial trading opportunities. With consistent practice and proper risk management, liquidity analysis can become a cornerstone of your trading strategy.