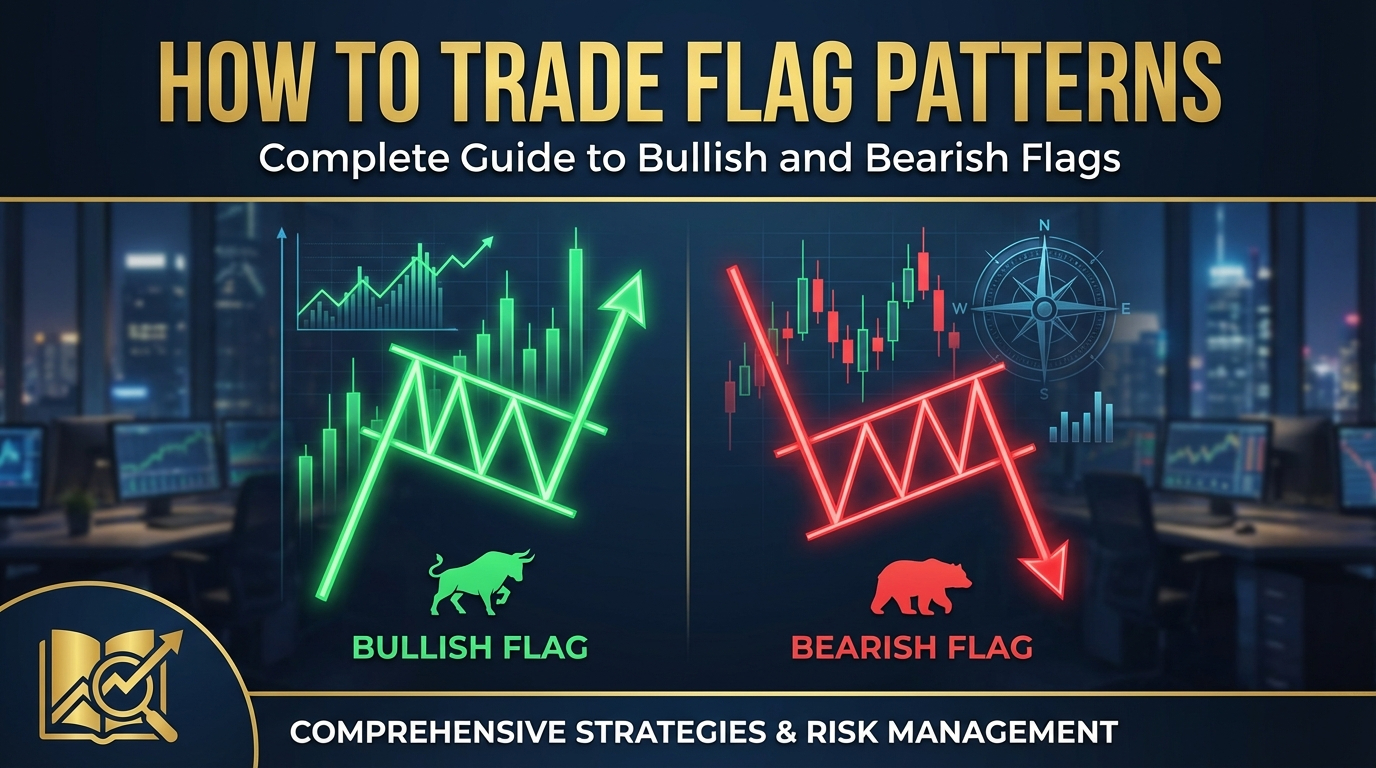
# How to Trade Flag Patterns: Complete Guide to Bullish and Bearish Flags
Flag patterns are among the most reliable continuation patterns in technical analysis, offering traders clear entry and exit signals with well-defined risk parameters. These chart formations appear across all timeframes and markets, making them essential tools for both day traders and swing traders looking to capitalize on trending moves.
Understanding how to trade flag patterns can significantly improve your trading success rate, as these formations typically indicate strong momentum continuation with measurable profit targets. Whether you're trading forex, stocks, or cryptocurrencies, flag patterns provide consistent opportunities when properly identified and executed.
Table of Contents
- [What Are Flag Patterns and Why They Matter](#what-are-flag-patterns-and-why-they-matter)
- [Identifying Bullish Flag Patterns](#identifying-bullish-flag-patterns)
- [Recognizing Bearish Flag Patterns](#recognizing-bearish-flag-patterns)
- [Trading Strategies and Entry Techniques](#trading-strategies-and-entry-techniques)
- [Risk Management and Exit Strategies](#risk-management-and-exit-strategies)
- [Common Mistakes and How to Avoid Them](#common-mistakes-and-how-to-avoid-them)
- [Conclusion](#conclusion)
What Are Flag Patterns and Why They Matter
Flag patterns are short-term consolidation formations that occur within strong trending moves. They represent brief pauses where traders take profits or new participants enter the market before the original trend resumes. The pattern gets its name from its visual resemblance to a flag on a flagpole.
:::key-concept A flag pattern consists of two main components: 1. The Flagpole: A sharp, impulsive move in one direction 2. The Flag: A rectangular consolidation that slopes against the prevailing trend :::
These patterns typically last between 1-3 weeks on daily charts, though they can appear on any timeframe from 5-minute charts to monthly charts. The key characteristic is that volume should decrease during the flag formation and increase when the pattern breaks out.
Why Flag Patterns Are Important
Flag patterns offer several advantages for traders:
- High probability setups: Success rates often exceed 70% when properly identified
- Clear risk parameters: Well-defined stop loss and target levels
- Strong momentum indication: Confirms trend continuation
- Measurable targets: The flagpole height projects the minimum move
:::tip Flag patterns work best in trending markets. Avoid trading flags in choppy, sideways markets where the pattern may fail to reach its target. :::
Identifying Bullish Flag Patterns
Bullish flags form during uptrends and signal potential continuation higher. Learning how to trade flag patterns successfully begins with proper identification of their structural components.
Key Components of Bullish Flags
1. Strong upward flagpole: A sharp rally with above-average volume 2. Downward-sloping flag: Parallel trendlines containing the pullback 3. Decreasing volume: Lower trading activity during consolidation 4. Duration: Typically 1-3 weeks on daily charts
:::example Consider a stock that rallies from $50 to $60 in three days on high volume (the flagpole). It then consolidates between $58-$56 for two weeks with declining volume, forming parallel downward-sloping trendlines (the flag). This creates a textbook bullish flag pattern. :::
Technical Requirements
For a valid bullish flag pattern, look for these specific criteria:
- The flagpole should represent at least 10-15% move in stocks (varies by asset class)
- Volume should be significantly above average during the flagpole formation
- The flag should retrace 38-50% of the flagpole
- Volume must decline during the flag formation
- The pattern should complete within 1-4 weeks
Measuring the Target
The profit target for bullish flags is calculated by measuring the flagpole height and projecting it from the breakout point. If the flagpole moves from $50 to $60 ($10 move), and the breakout occurs at $58, the target would be $68 ($58 + $10).
:::warning Beware of flags that last longer than 4 weeks, as they may evolve into different patterns or lose their momentum characteristics. :::
Recognizing Bearish Flag Patterns
Bearish flags appear during downtrends and indicate potential continuation lower. These patterns mirror bullish flags but occur after sharp declines.
Structural Elements
1. Strong downward flagpole: Sharp decline with increased volume 2. Upward-sloping flag: Parallel trendlines containing the bounce 3. Decreasing volume: Reduced activity during the bounce 4. Time constraint: Similar duration to bullish flags
Identification Checklist
When learning how to trade flag patterns on the bearish side, use this checklist:
- [ ] Clear downward flagpole with volume expansion
- [ ] Flag retraces 38-50% of the flagpole
- [ ] Parallel or near-parallel trendlines
- [ ] Volume decreases during flag formation
- [ ] Pattern completes within reasonable timeframe
:::example A currency pair drops from 1.2000 to 1.1800 over four days (flagpole), then bounces between 1.1850-1.1900 for ten days with declining volume (flag). The target would be 1.1600 (1.1800 - 200 pips flagpole height). :::
Volume Characteristics
Volume analysis is crucial for bearish flags:
- Flagpole formation: Volume should increase as price falls
- Flag formation: Volume should decrease during the bounce
- Breakout: Volume should expand as price breaks below the flag
Trading Strategies and Entry Techniques
Successful flag pattern trading requires precise entry timing and proper trade management. Here are proven strategies for how to trade flag patterns effectively.
Entry Methods
1. Breakout Entry
The most common approach involves entering when price breaks beyond the flag boundaries:
For Bullish Flags:
- Enter long when price breaks above the upper flag trendline
- Confirm with increased volume
- Place stop loss below the flag's lowest point
For Bearish Flags:
- Enter short when price breaks below the lower flag trendline
- Confirm with volume expansion
- Place stop loss above the flag's highest point
2. Flag Boundary Entry
More aggressive traders enter at the flag boundaries:
- Buy at the lower flag trendline in bullish patterns
- Sell at the upper flag trendline in bearish patterns
- Use smaller position sizes due to higher risk
:::tip Wait for a clear break of the flag trendline with at least 2-3% penetration to avoid false breakouts. :::
Position Sizing
Proper position sizing is essential when trading flag patterns:
1. Calculate risk: Distance from entry to stop loss 2. Determine position size: Risk no more than 1-2% of capital per trade 3. Account for slippage: Add buffer for market gaps
Multiple Timeframe Analysis
Enhance your flag pattern trading by analyzing multiple timeframes:
- Higher timeframe: Confirms overall trend direction
- Entry timeframe: Identifies the flag pattern
- Lower timeframe: Provides precise entry timing
:::key-concept Always ensure the flag pattern aligns with the higher timeframe trend. Trading flags against the major trend significantly reduces success rates. :::
Risk Management and Exit Strategies
Effective risk management separates successful flag pattern traders from those who struggle. Understanding how to trade flag patterns includes knowing when and how to exit positions.
Stop Loss Placement
For Bullish Flags:
- Conservative: Below the flag's lowest point
- Aggressive: Below the entry candle's low
- Very conservative: Below the flagpole's starting point
For Bearish Flags:
- Conservative: Above the flag's highest point
- Aggressive: Above the entry candle's high
- Very conservative: Above the flagpole's starting point
Take Profit Strategies
Primary Target
The measured move provides the minimum target:
- Bullish flags: Entry + flagpole height
- Bearish flags: Entry - flagpole height
Partial Profit Taking
Consider taking profits in stages:
- 50% at the measured target
- 25% at 1.5x the flagpole height
- 25% trail with moving average or trendline
:::example In a bullish flag with a $5 flagpole and $52 entry:
:::
- Take 50% profit at $57 (measured target)
- Take 25% at $59.50 (1.5x extension)
- Trail remaining 25% with 20-period moving average
Trade Management Techniques
1. Move stop to breakeven: Once price moves 50% toward target 2. Trail stops: Use ATR-based or percentage trailing stops 3. Time stops: Exit if pattern takes too long to develop 4. Volume confirmation: Exit if volume doesn't support the move
:::warning Never risk more than you can afford to lose. Flag patterns, while reliable, can fail, especially in volatile market conditions. :::
Common Mistakes and How to Avoid Them
Even experienced traders make errors when trading flag patterns. Here are the most common mistakes and prevention strategies.
Pattern Recognition Errors
Mistake 1: Trading weak flagpoles
- Problem: Entering patterns without sufficient momentum
- Solution: Ensure flagpole represents significant move (10%+ for stocks)
Mistake 2: Ignoring volume
- Problem: Trading patterns without proper volume confirmation
- Solution: Always verify volume decreases during flag formation
Mistake 3: Poor trendline drawing
- Problem: Forcing patterns that don't exist
- Solution: Use at least 3 touch points for valid trendlines
Timing and Execution Mistakes
Mistake 4: Premature entry
- Problem: Entering before clear breakout
- Solution: Wait for confirmed break with volume
Mistake 5: Late entry
- Problem: Chasing after significant move
- Solution: Set alerts and have entry orders ready
Risk Management Errors
Mistake 6: Wide stops
- Problem: Risking too much capital per trade
- Solution: Use tighter stops with smaller position sizes
Mistake 7: No profit plan
- Problem: Holding too long or exiting too early
- Solution: Establish targets before entering trade
:::tip Keep a trading journal to track your flag pattern trades. Review both winners and losers to identify improvement areas. :::
Market Context Mistakes
Mistake 8: Trading against major trend
- Problem: Trading bearish flags in bull markets
- Solution: Always check higher timeframe trend
Mistake 9: Ignoring market conditions
- Problem: Trading patterns during low volatility periods
- Solution: Focus on flag patterns during trending markets
How to Improve Your Flag Pattern Trading
1. Practice on demo accounts: Build confidence without risk 2. Study historical patterns: Analyze past examples in your chosen markets 3. Use proper tools: Employ charting software with volume indicators 4. Stay disciplined: Follow your trading plan consistently 5. Continuous learning: Study failed patterns to understand why they occurred
Conclusion
Mastering how to trade flag patterns provides traders with a reliable tool for capturing trend continuation moves across all markets and timeframes. These patterns offer clear entry signals, well-defined risk parameters, and measurable profit targets that can significantly enhance trading performance.
Key takeaways for successful flag pattern trading:
- Proper identification: Look for strong flagpoles with declining volume during consolidation
- Confirmation requirements: Wait for clear breakouts with volume expansion
- Risk management: Use appropriate stop losses and position sizing
- Profit targets: Apply measured moves while considering partial profit-taking
- Market context: Trade flags in the direction of the major trend
Remember that no pattern works 100% of the time, but flag patterns offer favorable risk-reward ratios when properly executed. The combination of high probability setups and clear risk parameters makes them valuable additions to any trader's toolkit.
Start practicing flag pattern identification on your charts today. Begin with paper trading to build confidence, then gradually implement these strategies with small position sizes as you develop proficiency. With consistent practice and proper risk management, flag patterns can become a cornerstone of your trading success.
:::tip Ready to improve your chart analysis skills? Start by identifying flag patterns on your favorite trading instruments and practice the techniques outlined in this guide. Remember, successful trading comes from consistent application of proven strategies combined with disciplined risk management. :::