# How to Trade the Three-Bar Reversal Pattern on the Daily Chart: A Complete Trading Guide
The three-bar reversal pattern is one of the most reliable and straightforward reversal patterns that traders can use to identify potential turning points in market trends. Unlike complex technical indicators that can lag or provide false signals, this pattern offers a clear, visual confirmation of momentum shifts that occur over three consecutive trading sessions.
This pattern's effectiveness stems from its ability to capture the psychological shift in market sentiment as bulls and bears battle for control. When properly identified and traded, the three-bar reversal pattern can provide excellent risk-to-reward ratios and high probability entries at key market turning points.
Table of Contents
- [Understanding the Three-Bar Reversal Pattern](#understanding-the-three-bar-reversal-pattern)
- [Identifying Valid Three-Bar Reversal Setups](#identifying-valid-three-bar-reversal-setups)
- [Entry and Exit Strategies](#entry-and-exit-strategies)
- [Risk Management and Position Sizing](#risk-management-and-position-sizing)
- [Advanced Trading Techniques and Market Context](#advanced-trading-techniques-and-market-context)
- [Common Mistakes and How to Avoid Them](#common-mistakes-and-how-to-avoid-them)
- [Conclusion](#conclusion)
Understanding the Three-Bar Reversal Pattern
The three-bar reversal pattern is a price action formation that signals a potential trend reversal through the interaction of three consecutive candlesticks or bars. This pattern works on any timeframe but is particularly effective on daily charts where institutional money flows and longer-term sentiment shifts are most apparent.
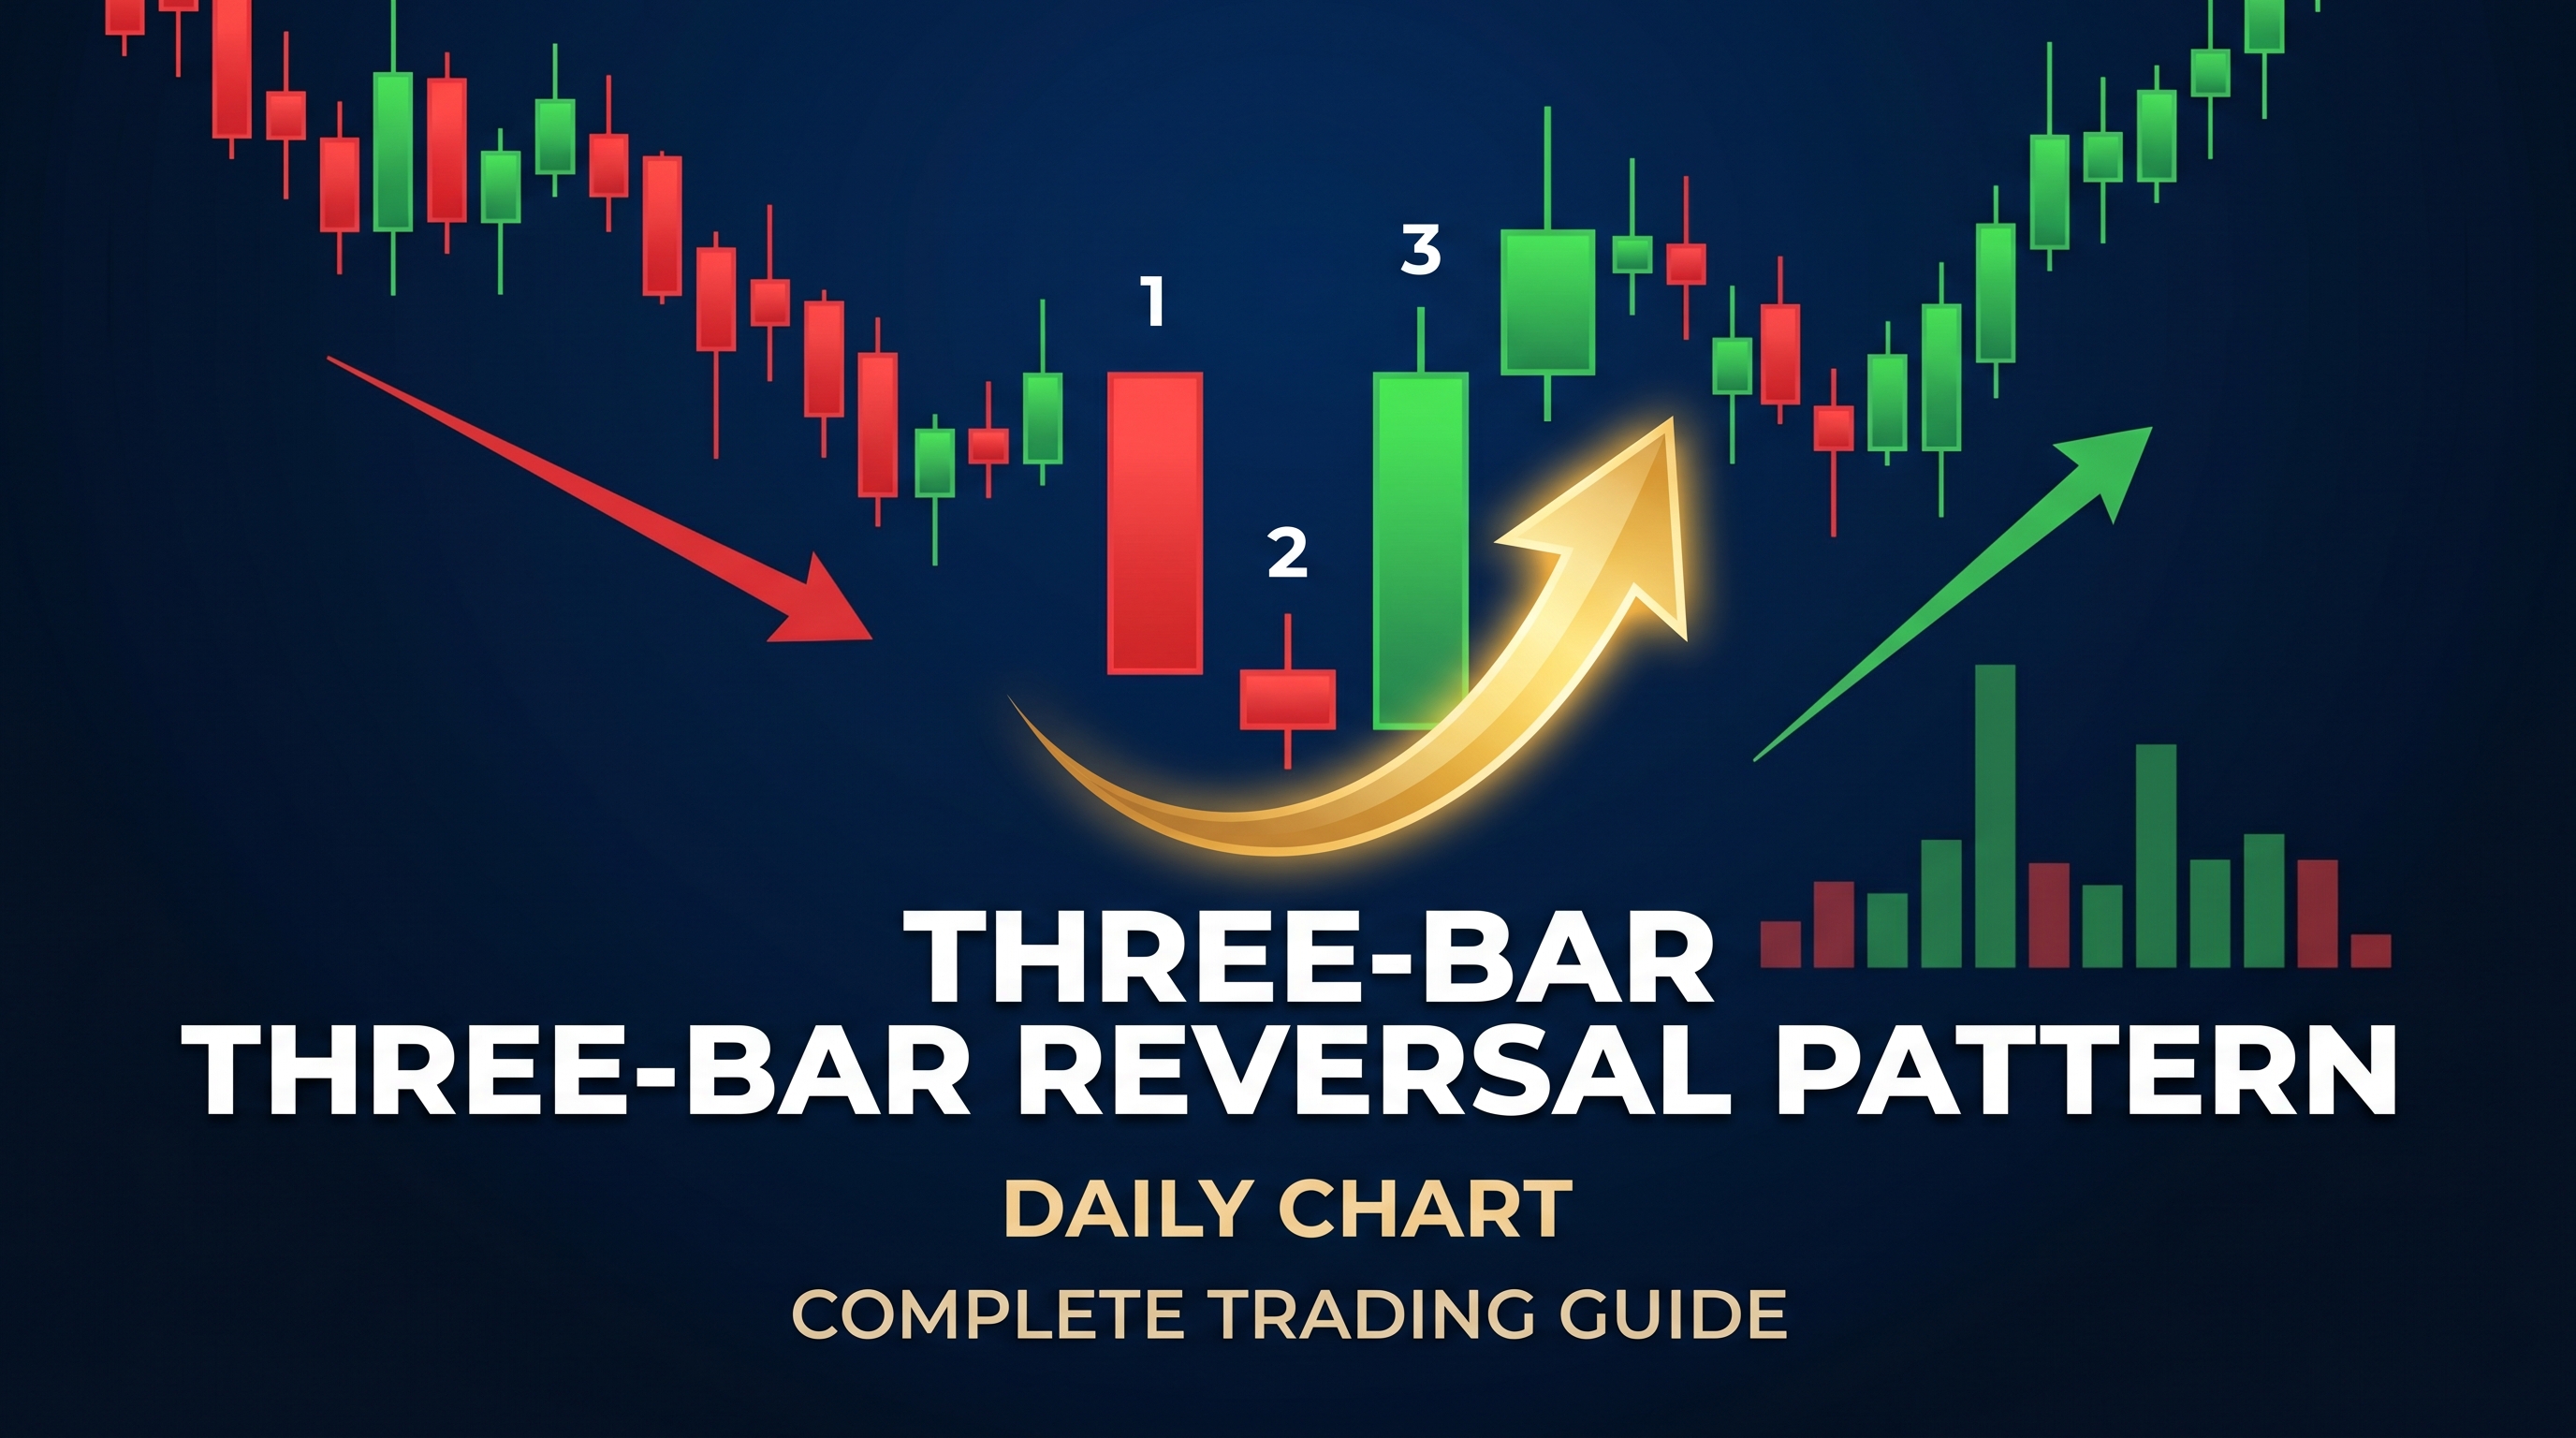
:::key-concept A three-bar reversal pattern consists of: 1. Bar 1: A strong directional move in the prevailing trend 2. Bar 2: A smaller bar showing indecision or weakening momentum 3. Bar 3: A reversal bar that closes beyond a key level from Bar 1 :::
Bullish Three-Bar Reversal Pattern
In a bullish three-bar reversal pattern, we see:
- First Bar: A strong bearish candle extending the downtrend
- Second Bar: A smaller candle (can be bullish or bearish) showing reduced selling pressure
- Third Bar: A bullish candle that closes above the high of the first bar
This sequence indicates that sellers are losing control and buyers are stepping in with sufficient force to overcome the previous selling pressure.
Bearish Three-Bar Reversal Pattern
Conversely, a bearish three-bar reversal pattern shows:
- First Bar: A strong bullish candle extending the uptrend
- Second Bar: A smaller candle showing reduced buying pressure
- Third Bar: A bearish candle that closes below the low of the first bar
This formation suggests that buyers are exhausted and sellers are taking control of the market.
:::example Consider a stock that has been in a downtrend for several weeks. On Monday, it gaps down and closes near its lows with high volume (Bar 1). Tuesday shows a small doji candle with reduced volume (Bar 2). Wednesday opens higher and closes above Monday's high on increased volume (Bar 3). This creates a valid bullish three-bar reversal pattern. :::
Identifying Valid Three-Bar Reversal Setups
Not every three-bar formation constitutes a valid reversal pattern. Successful traders must distinguish between high-probability setups and random price noise. Here are the key criteria for identifying legitimate three-bar reversal patterns:
Essential Validation Criteria
1. Clear Trend Context The pattern must occur within the context of an established trend. Look for:
- At least 10-15 bars of trending price action before the pattern
- Clear higher highs and higher lows (uptrend) or lower highs and lower lows (downtrend)
- Trend angles of at least 30-45 degrees for optimal momentum
2. Volume Confirmation Volume provides crucial validation:
- Bar 1 should show above-average volume indicating strong directional pressure
- Bar 2 typically shows reduced volume reflecting indecision
- Bar 3 should display increased volume confirming the reversal
3. Support and Resistance Levels The most powerful three-bar reversal patterns occur at:
- Key psychological levels (round numbers)
- Previous swing highs or lows
- Fibonacci retracement levels
- Moving average convergence points
- Trend line intersections
:::tip Use multiple timeframe analysis to confirm your three-bar reversal pattern. Check the weekly chart to ensure you're not trading against a stronger trend, and use the 4-hour chart to fine-tune your entry timing. :::
4. Bar Size and Range Relationships Look for specific proportional relationships:
- Bar 1 should be larger than the recent average range
- Bar 2 should be noticeably smaller than Bar 1
- Bar 3 should equal or exceed Bar 1's range
Market Structure Considerations
The three-bar reversal pattern becomes more reliable when it aligns with broader market structure:
- Break of Structure (BOS): The pattern should create a clear break in the previous trend structure
- Change of Character (CHOCH): Look for shifts from impulsive moves to corrective moves
- Liquidity Zones: Patterns at areas where stop losses cluster are often more effective
Entry and Exit Strategies
Successful trading of the three-bar reversal pattern requires precise entry and exit strategies that maximize profit potential while managing risk effectively.
Entry Strategies
Strategy 1: Aggressive Entry Enter during the formation of the third bar when:
- Price breaks above/below the high/low of the first bar
- Volume is increasing
- The bar is showing strong directional momentum
Strategy 2: Conservative Entry Wait for pattern completion and enter on:
- A pullback to the breakout level
- The close of the third bar if all criteria are met
- The opening of the fourth bar with a stop above/below the pattern
:::example For a bullish three-bar reversal pattern:
:::
- Aggressive entry: Buy when price breaks above Bar 1's high during Bar 3
- Conservative entry: Buy at the close of Bar 3 or on a pullback to Bar 1's high level
Stop Loss Placement
Proper stop loss placement is crucial for risk management:
For Bullish Reversals:
- Place stops below the low of Bar 2 (tighter stop)
- Place stops below the low of the entire three-bar pattern (safer stop)
For Bearish Reversals:
- Place stops above the high of Bar 2 (tighter stop)
- Place stops above the high of the entire three-bar pattern (safer stop)
Take Profit Targets
Establish multiple profit targets to maximize returns:
Target 1: Conservative (1:1 Risk-Reward)
- Distance equal to the pattern's range
- Often reached quickly, allowing for partial profit-taking
Target 2: Intermediate (1:2 Risk-Reward)
- Next significant support/resistance level
- Previous swing high/low in the opposite direction
Target 3: Extended (1:3+ Risk-Reward)
- Major structural levels
- Fibonacci extension levels
- Trend line projections
:::warning Never risk more than 1-2% of your trading capital on any single three-bar reversal pattern trade. The pattern's effectiveness can vary significantly based on market conditions and overall sentiment. :::
Risk Management and Position Sizing
Effective risk management separates profitable traders from those who blow up their accounts. When trading the three-bar reversal pattern, implement these risk management principles:
Position Sizing Methodology
1. Fixed Percentage Method
- Risk no more than 1-2% of account equity per trade
- Calculate position size based on stop loss distance
- Formula: Position Size = (Account Equity × Risk %) ÷ Stop Distance
2. Volatility-Based Sizing
- Adjust position size based on market volatility
- Use Average True Range (ATR) to gauge volatility
- Reduce size in high volatility environments
Trade Management Techniques
Scaling Out Strategy
- Take 1/3 profit at Target 1
- Move stop to breakeven
- Take 1/3 profit at Target 2
- Trail remaining position with trend
Break-Even Strategy
- Move stop loss to entry price when Target 1 is reached
- This ensures no loss on the trade
- Allows remaining position to run for larger gains
:::tip Keep a trading journal to track your three-bar reversal pattern trades. Record the setup quality, entry/exit points, and outcome. This data will help you refine your approach and identify which market conditions produce the best results. :::
Advanced Trading Techniques and Market Context
Experienced traders enhance their three-bar reversal pattern trading by incorporating advanced techniques and considering broader market context.
Multiple Timeframe Confirmation
Use a top-down approach for maximum effectiveness:
Weekly Chart Analysis
- Identify major trend direction
- Locate key support/resistance levels
- Assess overall market sentiment
Daily Chart Setup
- Identify the three-bar reversal pattern
- Confirm alignment with weekly bias
- Plan entry and exit levels
4-Hour Chart Timing
- Fine-tune entry timing
- Identify short-term support/resistance
- Monitor momentum indicators
Confluence Trading
Combine the three-bar reversal pattern with other technical analysis tools:
Fibonacci Levels
- Pattern occurring at 50%, 61.8%, or 78.6% retracement levels
- Higher probability of success
- Clear invalidation levels
Moving Average Interaction
- Pattern at key moving averages (20, 50, 200 EMA)
- Dynamic support/resistance confirmation
- Trend strength assessment
Divergence Analysis
- RSI or MACD divergence with price
- Confirms weakening momentum
- Early reversal warning signals
Market Session Considerations
Timing matters when trading the three-bar reversal pattern:
Asian Session
- Often shows consolidation patterns
- Lower volume may reduce pattern reliability
- Good for pattern identification
European Session
- Increased volatility and volume
- Strong trend continuation or reversal
- High-quality pattern formation
US Session
- Maximum volume and volatility
- Institutional participation
- Most reliable pattern confirmation
:::key-concept The three-bar reversal pattern works best during trending market conditions. In ranging or choppy markets, the pattern may produce more false signals and whipsaws. :::
Common Mistakes and How to Avoid Them
Even experienced traders make mistakes when trading the three-bar reversal pattern. Here are the most common errors and how to avoid them:
Mistake 1: Ignoring Market Context
Problem: Trading every three-bar formation without considering the broader trend Solution: Always assess the higher timeframe trend before taking a trade
Mistake 2: Poor Risk Management
Problem: Risking too much capital or using inappropriate stop losses Solution: Implement strict position sizing rules and use logical stop placement
Mistake 3: Impatience with Entry Timing
Problem: Entering too early before pattern completion Solution: Wait for full pattern confirmation or use staged entry approaches
Mistake 4: Neglecting Volume Analysis
Problem: Focusing only on price action without volume confirmation Solution: Always verify pattern validity with volume analysis
Mistake 5: Unrealistic Profit Expectations
Problem: Expecting every trade to hit maximum targets Solution: Use scaling strategies and realistic profit-taking levels
:::warning The three-bar reversal pattern is not infallible. Market conditions, news events, and institutional activity can override technical patterns. Always be prepared to exit if market conditions change. :::
Improving Pattern Recognition
Practice Daily Chart Review
- Spend 15-30 minutes daily reviewing charts
- Identify both successful and failed patterns
- Note market conditions during each occurrence
Backtesting Strategy
- Test the pattern on historical data
- Calculate win rates and average returns
- Identify optimal market conditions
Real-Time Monitoring
- Use alerts to notify you of potential setups
- Practice pattern identification in live markets
- Keep detailed records of all observations
Conclusion
The three-bar reversal pattern represents a powerful tool in any trader's arsenal when properly understood and applied. This pattern's strength lies in its simplicity and visual clarity, making it accessible to traders of all experience levels while providing reliable signals for trend reversals.
Success with the three-bar reversal pattern requires more than just pattern recognition. Traders must combine proper identification with sound risk management, appropriate market context analysis, and disciplined execution. The pattern works best when it occurs at significant support or resistance levels, is confirmed by volume, and aligns with broader market structure.
Remember that no trading pattern guarantees success. The three-bar reversal pattern should be part of a comprehensive trading strategy that includes proper risk management, position sizing, and emotional discipline. By following the guidelines outlined in this guide and practicing with historical data, you can develop the skills necessary to trade this pattern effectively.
The key to long-term success is consistency and patience. Focus on high-quality setups that meet all your criteria rather than forcing trades on marginal patterns. With time and practice, the three-bar reversal pattern can become a reliable component of your trading methodology.
Ready to start identifying three-bar reversal patterns? Begin by practicing chart analysis on your preferred trading platform. Start with major currency pairs or liquid stocks, and focus on daily charts to develop your pattern recognition skills. Remember to always trade with proper risk management and never risk more than you can afford to lose.