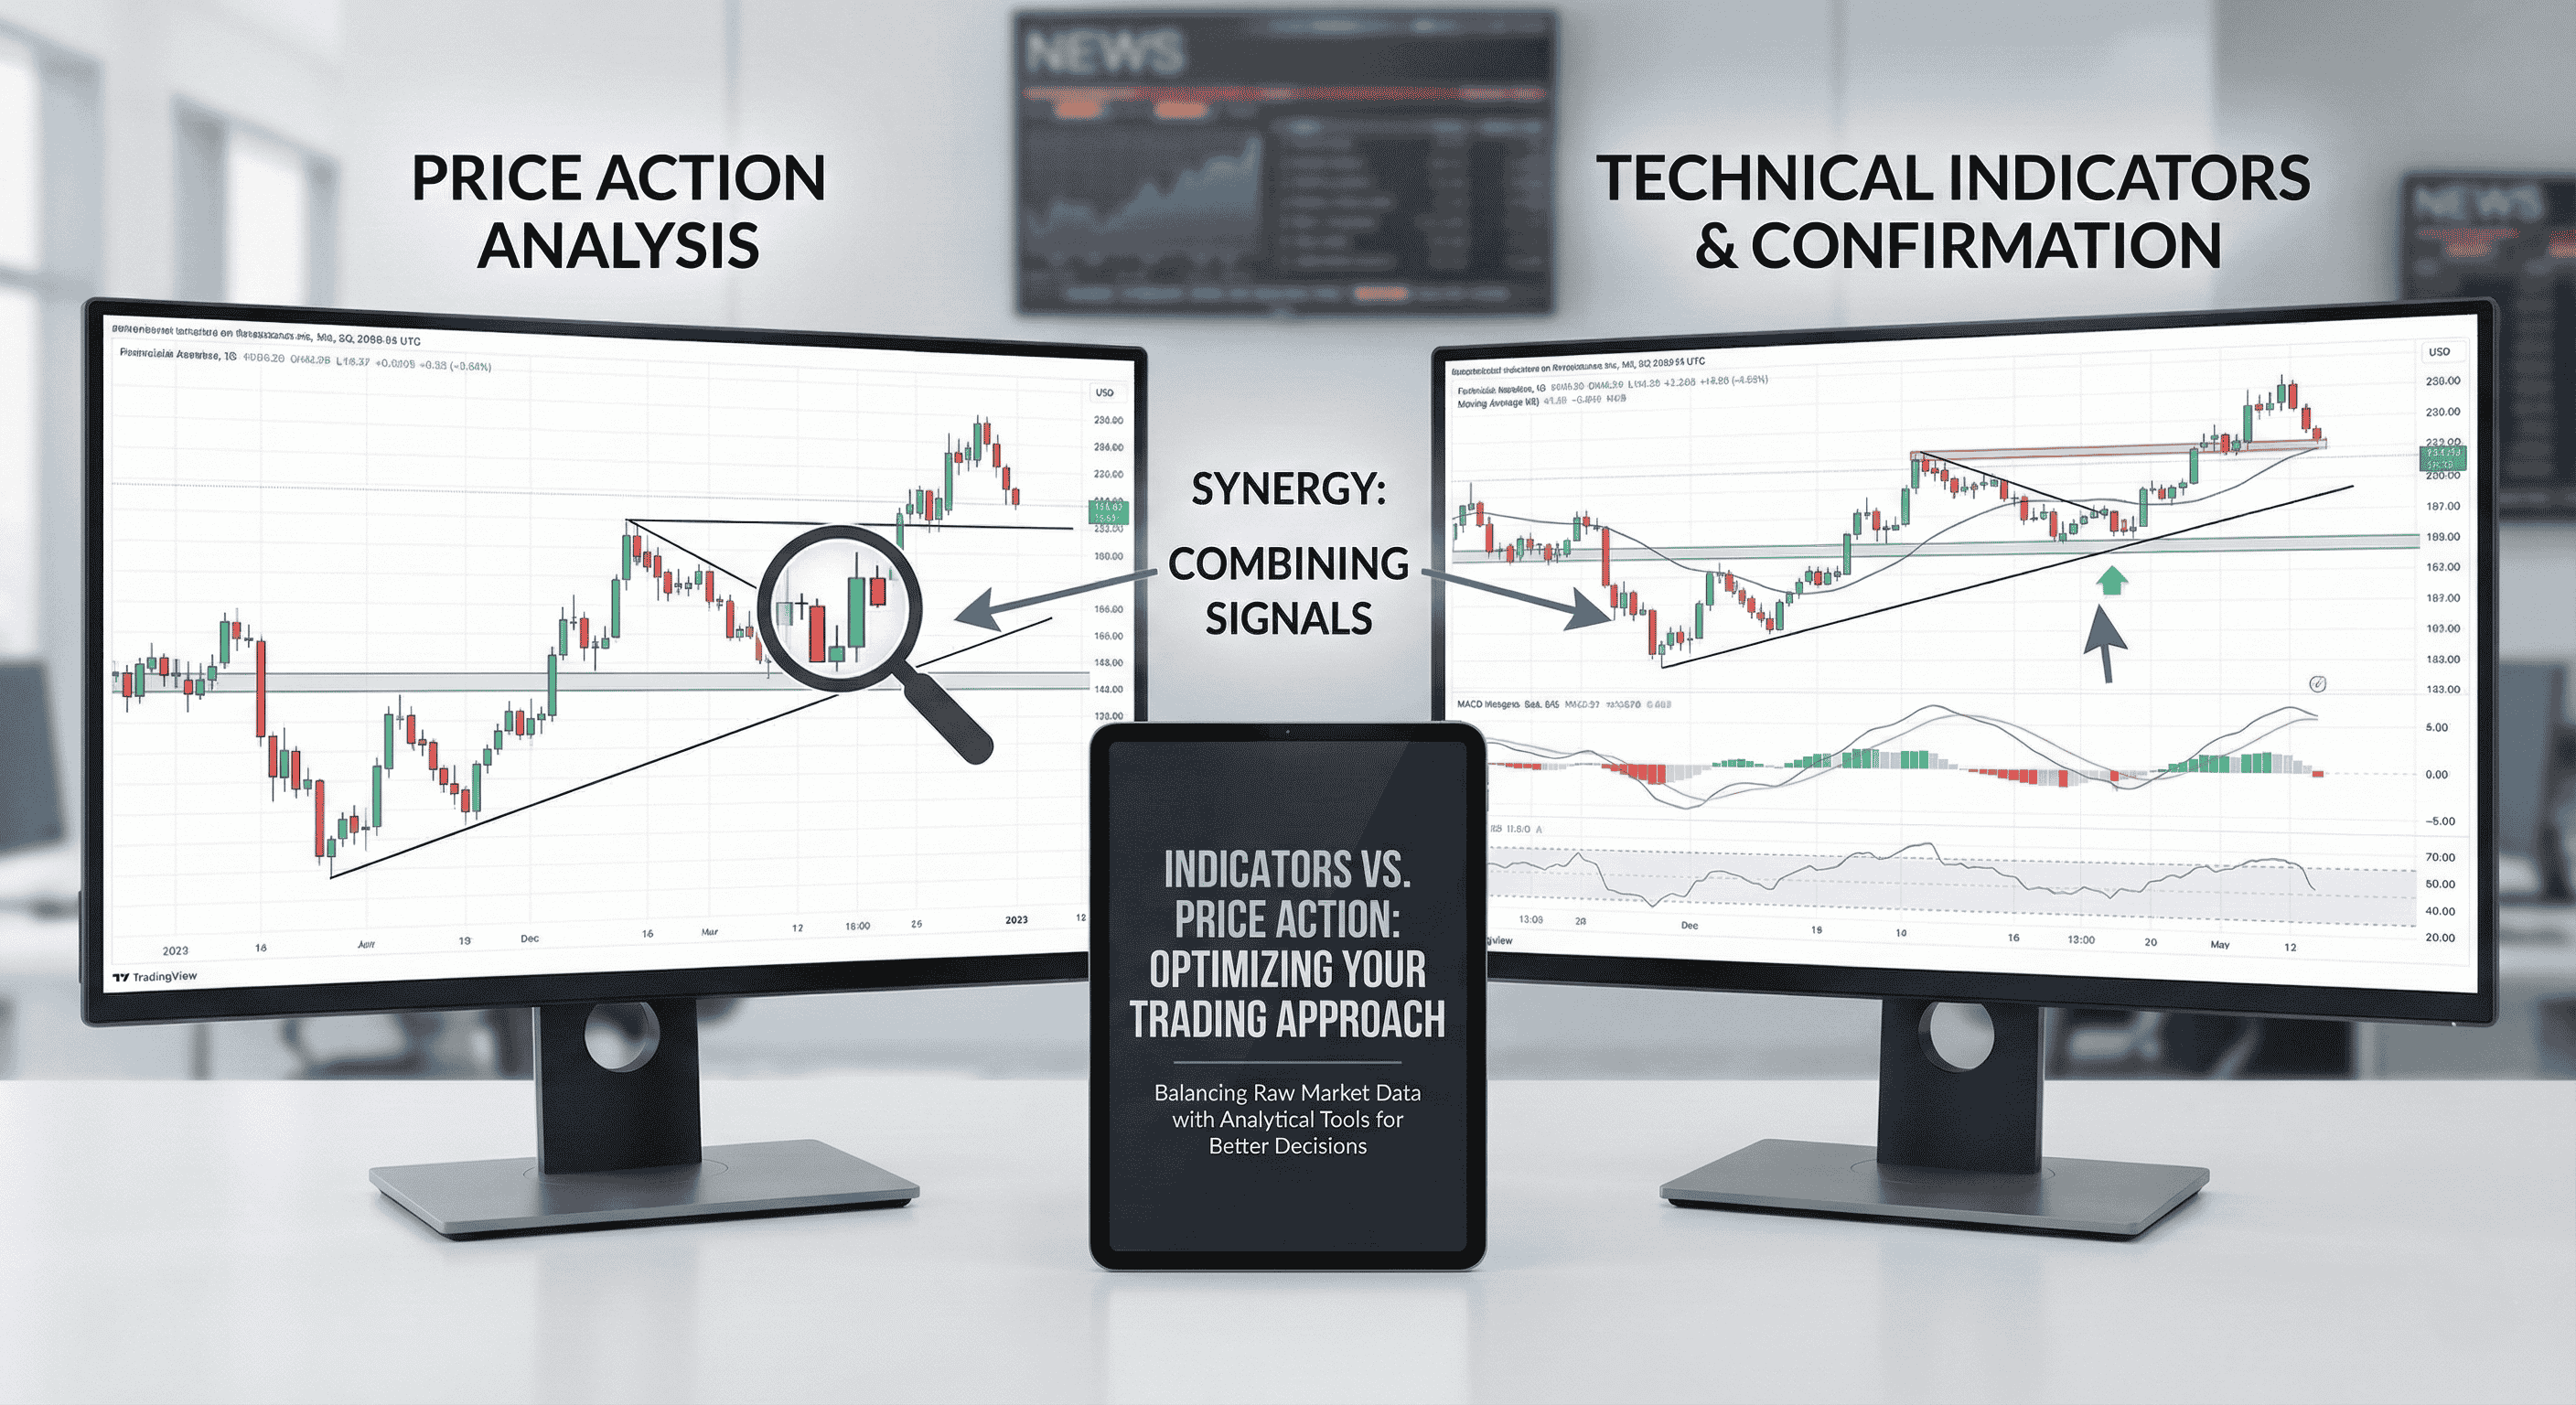
# Indicators vs. Price Action: Optimizing Your Trading Approach
Welcome, traders! In the dynamic world of financial markets, understanding how to interpret market data is paramount to success. Two primary schools of thought often clash in this endeavor: relying on technical indicators and focusing on pure price action. Both have their merits and drawbacks, and understanding when to use each—or how to combine them effectively—can drastically improve your trading outcomes.
This guide will dissect the unique characteristics of technical indicators and price action trading. We will explore their strengths, weaknesses, and provide practical insights into building a robust trading strategy that leverages the best of both worlds. Whether you're a beginner looking for guidance or an experienced trader seeking to refine your approach, this guide will offer valuable perspectives.
---
Table of Contents
- [Understanding Technical Indicators](#understanding-technical-indicators)
- [The Power of Price Action](#the-power-of-price-action)
- [When Indicators Help and When They Hurt](#when-indicators-help-and-when-they-hurt)
- [Integrating Indicators and Price Action](#integrating-indicators-and-price-action)
- [Conclusion: Finding Your Optimal Trading Edge](#conclusion-finding-your-optimal-trading-edge)
---
Understanding Technical Indicators
Technical indicators are mathematical calculations based on historical price, volume, or open interest data. They are designed to forecast future price movements or identify market conditions. From simple moving averages to complex oscillators, indicators attempt to provide a quantitative edge by flagging potential trends, reversals, or overbought/oversold conditions.
:::key-concept Lagging vs. Leading Indicators
:::
- Lagging indicators (e.g., Moving Averages) follow price action and confirm trends after they have begun. They are great for trend following strategies.
- Leading indicators (e.g., RSI, Stochastic Oscillator) attempt to predict future price movements or reversals before they occur. They can be useful for identifying potential turning points, but can also generate false signals.
Common Types of Indicators
1. Trend-Following Indicators:
2. Oscillators:
3. Volatility Indicators:
- Moving Averages (MA, EMA): Smooth out price data to identify trend direction. Crossovers can signal potential entry/exit points.
- MACD (Moving Average Convergence Divergence): Shows the relationship between two moving averages of a security's price. Used to identify momentum, trend direction, and potential reversals.
- RSI (Relative Strength Index): Measures the speed and change of price movements. Used to identify overbought or oversold conditions (typically above 70 and below 30, respectively).
- Stochastic Oscillator: Compares a security's closing price to its price range over a given time period. Also used to identify overbought/oversold levels.
- Bollinger Bands: Measure market volatility and identify potential overbought/oversold conditions when price touches the upper/lower bands.
:::example Using a Moving Average for Trend Confirmation
A trader might use a 50-period Exponential Moving Average (EMA) on a 1-hour chart. When the price consistently stays above the 50 EMA and the EMA itself is sloping upwards, it confirms an uptrend. Conversely, price below a downward-sloping 50 EMA indicates a downtrend. Crossovers can act as potential trade signals. :::
The Power of Price Action
Price action trading involves analyzing raw price movements on a chart to understand market psychology, supply and demand, and potential future direction. It bypasses indicators, focusing instead on candlestick patterns, chart patterns, support and resistance levels, and market structure.
Core Principles of Price Action
- Candlestick Patterns: Formations like Engulfing patterns, Dojis, Hammers, and Shooting Stars can signal reversals or continuation of trends.
- Support and Resistance: Key price levels where buying or selling pressure has historically been strong, often acting as barriers to price movement.
- Market Structure: Identifying higher highs/higher lows (uptrend) or lower highs/lower lows (downtrend) to understand the prevailing market direction.
- Trendlines: Drawn connecting significant highs or lows, they help identify and define market trends.
:::key-concept **The
The Primacy of Price: Price action proponents believe that all relevant information about a market is reflected in its price. Indicators are seen as lagging derivatives of price, therefore providing delayed or less accurate signals. :::
When Indicators Help: Augmenting Price Action
While a pure price action approach can be highly effective, indicators aren't inherently "bad." When used judiciously and in conjunction with price action, they can provide valuable secondary confirmation, objective filters, or quick visual cues.
Specific Scenarios Where Indicators Shine:
- Confirmation of Price Action Signals:
- Volume: Highly effective as a confirming indicator. A strong candlestick reversal pattern occurring on significantly higher-than-average volume adds credibility to the reversal signal. Declining volume during a trend might signal weakening momentum, preceding a potential reversal.
- Momentum Oscillators (RSI, Stochastic): Can confirm overbought/oversold conditions identified by price reaching a strong resistance/support level. A divergence between price (making a new high) and an oscillator (making a lower high) can signal weakening momentum and a potential reversal, even before clear price action signals emerge.
:::example Divergence with RSI and Price Action
Imagine a stock's price makes a higher high, but its RSI indicator makes a lower high. This "bearish divergence" suggests that the upward momentum is weakening, even though price is still technically rising. If this divergence occurs at a significant resistance level, and then price action forms a bearish reversal candlestick pattern (e.g., a shooting star), the RSI divergence adds a strong layer of confirmation to the potential reversal trade. :::
- Objective Filters for Trend Identification:
- Moving Averages: Can provide an objective method for determining the prevailing trend without subjective interpretation. For instance, a rule might be: "Only take long trades when the price is above the 200-period Simple Moving Average and the 50-period EMA is above the 200-period SMA." This helps filter out counter-trend trades.
:::tip Consider using longer-period moving averages (e.g., 50, 100, 200 periods) for trend identification and shorter ones (e.g., 9, 20 periods) for more immediate entry/exit signals, always keeping the higher timeframe trend in mind. :::
- Volatility Measurement:
- Bollinger Bands, ATR (Average True Range): Essential for understanding market volatility. Bollinger Bands help identify when a market is expanding or contracting, potentially signaling an upcoming breakout or consolidation. ATR can be used to set appropriate stop-loss levels based on current market volatility, rather than fixed percentages.
:::key-concept Indicators as Secondary Confirmations: Indicators should generally serve as confirmation tools, not primary signal generators. Price action should always be the leading indicator of market behavior, with indicators playing a supporting role to enhance conviction or filter out lower-probability setups. :::
When Indicators Hurt: The Pitfalls of Over-Reliance
The primary way indicators can "hurt" a trader is when they are used as the sole basis for trading decisions, leading to analysis paralysis, lagging signals, and contradictory information.
Common Problems Caused by Over-Reliance on Indicators:
- Lagging Nature: By definition, most indicators are derived from past price data. This means they will always be behind the current price action. A "buy" signal from an indicator might appear well after a significant portion of an upward move has already occurred.
- Repainting/False Signals: Some indicators, especially those attempting to predict reversals, can repaint past signals or generate frequent false signals during choppy or consolidating markets, leading to whipsaws and losing trades.
- Analysis Paralysis: Using too many indicators simultaneously often results in conflicting signals. One indicator might suggest a buy, another a sell, and a third neutrality. This overwhelming contradictory information can paralyze a trader, leading to missed opportunities or hesitant, poorly timed entries.
- Tunnel Vision: Focusing solely on indicator signals can cause traders to ignore critical price action context, such as significant support/resistance levels, chart patterns that clearly indicate impending moves, or overall market structure.
- Optimization Syndrome: Continuously tweaking indicator settings to perfectly fit past data (curve-fitting) can create a system that looks great on historical charts but performs poorly in live trading because market conditions constantly change.
:::warning Never trade solely based on an indicator signal without understanding the underlying price action context. An indicator buy signal at a strong resistance level with declining volume is a low-probability trade, even if the indicator suggests otherwise. :::
The Synergy: Integrating Indicators and Price Action
The most effective approach often lies in a synergistic combination of price action for primary analysis and a select few, well-understood indicators for confirmation and contextual understanding.
A Practical Framework:
1. Start with Pure Price Action: Begin your analysis by identifying the market's structure (trend, range), key support and resistance zones, and significant candlestick patterns. This forms your primary trading hypothesis. 2. Define Your Trading Thesis: Based on price action, formulate what you believe the market is likely to do next (e.g., "The market is in an uptrend, pulling back to a key support level, and forming a bullish engulfing pattern – suggesting a continuation of the uptrend."). 3. Use 1-2 Confirming Indicators: Select a maximum of one to two non-redundant indicators to confirm or provide additional context to your price action thesis.
4. Validate or Invalidate: Does the indicator support your price action thesis?
5. Prioritize Price Action: If there's a strong conflict, always give precedence to pure price action and market structure over indicator signals.
- Example for trend trading: Use a Moving Average to confirm the trend direction and Volume to confirm the strength of your price action signal.
- Example for reversal trading: Use an Oscillator (RSI/Stochastic) to confirm overbought/oversold conditions at a key support/resistance level, and look for divergence.
- If Yes: Proceed with higher confidence, considering your risk management.
- If No (Conflicting Signal): Re-evaluate. Either your price action interpretation might be flawed, or the indicator is giving a false signal. It's often best to step aside and wait for a clearer setup.
:::example Entry Confirmation with Price Action and RSI
A stock price approaches a strong historical resistance level. On approach, you notice several small-bodied candles indicating indecision. Suddenly, a large bearish engulfing candle forms, breaking below the prior indecision. You check the RSI, and it was showing a bearish divergence, making a lower high while price made a higher high into resistance, solidifying the potential reversal. The high volume accompanying the engulfing candle adds further confirmation. This combination provides a strong short entry signal. :::
Conclusion
Understanding the dynamic relationship between indicators and price action is crucial for developing a robust trading methodology.
- Price action offers direct insight into supply, demand, and market psychology, showing you what the market is doing in real-time. It should form the foundation of your analysis, identifying potential setups with its raw signals like candlestick patterns, support/resistance, and market structure.
- Indicators, when used wisely, serve as powerful tools for confirmation, filtering, and contextualization. They can provide objective measures of trend strength, momentum, and volatility, adding conviction to your price action-derived theses or helping you filter out lower-probability trades.
The key is to avoid over-complication and never allow indicators to dictate your trades blindly. Instead, let them augment your understanding of what the price itself is telling you. By mastering the art of combining the leading signals of price action with the confirming power of carefully selected indicators, you can build a more informed, disciplined, and ultimately, more profitable trading strategy.
:::tip Practice Makes Perfect: The best way to learn how to effectively combine indicators and price action is through extensive practice. Spend time analyzing historical charts, identifying price action setups, and then observing how chosen indicators confirm or contradict these setups. Journal your findings and refine your approach consistently. TradingView and other charting platforms offer powerful tools for this backtesting and analysis. :::