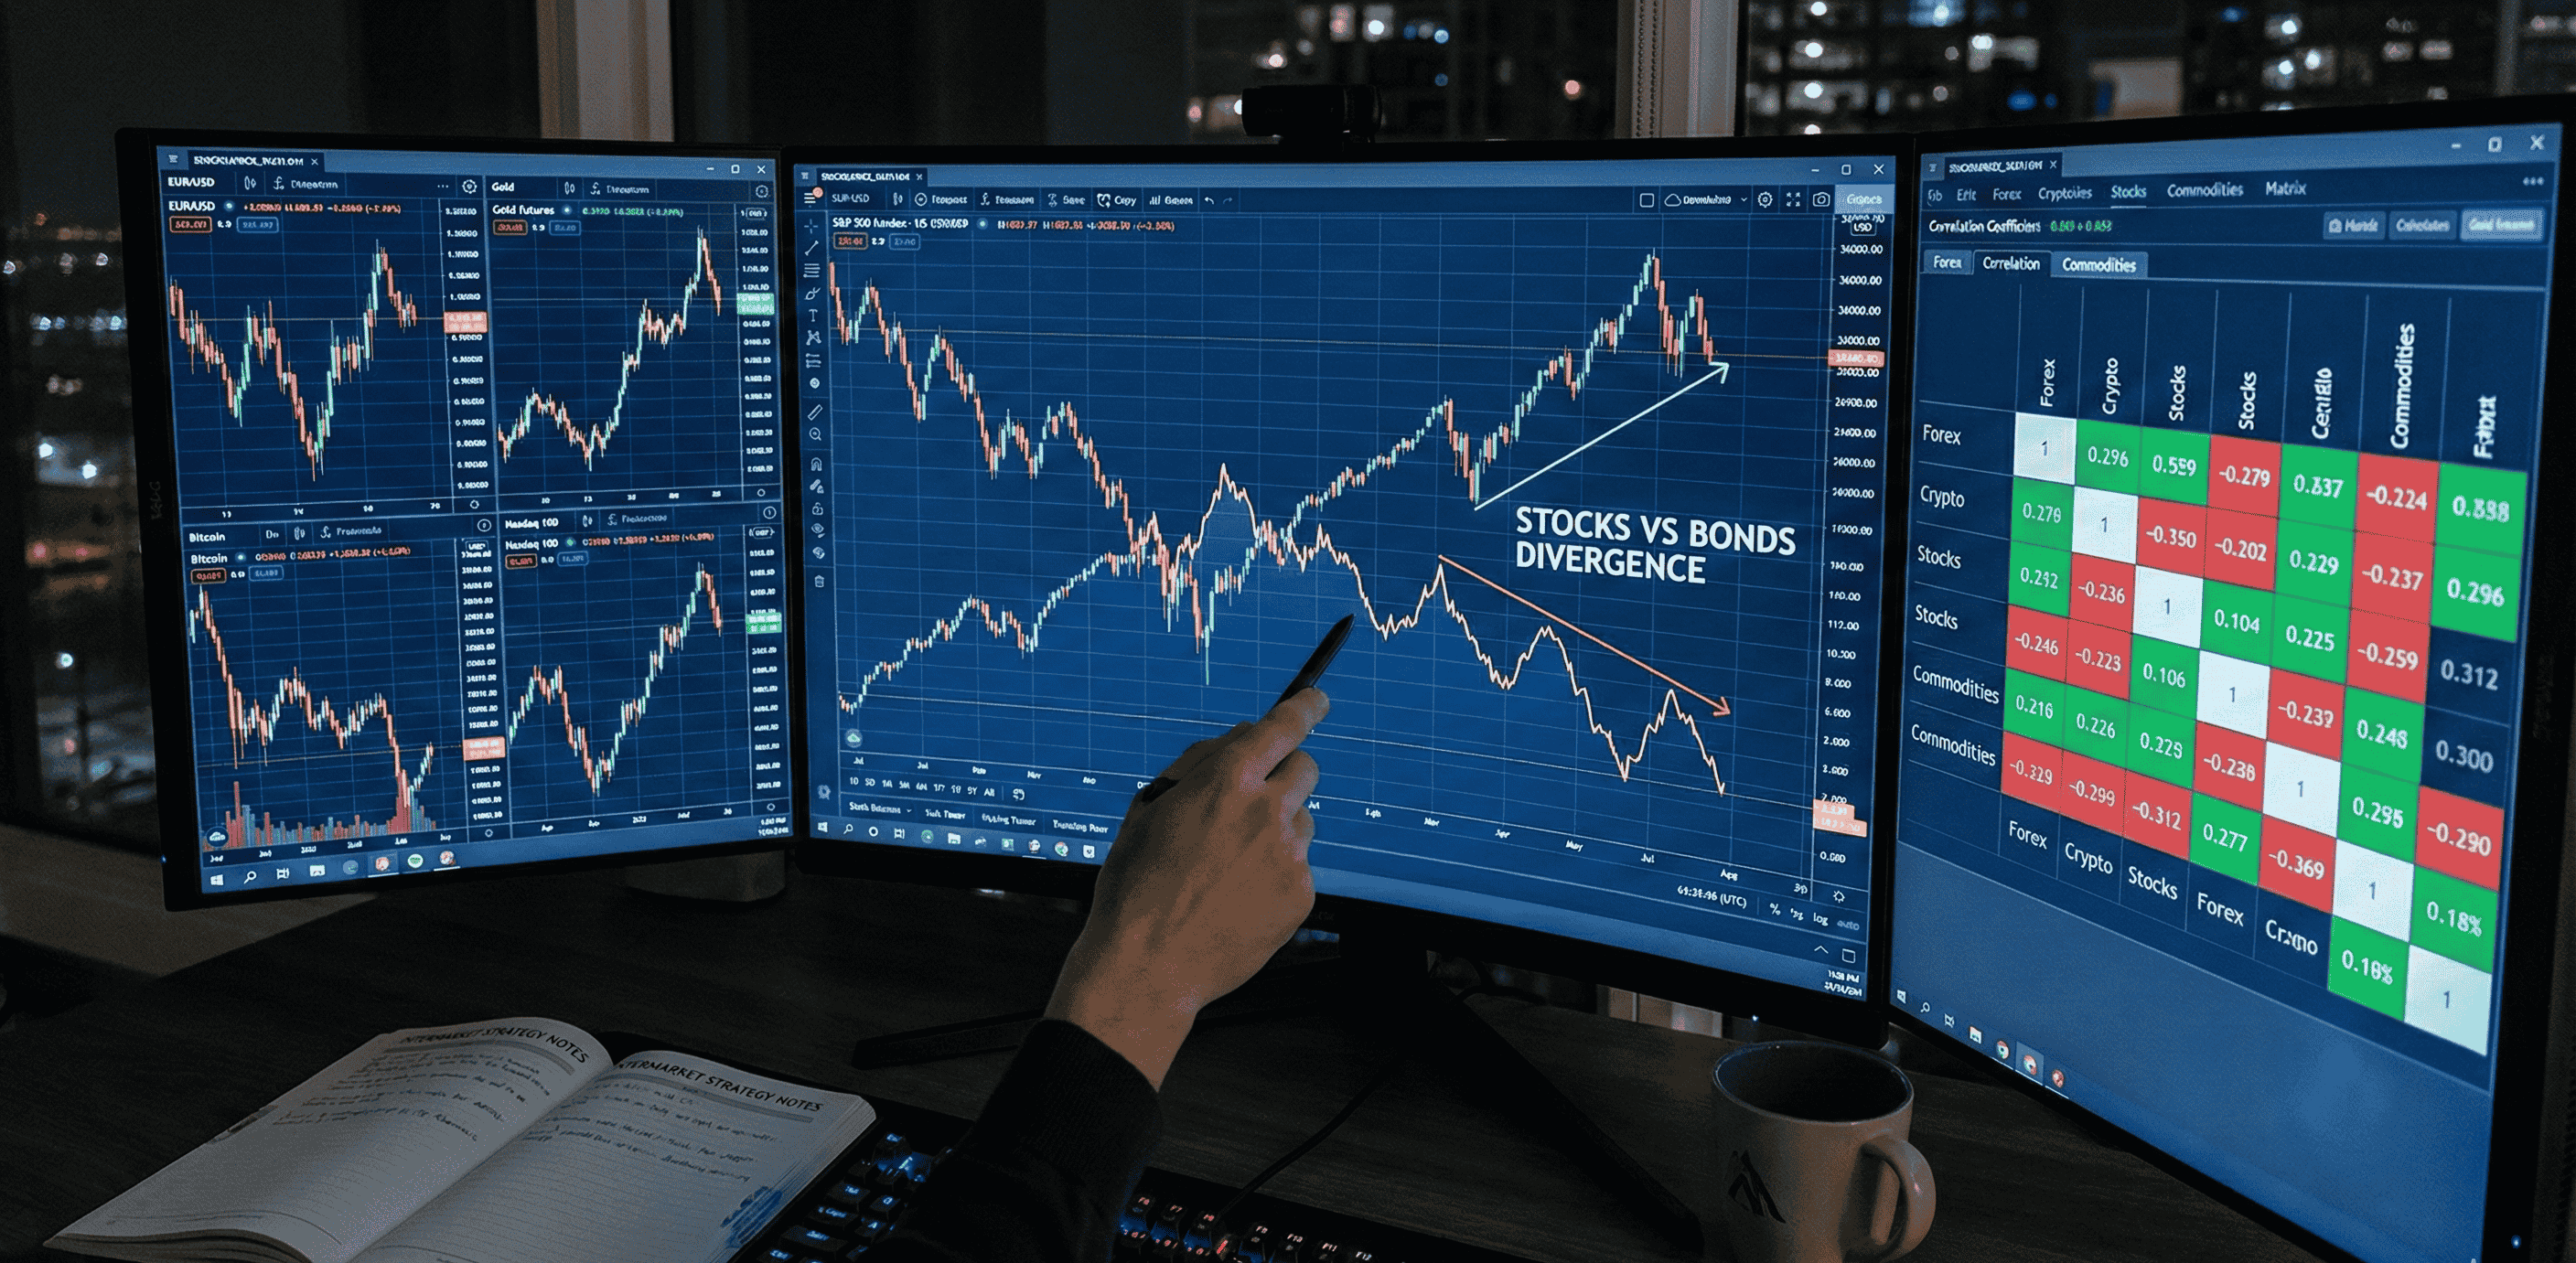
# Intermarket Analysis for Traders: Unlocking Edge in Forex, Crypto, Stocks & Indices
Intermarket analysis is an indispensable tool for the discerning trader, offering a panoramic view of financial markets that often eludes those focused solely on a single asset class. In an increasingly interconnected global economy, the days of isolating markets are long gone. The interplay between Forex, cryptocurrencies, equities, and indices creates a complex web of relationships, where movements in one often presage or confirm trends in another. This guide delves into the advanced concepts of intermarket analysis, equipping experienced traders with the knowledge to identify these correlations, understand their underlying drivers, and leverage them for a significant trading edge.
By understanding how capital flows between different asset classes, and how macroeconomic factors ripple across markets, traders can develop a more robust and adaptive trading strategy. We will explore the theoretical underpinnings of these relationships and, more crucially, provide actionable methods for integrating intermarket insights into your daily trading decisions.
Table of Contents
- [The Foundation of Intermarket Relationships](#the-foundation-of-intermarket-relationships)
- [Key Intermarket Correlations Explained](#key-intermarket-correlations-explained)
- [Practical Application: Integrating Intermarket Analysis into Trading](#practical-application-integrating-intermarket-analysis-into-trading)
- [Advanced Strategies and Nuances](#advanced-strategies-and-nuances)
- [Conclusion: Mastering the Global Market Tapestry](#conclusion-mastering-the-global-market-tapestry)
---
The Foundation of Intermarket Relationships
At its core, intermarket analysis recognizes that financial markets do not exist in isolation. They are driven by a common set of forces, including global economic conditions, monetary policy, investor sentiment, and capital flows. Understanding these foundational drivers is crucial for interpreting market correlations.
:::key-concept Intermarket Analysis Defined: The study of the relationships between different asset classes to gain insights into overall market trends and identify potential trading opportunities. It’s based on the premise that markets influence each other and rarely move independently. :::
Economic Cycles and Asset Class Performance
Different asset classes tend to perform better or worse depending on the stage of the economic cycle. For instance:
- Expansionary Periods: Typically see strong equity markets, often accompanied by rising commodity prices as demand increases. Bond yields may rise as inflation expectations grow, and central banks consider tightening monetary policy. Currencies of growth-oriented economies might strengthen.
- Recessionary Periods: Often characterized by falling equity prices, a flight to safety into bonds (driving yields down), and potentially weaker commodity prices. Safe-haven currencies tend to strengthen.
:::example During a strong economic expansion, you might observe the S&P 500 (stocks) making new highs, crude oil (commodity) prices increasing due to higher industrial demand, and AUD/USD (Forex, Australian Dollar often seen as a proxy for commodity prices and global growth) appreciating. Conversely, during a downturn, you might see flows into USD/JPY (safe-haven yen strengthening against riskier dollar) or gold. :::
The Role of Interest Rates and Monetary Policy
Central bank interest rate decisions have a profound impact across all markets. Higher interest rates typically:
- Strengthen a Currency: Making it more attractive to foreign investors seeking higher yields.
- Impact Bonds: Existing bonds with lower coupons become less attractive, leading to price declines and rising yields for new issues.
- Affect Stocks: Higher borrowing costs can damp corporate profits, while future earnings are discounted at a higher rate, potentially leading to lower valuations.
- Influence Commodities: Can impact demand and carrying costs for certain commodities.
:::warning While general correlations exist, their strength and direction can change over time. Economic regimes shift, and what worked in one environment may not hold true in another. Constant re-evaluation is key. :::
Capital Flows and Risk Sentiment
Global capital flows constantly seek the best risk-adjusted returns. When risk sentiment is high, capital tends to flow into:
- Riskier Assets: Equities, emerging market currencies, and certain cryptocurrencies.
When risk sentiment is low (flight to safety), capital flows into:
- Safe-Haven Assets: Gold, JPY, CHF, and sometimes U.S. Treasuries.
These flows create discernible patterns that experienced traders can identify and exploit.
---
Key Intermarket Correlations Explained
While myriad correlations exist, some are more prominent and consistently actionable for traders. Understanding these specific relationships provides a framework for multi-market analysis.
Stocks and Bonds: The Inverse Relationship (Usually)
Historically, stocks and bonds have often exhibited an inverse correlation. When economic prospects brighten, investors shift from safer bonds to riskier stocks, causing bond prices to fall (yields rise) and stock prices to rise. Conversely, during economic uncertainty, a flight to safety sees money move from stocks into bonds.
However, it's crucial to note that this correlation can break down during periods of extreme market stress or specific monetary policy regimes (e.g., quantitative easing).
:::tip Monitor the Stock/Bond Ratio (e.g., S&P 500 / 10-Year U.S. Treasury Futures). A rising ratio suggests risk-on sentiment and potentially higher stock prices, while a falling ratio indicates risk-off. :::
Commodities and Currencies: The Commodity Currencies
Certain national currencies are highly sensitive to commodity prices, earning them the moniker
"commodity currencies." These are typically currencies of countries whose economies are heavily reliant on commodity exports.
:::key-concept Commodity Currencies:
:::
- CAD (Canadian Dollar): Strongly correlated with crude oil prices due to Canada's significant oil exports.
- AUD (Australian Dollar): Influenced by iron ore, coal, and other base metal prices.
- NZD (New Zealand Dollar): Sensitive to dairy prices, as milk products are a major export.
When commodity prices rise, demand for the associated currency increases as foreign buyers need to purchase that currency to pay for the exports. This can lead to currency appreciation. Conversely, falling commodity prices can weaken these currencies.
:::example If crude oil prices are surging, a forex trader might look for long opportunities in CAD pairs (e.g., USD/CAD short or CAD/JPY long), anticipating that the Canadian dollar will strengthen as oil revenues increase. :::
Forex and Stocks: Risk-On/Risk-Off Dynamics
- Risk-On Environment: When investors are optimistic about global growth and willing to take on more risk, capital tends to flow into:
- Higher-yielding currencies: Such as AUD, NZD, and sometimes high-beta emerging market currencies.
- Global equities: Pushing stock markets higher.
- JYP and CHF weaken: As their safe-haven appeal diminishes.
- Risk-Off Environment: During periods of economic uncertainty, geopolitical tension, or market volatility, investors seek safety, leading to:
- Strengthening JPY and CHF: As safe havens.
- Weakening risk currencies: AUD, NZD, etc.
- Falling global equities: As investors liquidate riskier assets.
Understanding these risk sentiment flows is crucial for trading both forex and stock indices.
Cryptocurrencies and the Broader Market
The correlation of cryptocurrencies, particularly Bitcoin, with traditional assets has evolved.
- Early Days: Bitcoin was often seen as an uncorrelated asset, a hedge against traditional financial systems.
- Increased Institutional Adoption: As more institutional money entered crypto, its correlation with risk assets (like tech stocks/indices such as the Nasdaq 100) has often increased. During risk-off periods, crypto can fall alongside stocks, suggesting it's being treated as another speculative asset.
- Inflation Hedge Debate: Some argue Bitcoin acts as a digital gold, an inflation hedge. Its performance during inflationary periods has been mixed, sometimes correlating with gold, sometimes with growth stocks.
:::tip Pay attention to Bitcoin's behavior during significant equity market moves. A high positive correlation with indices like the S&P 500 or Nasdaq 100 indicates it's being treated as a risk asset. A divergence could signal a change in market perception or an independent crypto-specific driver. :::
Implementing Intermarket Analysis in Your Trading
Intermarket analysis isn't a standalone trading system; it's a powerful framework for enhancing your existing strategies.
1. Confirming Trends and Reversals
Use intermarket relationships to confirm signals generated by your primary analysis.
:::example
:::
- You see a bullish technical pattern on the S&P 500 (stocks). If the Stock/Bond ratio is also rising and safe-haven currencies like JPY are weakening, it provides strong intermarket confirmation for a long stock position.
- Conversely, if AUD/USD (commodity currency) is showing bearish divergence while copper prices (a leading economic indicator) are also falling, it could confirm a bearish outlook for Australian equities.
2. Identifying Leading Indicators
Some markets tend to lead others in reflecting economic shifts.
- Bonds often lead Stocks: Changes in bond yields (especially the yield curve) can signal future economic growth or contraction before it's fully reflected in equities.
- Commodities can lead Currencies/Stocks: Rising industrial commodity prices can signal increased demand and economic expansion, potentially leading commodity currencies and boosting cyclical stocks.
3. Understanding Divergences
Divergences between correlated markets can be powerful warning signs or early indications of trend changes.
:::warning A breakdown in a strong, established intermarket correlation should always attract attention. It might indicate a fundamental shift in market dynamics or an impending trend reversal in one or both assets. :::
:::example If the S&P 500 is making new highs, but economically sensitive commodities (like copper) are failing to follow suit, this divergence could signal weakening economic fundamentals and a potential top for equities. :::
4. Enhancing Risk Management
By understanding how different assets correlate, you can:
- Diversify your portfolio effectively: By including assets with low or negative correlations.
- Anticipate market-wide moves: And adjust your exposure accordingly. For instance, if you anticipate a "flight to safety," you might reduce exposure to risk assets and potentially allocate to safe havens.
Conclusion: The Holistic Trader's Advantage
Intermarket analysis transforms a trader's perspective from a narrow focus on a single asset to a panoramic view of the entire financial ecosystem. By understanding the intricate dance between forex, crypto, stocks, and indices, you gain a significant edge:
- Deeper Context: You move beyond price charts, understanding the underlying macroeconomic forces and capital flows driving those prices.
- Enhanced Signal Confirmation: Intermarket analysis acts as a powerful filter, confirming strong signals and weeding out weaker ones.
- Early Warning System: Divergences and leading indicators provide crucial early warnings of potential trend changes or market stress.
- Improved Risk Management: A holistic view allows for more informed portfolio diversification and proactive risk adjustments.
Mastering intermarket analysis is not about predicting the future with perfect accuracy, but about reading the story the markets are telling. It's about recognizing patterns, understanding economic cause and effect, and identifying opportunities before they become obvious to the masses.
:::tip Practice Makes Perfect: Don't just read about these correlations; actively observe them on your charts.
TradingAnalysis.ai provides excellent tools for multi-chart layouts and historical data analysis to facilitate this practice. Begin integrating intermarket analysis into your daily routine, and watch your market understanding (and potentially your trading performance) reach new heights. :::
- Open charts for the S&P 500, 10-year Treasury yields, EUR/USD, Gold, Crude Oil, and Bitcoin side-by-side.
- Look for periods where they trend together, diverge, or show leading/lagging relationships.
- Over time, you'll develop an intuitive feel for these critical connections.