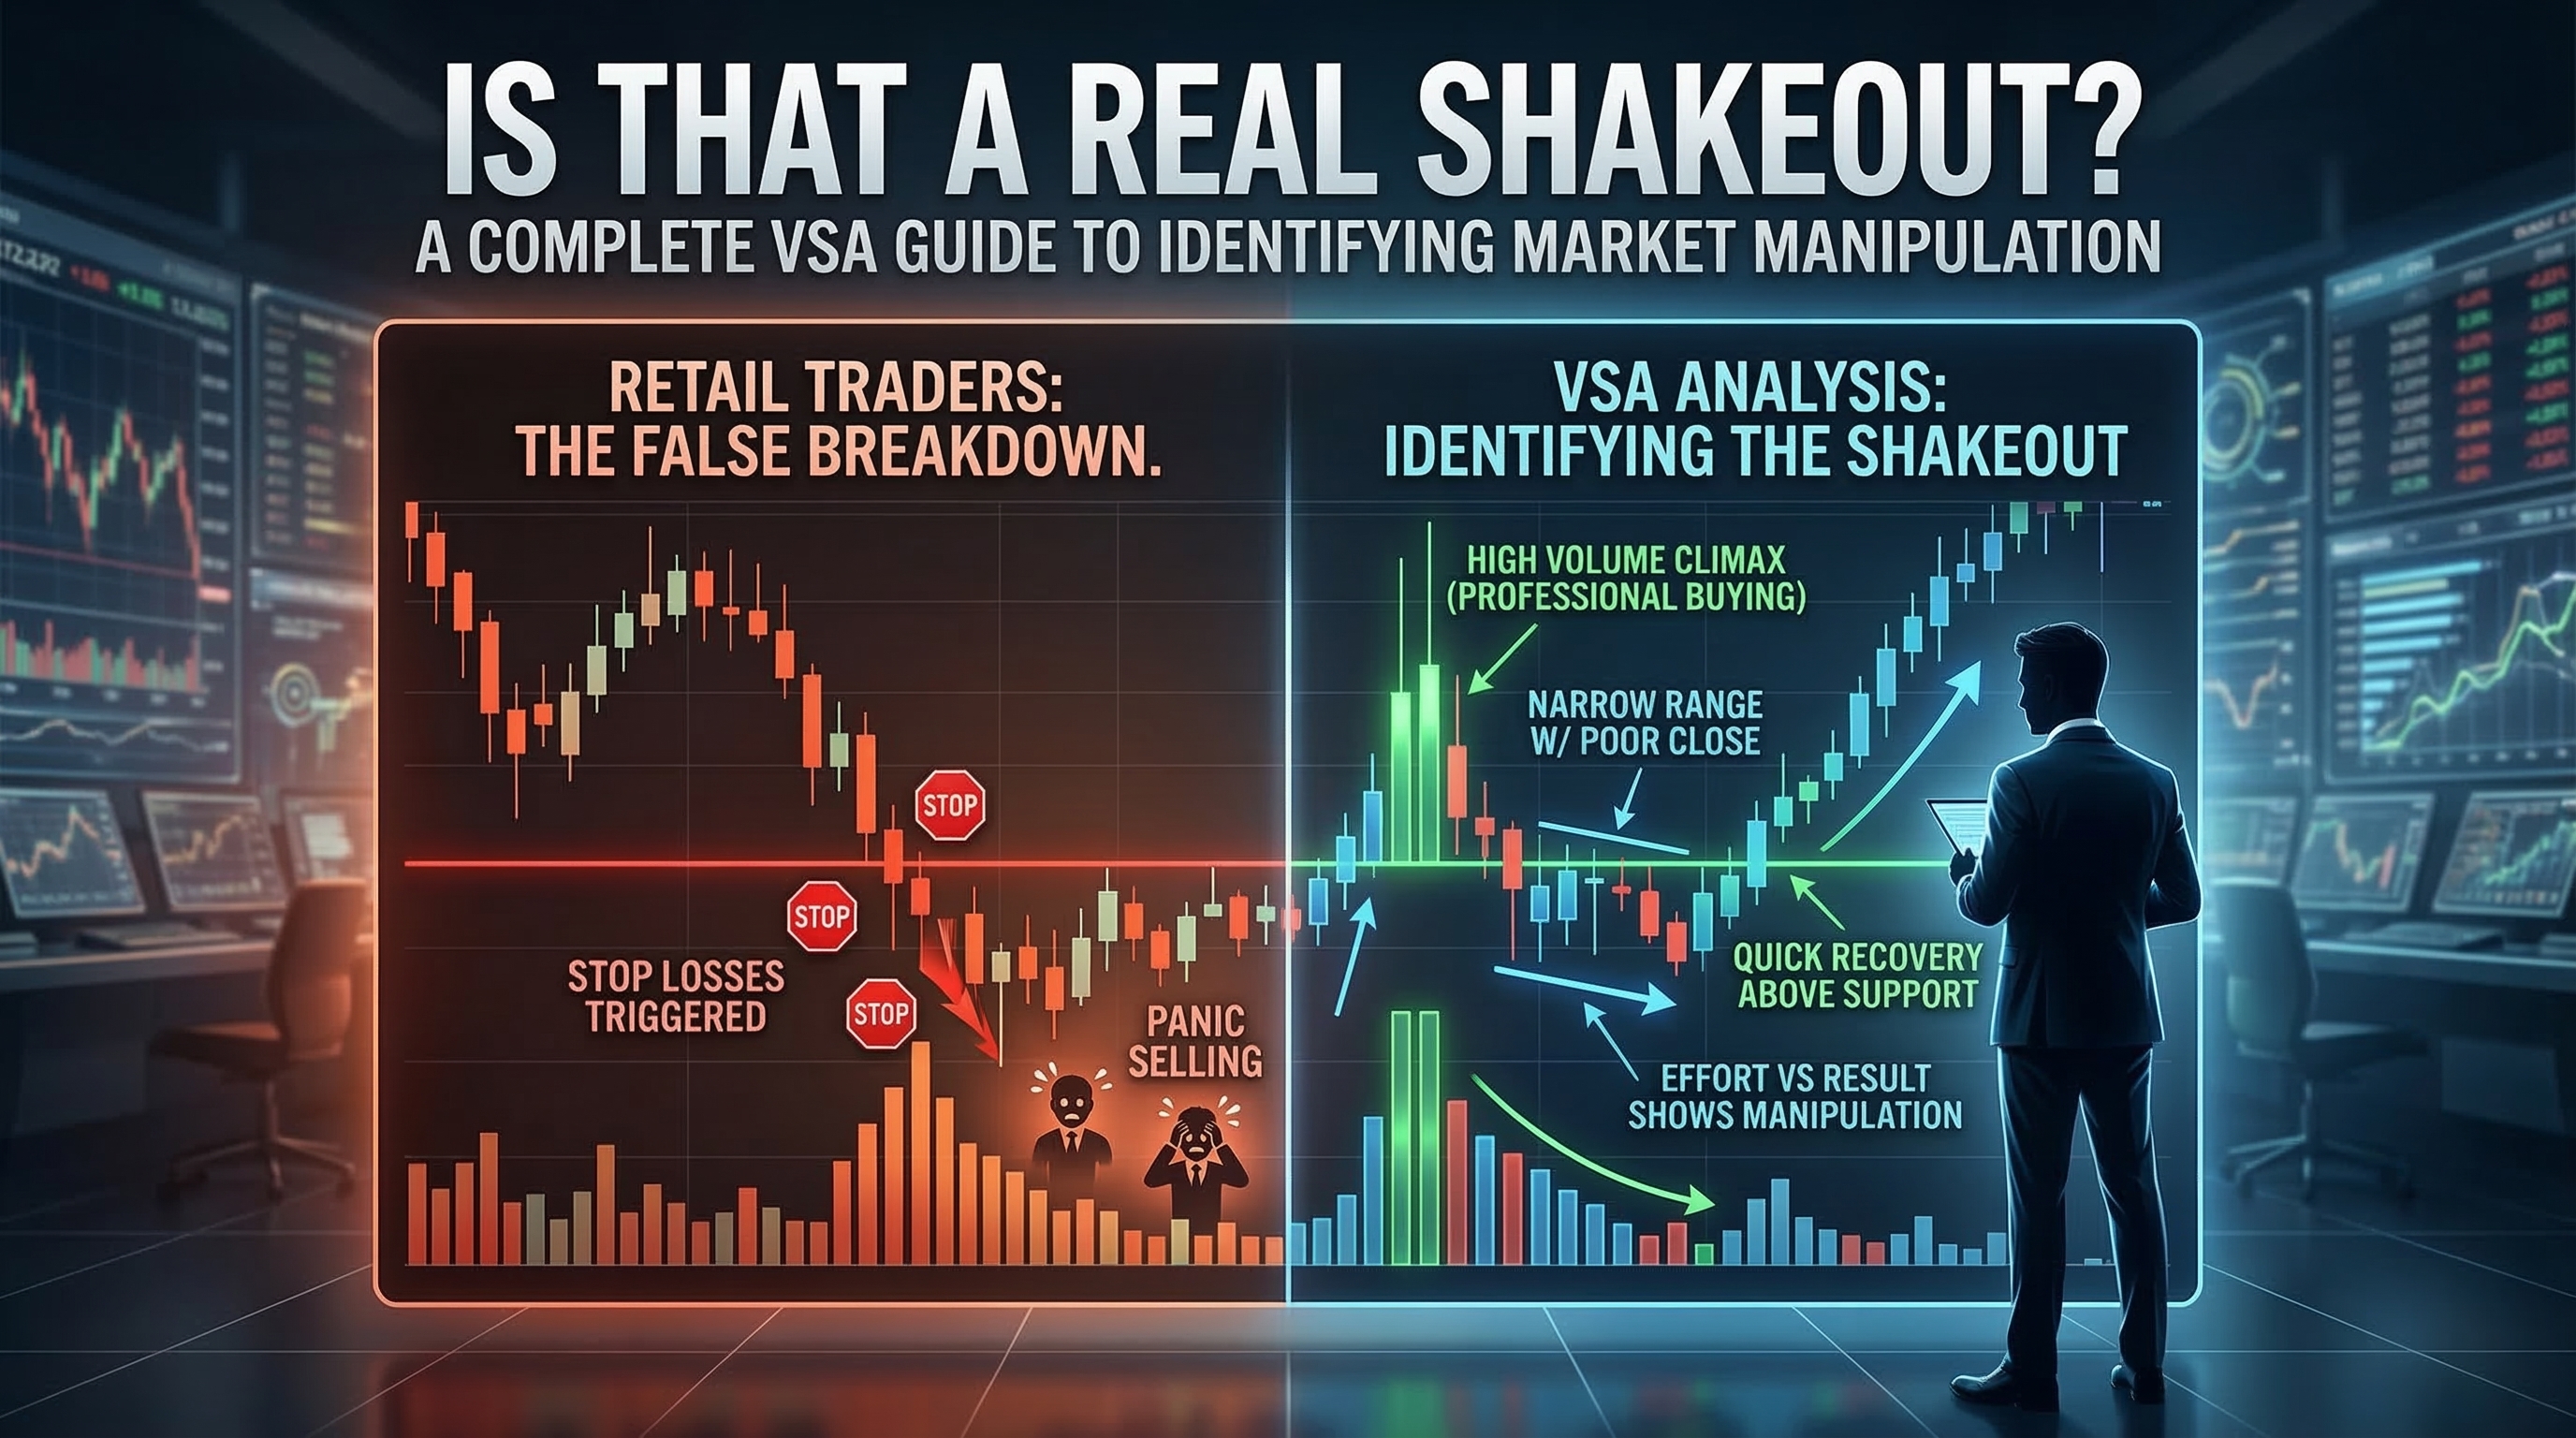
# Is That a Real Shakeout? A Complete VSA Guide to Identifying Market Manipulation
Market manipulation is a constant reality in trading, and one of the most deceptive tactics employed by professional money is the shakeout. These false breakdowns can trap retail traders in losing positions while smart money accumulates shares at discounted prices. Volume Spread Analysis (VSA) provides the tools to identify these manipulative moves before they fool you.
Understanding how to spot a genuine VSA shakeout pattern is crucial for any serious trader. This comprehensive guide will teach you the key characteristics, warning signs, and practical techniques to distinguish real shakeouts from normal market corrections, helping you avoid costly mistakes and potentially profit from these manipulative moves.
Table of Contents
- [Understanding VSA Shakeouts](#understanding-vsa-shakeouts)
- [Anatomy of a VSA Shakeout Pattern](#anatomy-of-a-vsa-shakeout-pattern)
- [Key Indicators and Warning Signs](#key-indicators-and-warning-signs)
- [False Shakeouts vs Real Breakdowns](#false-shakeouts-vs-real-breakdowns)
- [Trading Strategies for Shakeout Patterns](#trading-strategies-for-shakeout-patterns)
- [Practical Analysis Examples](#practical-analysis-examples)
- [Conclusion](#conclusion)
Understanding VSA Shakeouts
:::key-concept A VSA shakeout is a deliberate manipulation tactic where professional money creates artificial selling pressure to trigger stop losses and panic selling, allowing them to accumulate positions at better prices before the real move begins. :::
Shakeouts are essentially fake breakdowns designed to test the market's resolve and flush out weak hands. They typically occur at key support levels where retail traders place their stop losses, making these areas attractive targets for manipulation.
The psychology behind shakeouts is simple: create fear and uncertainty to induce selling pressure. Professional traders understand that retail traders often place stops just below obvious support levels, making these areas prime targets for a coordinated attack.
Common Characteristics of Shakeouts
- Brief Duration: True shakeouts are typically short-lived, lasting from minutes to a few hours
- Volume Anomalies: Unusual volume patterns that don't align with the price action
- Support Level Targeting: Often occur at obvious technical levels where stops are likely placed
- Quick Recovery: Genuine shakeouts see rapid price recovery back above the breached level
:::warning Not every break below support is a shakeout. Learning to distinguish between genuine weakness and manipulation is crucial for trading success. :::
Anatomy of a VSA Shakeout Pattern
To properly identify a VSA shakeout pattern, you must understand its typical structure and the volume characteristics that accompany each phase.
Phase 1: The Setup
The setup phase involves the establishment of a clear support level that becomes obvious to market participants. This creates a concentration of stop losses just below this level.
Key Features:
- Clear support level formed through multiple tests
- Declining volume on approach to support
- Signs of accumulation or distribution in the background
Phase 2: The Shakeout
This is the manipulation phase where professional money orchestrates the false breakdown.
Volume Analysis:
- High Volume: Often accompanied by increased volume, but this volume should show signs of professional involvement
- Spread Analysis: The price spread (high to low) may be wide, but the closing price typically recovers quickly
- Effort vs Result: High effort (volume) with little result (limited price decline) suggests manipulation
:::example Imagine a stock trading at $50 support. A genuine shakeout might see the price drop to $49.50 on high volume, trigger stops, but then quickly recover back above $50 within the same session or the next day. :::
Phase 3: The Recovery
The recovery phase reveals the true nature of the move.
Confirmation Signs:
- Rapid price recovery back above the breached level
- Volume may decrease as price recovers (less effort needed)
- Professional money begins their real accumulation
Key Indicators and Warning Signs
Identifying a potential VSA shakeout pattern requires careful analysis of several key indicators working in conjunction.
Volume Patterns to Watch
1. Volume Climax on Breakdown
- Sudden spike in volume as price breaks support
- This volume often represents panic selling mixed with professional buying
2. Low Volume Recovery
- Price recovery occurs on lower volume than the breakdown
- Suggests lack of selling pressure once weak hands are shaken out
3. Background Volume Context
- Compare current volume to recent trading sessions
- Look for volume that seems excessive relative to the price movement
Price Action Clues
- Narrow True Range: Despite high volume, the actual price movement may be limited
- Quick Recovery: Genuine shakeouts see rapid price recovery
- Failed Follow-Through: No continued selling pressure after the initial breakdown
:::tip Pay attention to the closing price relative to the day's range. A shakeout often closes in the upper portion of its range despite breaking support earlier. :::
Market Context Factors
- News Environment: Shakeouts often occur during slow news periods when manipulation is easier
- Technical Levels: Target obvious support levels where retail stops are concentrated
- Market Phase: More common during accumulation phases or before significant moves
False Shakeouts vs Real Breakdowns
Distinguishing between a manipulative shakeout and a genuine breakdown is perhaps the most challenging aspect of VSA analysis.
Characteristics of Real Breakdowns
Volume Profile:
- Sustained high volume supporting the breakdown
- Volume continues on subsequent sessions
- No immediate volume climax followed by decline
Price Action:
- Wide spreads with poor closes
- Follow-through selling in subsequent sessions
- No quick recovery back above support
Market Structure:
- Breaks occur with fundamental or technical justification
- Part of a larger bearish pattern or trend
- Accompanied by deteriorating market conditions
Red Flags for Genuine Weakness
:::warning Be cautious of assuming every breakdown is a shakeout. These signs suggest genuine weakness:
:::
- Multiple session breakdown with consistent volume
- Poor closes relative to the daily range
- Breakdown accompanied by negative news or fundamentals
- No attempt at recovery within reasonable timeframe
The Danger of False Assumptions
Traders often fall into the trap of assuming every breakdown is manipulation. This bias can lead to:
- Holding losing positions too long
- Missing genuine trend changes
- Over-reliance on contrarian thinking
Trading Strategies for Shakeout Patterns
Once you've identified a potential VSA shakeout pattern, several trading approaches can help you capitalize on this insight.
Strategy 1: The Bounce Play
This approach involves entering long positions after confirming the shakeout nature of the move.
Entry Criteria:
- Price breaks below support on high volume
- Quick recovery back above the support level
- Volume declining on the recovery
- Entry on break back above support
Risk Management:
- Stop loss below the shakeout low
- Initial target at previous resistance
- Position size based on distance to stop
Strategy 2: The Anticipation Method
:::warning This is an advanced strategy requiring significant experience and should only be attempted by skilled traders. :::
This involves entering positions before the shakeout completes, anticipating the manipulation.
Advanced Signals:
- Volume climax characteristics appearing
- Price action showing signs of absorption
- Professional buying evident in the order flow
Strategy 3: The Confirmation Approach
A more conservative method waiting for full confirmation of the shakeout.
Entry Requirements:
- Complete recovery above support level
- Time passage proving the breakdown was false
- Additional confirmation from other technical indicators
:::example A forex pair breaks below a key support level at 1.2000, dropping to 1.1980 on high volume. Within 4 hours, it recovers back above 1.2000 on lower volume. This quick recovery suggests a shakeout rather than genuine breakdown. :::
Practical Analysis Examples
Understanding the theory is only half the battle. Let's examine how to apply VSA shakeout analysis in practice.
Example 1: Stock Market Shakeout
Consider a technology stock that has been consolidating around $100 support for several weeks:
The Setup:
- Multiple tests of $100 support
- Declining volume on approaches to support
- Obvious level where retail stops would be placed
The Shakeout:
- Price gaps down to $98.50 on earnings disappointment
- Volume spikes to 3x normal levels
- Price recovers to close at $99.80 same day
The Analysis:
- High volume suggests institutional involvement
- Quick recovery indicates lack of genuine selling
- Gap fill attempt shows professional buying
The Outcome:
- Stock recovers above $100 within two days
- Continues higher to $110 over following weeks
Example 2: Commodity Market Manipulation
A precious metals futures contract approaches key support:
Background:
- Gold futures testing $1,800 support
- Previous successful tests with low volume
- Obvious retail positioning below this level
The Event:
- Flash crash to $1,785 during London session
- Massive volume spike lasting 15 minutes
- Recovery to $1,798 within same hour
VSA Analysis:
- Volume far exceeds normal trading patterns
- Recovery speed indicates professional buying
- Timing during low retail participation suggests manipulation
:::key-concept The key to successful VSA shakeout analysis is understanding that volume tells the real story behind price movements. Always analyze volume in context with price action and market structure. :::
Pattern Recognition Tips
1. Context is King: Always consider the broader market environment 2. Volume First: Let volume guide your analysis, not just price 3. Time Element: Consider the timeframe of the breakdown and recovery 4. Multiple Confirmations: Don't rely on a single indicator
Common Mistakes to Avoid
- Over-analyzing: Not every price move is manipulation
- Ignoring Fundamentals: Technical analysis works best with fundamental context
- Poor Risk Management: Even correct analysis can result in losses without proper risk control
- Emotional Trading: Sticking to your analysis plan regardless of short-term noise
Conclusion
Mastering the identification of VSA shakeout patterns is a valuable skill that can significantly improve your trading results. By understanding the mechanics of market manipulation and learning to read the volume signatures that accompany these moves, you can avoid costly traps and potentially profit from the deception of others.
Remember that the VSA shakeout pattern is just one tool in your trading arsenal. It works best when combined with proper risk management, sound money management principles, and a deep understanding of market structure. Not every breakdown below support is a shakeout, and not every shakeout presents a profitable trading opportunity.
The key principles to remember are:
- Volume analysis is crucial for identifying manipulation
- Quick recovery after breakdown suggests shakeout activity
- Context matters more than individual signals
- Risk management is essential regardless of setup quality
As you develop your skills in VSA analysis, practice identifying these patterns on historical charts before risking real money. Build your pattern recognition abilities and develop the confidence to act when you spot genuine manipulation.
Start applying these VSA shakeout concepts to your chart analysis today. Begin with paper trading to test your pattern recognition skills, then gradually incorporate these insights into your live trading strategy. Remember, becoming proficient at spotting market manipulation takes time and practice, but the edge it provides is well worth the effort.