# Liquidity Heatmaps & Order Flow: What Retail Traders Misunderstand
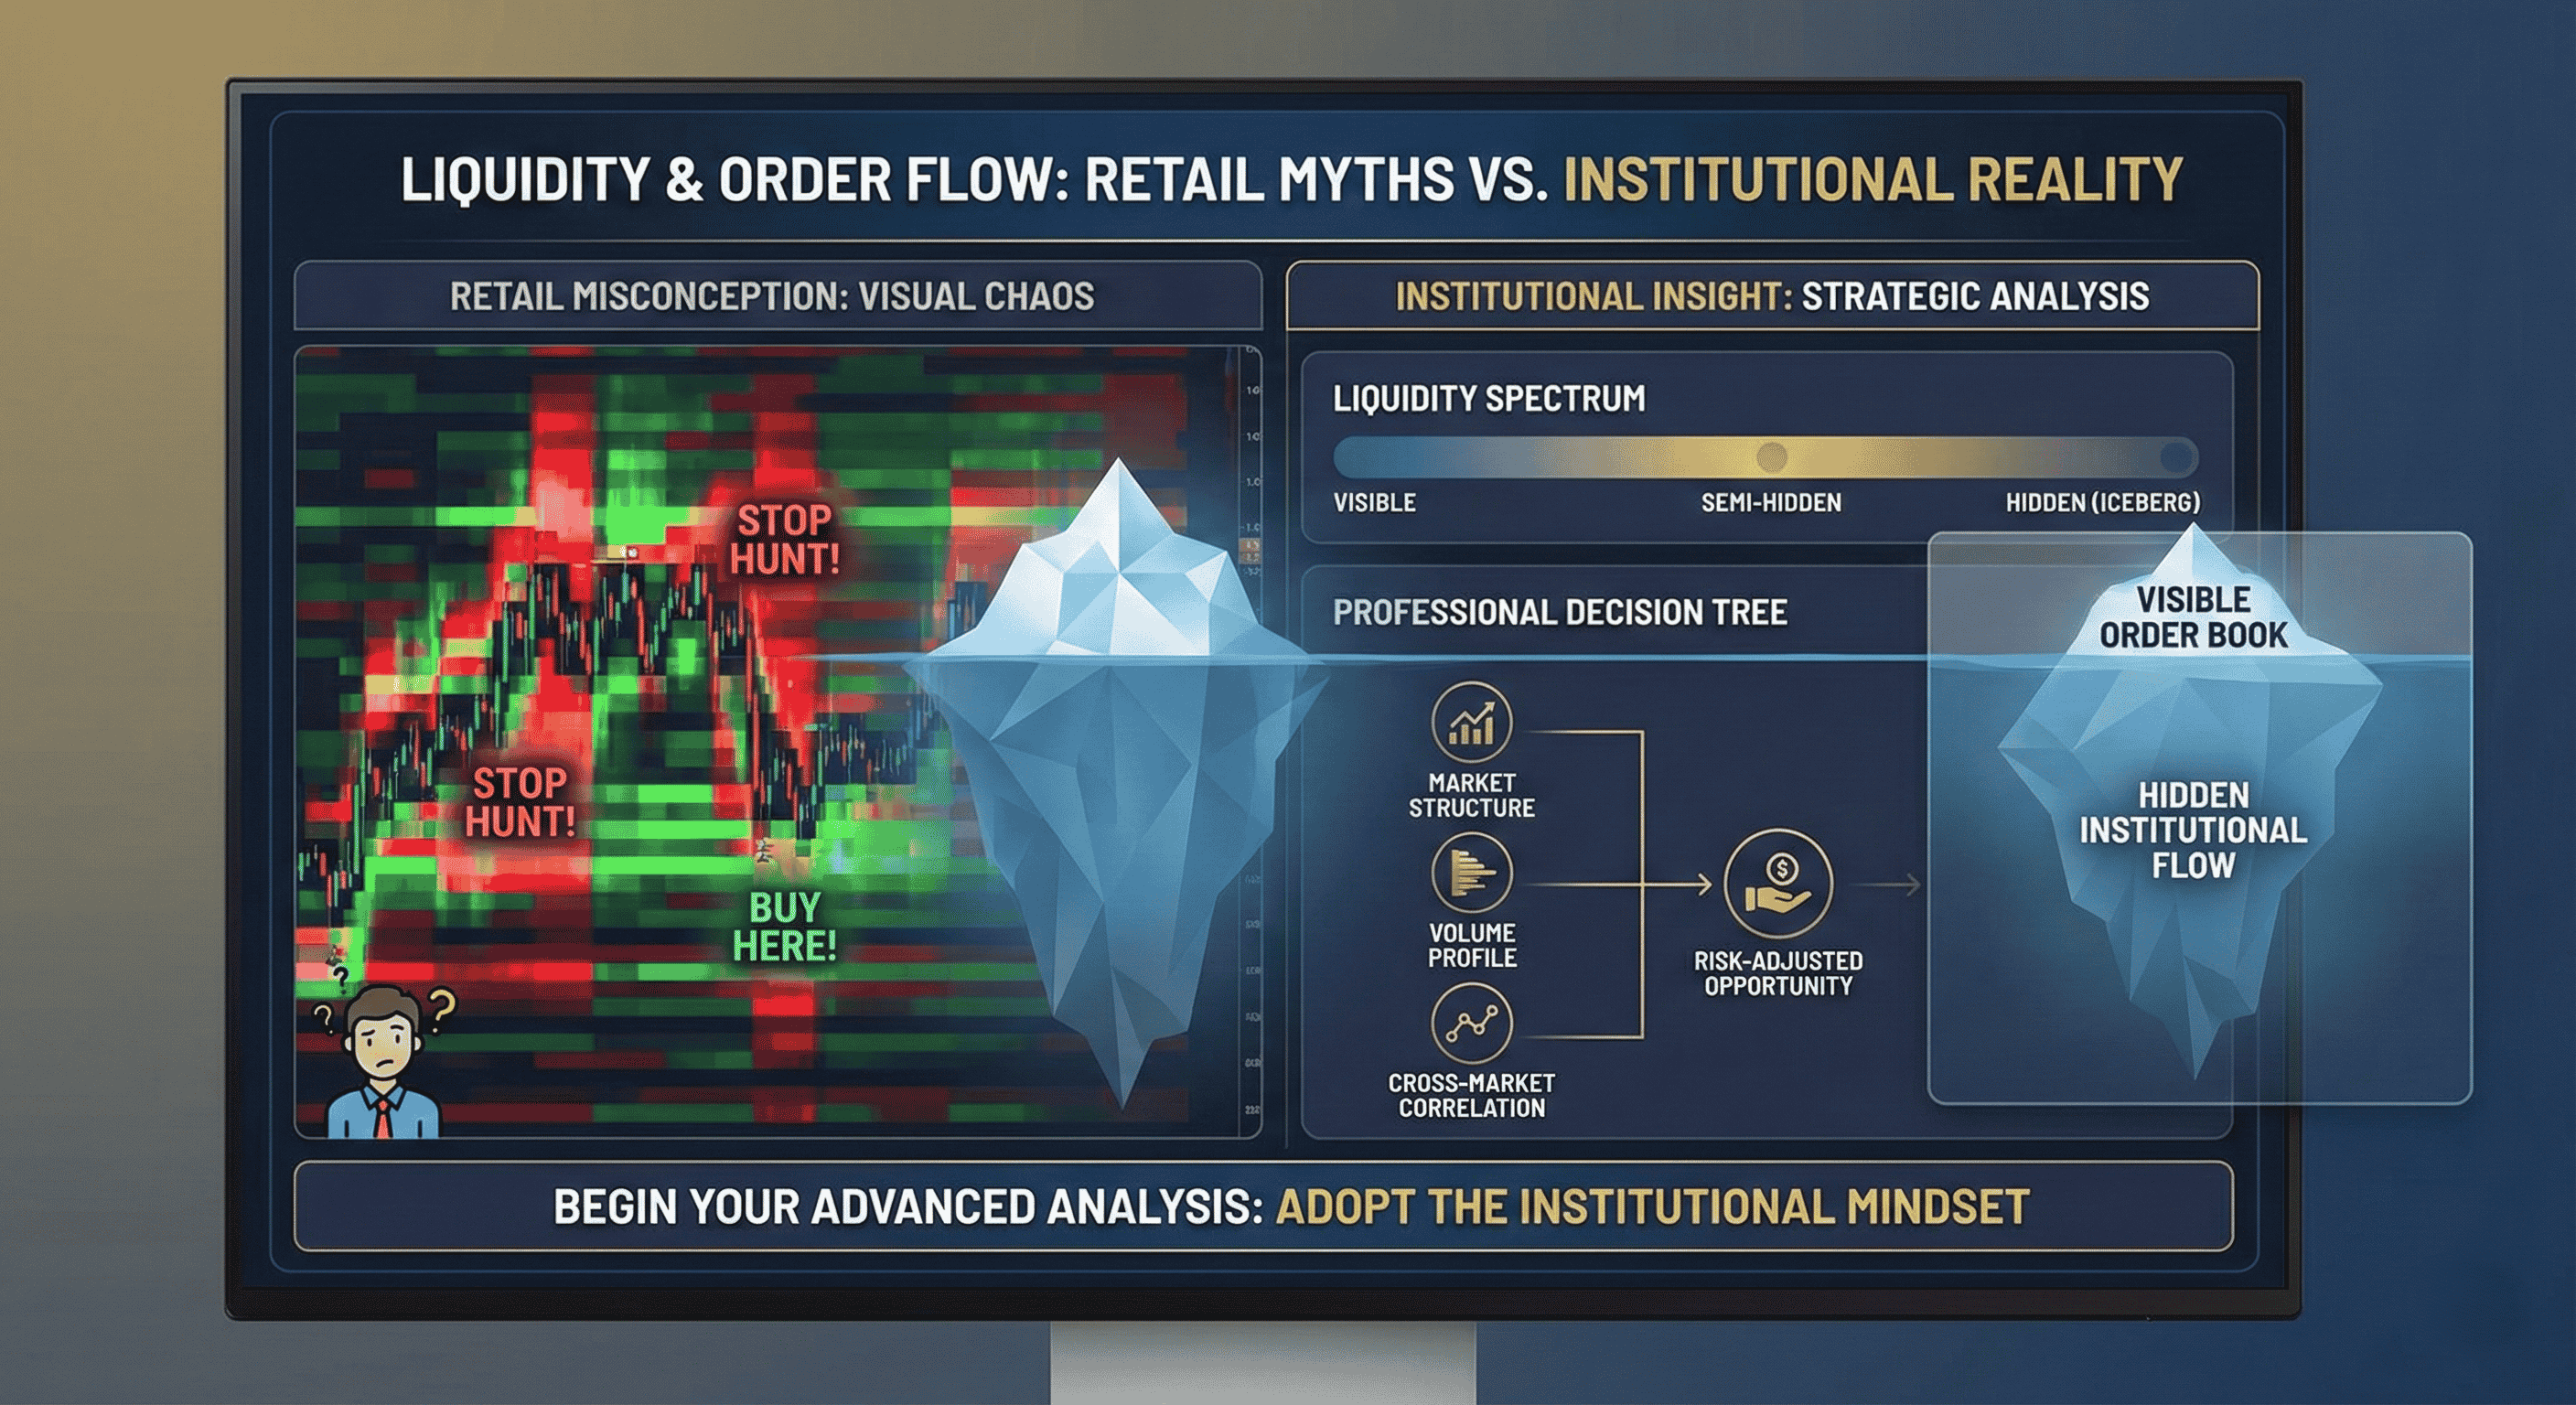
Most retail traders approach liquidity heatmaps and order flow analysis with a fundamental misunderstanding of what they're actually observing. They see colorful visualizations and assume they're gaining an edge over the market, when in reality they're often misinterpreting the very data that could provide genuine institutional insights.
This comprehensive guide reveals the critical misconceptions retail traders have about liquidity and order flow, and provides professional-level frameworks for properly interpreting these powerful analytical tools. Understanding these concepts isn't just about reading pretty charts – it's about developing the institutional mindset necessary to trade alongside smart money rather than against it.
Table of Contents
- [The Fundamental Misconceptions](#the-fundamental-misconceptions)
- [Understanding True Liquidity Concepts](#understanding-true-liquidity-concepts)
- [Order Flow Reality vs. Retail Perception](#order-flow-reality-vs-retail-perception)
- [Professional Liquidity Analysis Framework](#professional-liquidity-analysis-framework)
- [Advanced Implementation Strategies](#advanced-implementation-strategies)
- [Common Pitfalls and Solutions](#common-pitfalls-and-solutions)
The Fundamental Misconceptions
Liquidity Is Not Just Visual Clusters
The first major misconception retail traders have is treating liquidity heatmaps as simple "red means sell, green means buy" indicators. Professional traders understand that liquidity visualization tools show potential areas of interest, not trade signals.
:::warning Liquidity heatmaps show WHERE orders might be resting, not WHEN they'll be triggered or HOW price will react when they are triggered. :::
Retail traders typically focus on:
- Bright colors indicating "high liquidity"
- Obvious support and resistance clusters
- Recent price action imprints
Institutional traders focus on:
- Liquidity efficiency and market maker positioning
- Historical liquidity patterns and their evolution
- The relationship between visible and hidden liquidity
The Stop Hunt Mythology
Another pervasive misconception is the oversimplified "stop hunt" narrative. Retail traders see price move toward liquidity clusters and immediately assume malicious manipulation. This perspective misses the nuanced reality of how institutional order flow actually works.
:::key-concept Institutional traders don't "hunt stops" for sport – they seek liquidity for efficient position building and unwinding. The apparent "hunting" is often just efficient market making. :::
Time Frame Misalignment
Retail traders frequently analyze liquidity on inappropriate time frames. They'll use 5-minute heatmaps to make daily trading decisions or apply intraday liquidity concepts to swing trading strategies.
Professional Approach:
- Intraday scalpers: 1-5 minute order flow with 15-minute liquidity context
- Day traders: 15-minute to 1-hour liquidity with 4-hour structural context
- Swing traders: 4-hour to daily liquidity with weekly structural framework
Understanding True Liquidity Concepts
The Liquidity Spectrum
Professional liquidity analysis operates on a spectrum rather than binary high/low classifications. Understanding this spectrum is crucial for proper interpretation.
Visible Liquidity:
- Obvious support/resistance levels
- Round numbers and psychological levels
- Previous day/week/month highs and lows
- Technical analysis-based levels
Semi-Hidden Liquidity:
- Institutional order clusters
- Algorithmic placement zones
- Cross-asset correlation levels
- Options-related strikes and expirations
Hidden Liquidity:
- Iceberg orders
- Dark pool activity
- Central bank intervention levels
- Macro-economic positioning
:::example Consider EUR/USD approaching 1.1000. Retail sees an obvious round number. Professionals see: option expiry clustering, historical central bank commentary levels, pension fund rebalancing thresholds, and carry trade unwinding points – all layered at the same level. :::
Liquidity Quality Assessment
Not all liquidity is created equal. Professional traders assess liquidity quality through multiple dimensions:
Volume Characteristics:
- Organic vs. algorithmic volume
- Directional bias in volume distribution
- Volume-at-price historical significance
Time Characteristics:
- Session-specific liquidity patterns
- Economic calendar proximity effects
- Market microstructure timing
Market Structure Context:
- Trend vs. range-bound liquidity behavior
- Multi-timeframe confluence assessment
- Cross-market liquidity correlation
The Liquidity Lifecycle
Understanding how liquidity evolves is crucial for professional analysis:
1. Formation Phase: Liquidity accumulates at key levels 2. Testing Phase: Price probes liquidity zones 3. Absorption Phase: Orders are filled and liquidity consumed 4. Void Phase: Temporary liquidity shortage creates volatility 5. Reformation Phase: New liquidity establishes at different levels
Order Flow Reality vs. Retail Perception
What Order Flow Actually Reveals
Retail traders often mistake order flow for a crystal ball that predicts price direction. The reality is more nuanced and requires deeper analytical frameworks.
:::key-concept Order flow shows the process of price discovery, not price prediction. It reveals HOW price moves, not WHERE price will move. :::
Order Flow Components Professional Traders Monitor:
- Bid/Ask dynamics and spread behavior
- Large lot transaction patterns
- Aggressive vs. passive order characteristics
- Volume-weighted average price relationships
- Market maker vs. institutional flow signatures
Reading Institutional Footprints
Professional order flow analysis focuses on identifying institutional characteristics rather than predicting immediate price movements.
Accumulation Signatures:
- Consistent absorption at key levels
- Volume clustering without significant price movement
- Spread compression during volume spikes
- Cross-session position building patterns
Distribution Signatures:
- Increased volume on rallies with declining momentum
- Spread widening during apparent strength
- Unusual size transactions at resistance levels
- Cross-market hedging activity
:::example During a seemingly bullish move in AAPL, order flow shows large lots hitting every bid on the way up, while the bid-ask spread widens from 1 cent to 3 cents. This suggests distribution, not accumulation, despite the rising price. :::
The Iceberg Effect
One of the most misunderstood aspects of order flow is the presence of hidden orders. Retail traders see the visible order book and assume they're seeing the complete picture.
Iceberg Order Characteristics:
- Consistent refilling at specific price levels
- Large volume absorption without visible size
- Unusual price stability during high volume periods
- Repetitive order patterns with similar sizing
Professional Liquidity Analysis Framework
Multi-Dimensional Analysis Approach
Professional liquidity analysis requires systematic evaluation across multiple dimensions simultaneously.
Dimension 1: Structural Context
- Primary trend alignment
- Key level proximity and significance
- Multi-timeframe confluence assessment
- Market phase identification (trending/ranging)
Dimension 2: Volume Profile Integration
- Volume-at-price distribution analysis
- Point of control identification and evolution
- Value area development and migration
- Volume profile shape interpretation
Dimension 3: Time and Sales Analysis
- Print size distribution patterns
- Aggressive vs. passive order ratios
- Trade velocity and acceleration patterns
- Block trade identification and timing
Dimension 4: Cross-Market Correlation
- Related market liquidity alignment
- Currency correlation impacts (for FX)
- Sector rotation effects (for equities)
- Commodity-currency relationships
The Professional Decision Tree
When analyzing liquidity and order flow, professionals use systematic decision trees rather than intuitive reactions.
:::tip Step 1: Identify current market structure and primary liquidity zones Step 2: Assess order flow characteristics relative to structural levels Step 3: Evaluate cross-timeframe and cross-market confirmation Step 4: Determine institutional positioning probability Step 5: Calculate risk-adjusted opportunity assessment :::
Quantitative Liquidity Metrics
Professional analysis incorporates quantitative measurements rather than relying solely on visual interpretation.
Key Metrics:
- Liquidity-to-volatility ratios
- Volume-weighted average price deviations
- Bid-ask spread percentile rankings
- Order flow imbalance coefficients
- Cross-session liquidity persistence rates
Advanced Implementation Strategies
Session-Based Liquidity Mapping
Different trading sessions provide distinct liquidity characteristics that professional traders systematically exploit.
Asian Session Characteristics:
- Lower overall liquidity with range-bound tendencies
- Central bank intervention sensitivity
- Carry trade positioning influences
- Thin conditions amplify technical levels
London Session Characteristics:
- High liquidity with trend development potential
- ECB policy sensitivity
- Banking sector flow concentration
- Cross-currency arbitrage opportunities
New York Session Characteristics:
- Maximum liquidity with institutional participation
- Fed policy and economic data sensitivity
- Corporate flow concentration
- End-of-day positioning adjustments
Liquidity-Based Position Sizing
Professional traders adjust position sizes based on liquidity assessment rather than using fixed sizing approaches.
:::example Trading EUR/USD during London session with high liquidity: Standard position sizing Trading AUD/JPY during Asian session with thin liquidity: Reduce position size by 50-70% Trading during major news events: Further reduce or avoid entirely :::
Position Sizing Framework: 1. Assess current liquidity percentile ranking 2. Evaluate expected liquidity during trade duration 3. Calculate maximum adverse excursion probability 4. Adjust position size inversely to liquidity risk 5. Implement dynamic sizing based on real-time conditions
Advanced Entry and Exit Techniques
Professional liquidity-based trading requires sophisticated entry and exit methodologies.
Liquidity-Seeking Entries:
- Enter during liquidity absorption phases
- Use limit orders at institutional accumulation zones
- Scale into positions during controlled distribution
- Avoid entries during liquidity void periods
Liquidity-Aware Exits:
- Exit before anticipated liquidity reduction
- Use approaching liquidity zones for profit taking
- Scale out during institutional distribution phases
- Maintain positions through temporary liquidity droughts
Common Pitfalls and Solutions
Pitfall 1: Over-Reliance on Visual Indicators
Problem: Retail traders become mesmerized by colorful heatmaps and assume visual intensity equals trading opportunity.
Solution: Develop quantitative frameworks that supplement visual analysis with mathematical confirmation.
:::warning Never make trading decisions based solely on heatmap colors or order flow visualizations. Always confirm with multiple analytical dimensions. :::
Pitfall 2: Misunderstanding Market Maker vs. Institutional Flow
Problem: Confusing market maker facilitation with directional institutional positioning.
Solution: Learn to distinguish between:
- Facilitative flow (market makers providing liquidity)
- Directional flow (institutions building positions)
- Hedging flow (risk management activities)
- Arbitrage flow (cross-market efficiency trades)
Pitfall 3: Ignoring Liquidity Evolution
Problem: Treating liquidity as static rather than dynamic.
Solution: Continuously monitor:
- How liquidity zones evolve throughout sessions
- The impact of news and events on liquidity distribution
- Seasonal and cyclical liquidity patterns
- Cross-market liquidity migration
Pitfall 4: Time Frame Inconsistency
Problem: Mixing short-term order flow analysis with long-term positioning decisions.
Solution: Maintain clear time frame hierarchy:
- Use appropriate order flow time frames for trade duration
- Align liquidity analysis with position holding periods
- Separate scalping, day trading, and swing trading approaches
Pitfall 5: Emotional Interpretation
Problem: Projecting personal biases onto order flow and liquidity data.
Solution: Develop systematic interpretation frameworks:
- Create standardized evaluation checklists
- Use quantitative measurements alongside qualitative assessment
- Regularly review and analyze interpretation accuracy
- Maintain detailed trading journals with liquidity analysis notes
:::tip The key to professional liquidity analysis is treating it as one component of a comprehensive trading system, not as a standalone prediction tool. :::
Conclusion
Mastering liquidity heatmaps and order flow analysis requires moving beyond the superficial interpretations that plague most retail trading approaches. Professional traders understand that these tools reveal market structure and institutional behavior patterns rather than providing simple buy/sell signals.
The critical insights covered in this guide – from understanding the liquidity spectrum to implementing session-based analysis frameworks – represent the foundation of institutional-level market analysis. By avoiding common retail misconceptions and adopting systematic, multi-dimensional approaches to liquidity assessment, traders can develop genuine edges in their market analysis.
Successful implementation requires consistent practice, detailed record-keeping, and continuous refinement of analytical frameworks. The goal isn't to predict every market move, but to understand the underlying institutional flow patterns that drive major market movements and position accordingly.
Start implementing these concepts gradually, beginning with paper trading to test your interpretation skills. Focus on developing systematic approaches rather than relying on intuitive reactions to visual indicators. With proper application, liquidity and order flow analysis becomes a powerful component of professional trading methodology.
Begin your advanced analysis today by selecting one major currency pair or stock and applying the multi-dimensional framework outlined in this guide. Document your observations and continuously refine your interpretation skills through systematic practice and review.