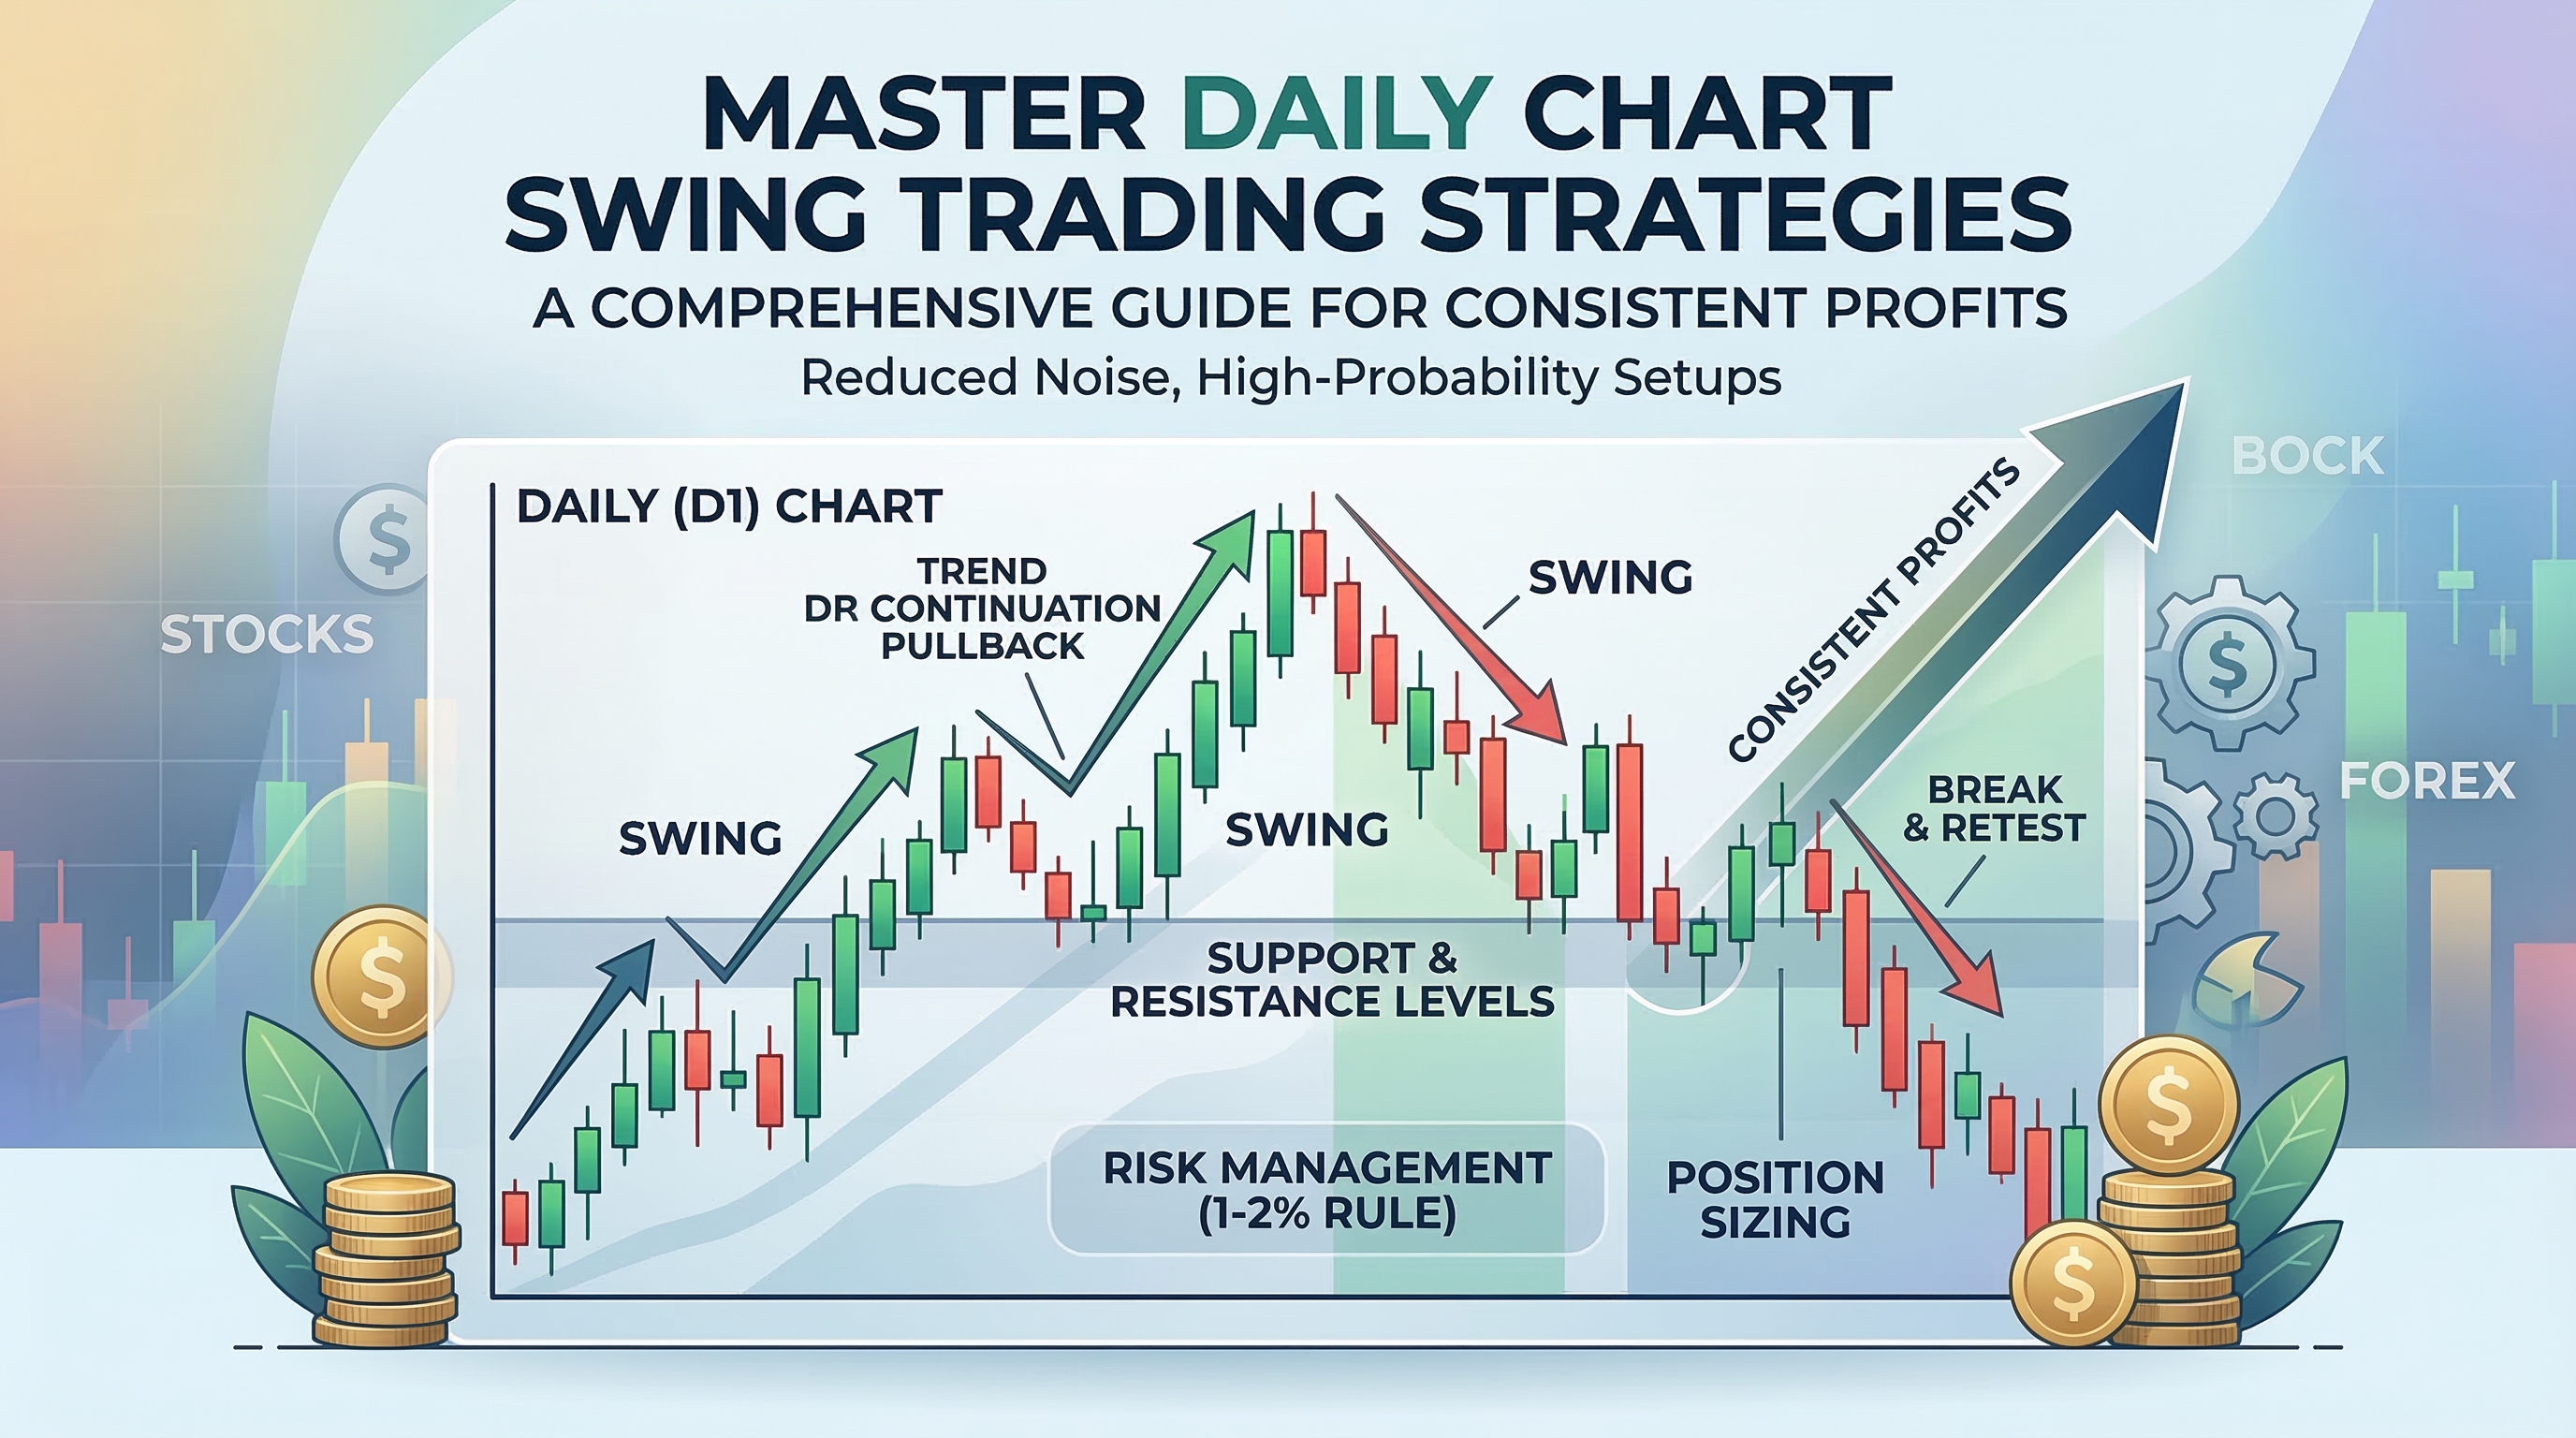
# Master Daily Chart Swing Trading Strategies for Consistent Profits
Swing trading on daily charts represents one of the most balanced approaches to trading, offering traders the opportunity to capture significant price movements while avoiding the noise and stress of shorter timeframes. Daily chart swing trading strategies provide the perfect middle ground between day trading's intensity and position trading's long-term commitment.
This comprehensive guide will teach you how to master swing trading on daily charts, from identifying high-probability setups to managing positions for maximum profitability. Whether you're trading forex, stocks, or commodities, these strategies can be adapted to any market.
Table of Contents
- [Understanding Daily Chart Swing Trading](#understanding-daily-chart-swing-trading)
- [Essential Market Structure Analysis](#essential-market-structure-analysis)
- [High-Probability Entry Strategies](#high-probability-entry-strategies)
- [Risk Management and Position Sizing](#risk-management-and-position-sizing)
- [Exit Strategies and Profit Maximization](#exit-strategies-and-profit-maximization)
- [Common Mistakes to Avoid](#common-mistakes-to-avoid)
Understanding Daily Chart Swing Trading
Daily chart swing trading involves holding positions for several days to weeks, capitalizing on intermediate-term price swings. Unlike scalping or day trading, this approach allows you to work with the natural rhythm of markets while maintaining a reasonable work-life balance.
:::key-concept What Makes Daily Charts Special:
:::
- Each candle represents one full trading day
- Filters out intraday noise and false signals
- Provides clear trend direction and momentum
- Allows for proper risk-reward ratios (typically 1:2 or higher)
Why Daily Chart Swing Trading Strategies Work
Daily charts offer several advantages that make them ideal for swing trading:
Reduced Noise: Daily candles smooth out the erratic price movements seen on shorter timeframes, providing clearer signals and reducing false breakouts.
Better Risk-Reward Opportunities: The extended timeframe allows for larger profit targets while maintaining reasonable stop losses, often achieving risk-reward ratios of 1:3 or better.
Less Screen Time Required: Unlike day trading, you don't need to monitor charts constantly. A few minutes of analysis each evening is often sufficient.
Psychological Benefits: The slower pace reduces stress and emotional decision-making, leading to more rational trading choices.
:::tip Pro Tip: Always start your analysis on the weekly chart to understand the bigger picture, then zoom into the daily chart for precise entry and exit points. :::
Essential Market Structure Analysis
Successful daily chart swing trading strategies begin with understanding market structure. This involves identifying trends, support and resistance levels, and potential reversal zones.
Identifying Trend Direction
Before entering any swing trade, you must determine the overall trend direction:
Uptrend Characteristics:
- Series of higher highs and higher lows
- Price trading above major moving averages
- Strong bullish momentum candles
- Support holding at previous resistance levels
Downtrend Characteristics:
- Series of lower highs and lower lows
- Price trading below major moving averages
- Strong bearish momentum candles
- Resistance forming at previous support levels
:::example Trend Analysis Example: When analyzing EUR/USD on the daily chart, look for a clear sequence of higher highs and higher lows to confirm an uptrend. If the pair breaks above a previous high with strong volume, it signals potential continuation higher, making it ideal for bullish swing trades. :::
Key Support and Resistance Levels
Daily chart swing trading strategies rely heavily on identifying significant support and resistance levels:
Major Support/Resistance Areas:
- Previous significant highs and lows
- Round psychological numbers (e.g., 1.2000 in forex)
- Moving average confluence zones
- Fibonacci retracement levels
- Weekly and monthly pivot points
Market Structure Breaks
A crucial element in daily chart swing trading strategies is recognizing when market structure changes:
Bullish Structure Break: Price breaks above a previous significant high, indicating potential upward continuation.
Bearish Structure Break: Price breaks below a previous significant low, suggesting potential downward momentum.
:::warning Important: Always wait for a daily candle close beyond the structure level before considering it a valid break. Intraday breaks that don't hold by day's end often result in false signals. :::
High-Probability Entry Strategies
Now that you understand market structure, let's explore specific daily chart swing trading strategies for entering positions at optimal levels.
Strategy 1: Trend Continuation Pullback
This strategy involves entering in the direction of the established trend after a temporary pullback.
Setup Requirements: 1. Clear trend established on daily chart 2. Price pulls back to a significant support/resistance level 3. Bullish/bearish rejection candle forms at the level 4. Volume confirms the setup
Entry Process: 1. Wait for price to pullback 38.2% to 61.8% of the previous swing 2. Look for a strong rejection candle (hammer, doji, engulfing pattern) 3. Enter on the break of the rejection candle's high/low 4. Place stop loss beyond the pullback low/high
:::example Pullback Strategy Example: In an uptrending stock, wait for price to pullback to the 50% Fibonacci retracement level. If a bullish engulfing candle forms at this level with increased volume, enter long on the break above the engulfing candle's high. This provides excellent risk-reward as you're entering near support with a clear upside target. :::
Strategy 2: Break and Retest
This approach capitalizes on structure breaks followed by retests of the broken level.
Setup Requirements: 1. Significant support/resistance level identified 2. Clean break of the level with momentum 3. Price retests the broken level as new support/resistance 4. Rejection from the retest level
Entry Process: 1. Identify the initial break of structure 2. Wait for price to return and retest the broken level 3. Look for rejection signals at the retest 4. Enter in the direction of the original break 5. Stop loss goes beyond the retest area
Strategy 3: Range Breakout
Daily chart ranges often precede significant moves, making breakouts profitable swing trading opportunities.
Setup Requirements: 1. Well-defined horizontal range for at least 10-15 daily candles 2. Multiple tests of both support and resistance 3. Decreasing volume during range formation 4. Strong breakout candle with increased volume
Entry Process: 1. Identify the range boundaries 2. Wait for a decisive breakout with volume confirmation 3. Enter on the breakout or on a pullback to the broken level 4. Target distance equal to the range height
:::tip Breakout Confirmation: Look for a daily candle close beyond the range with at least 150% of average volume to confirm a valid breakout. :::
Risk Management and Position Sizing
Proper risk management separates successful swing traders from those who blow their accounts. Daily chart swing trading strategies require disciplined risk control.
Position Sizing Rules
The 1-2% Rule: Never risk more than 1-2% of your trading capital on any single swing trade. This ensures you can withstand a series of losses without significant account damage.
Calculating Position Size: 1. Determine your risk amount (1-2% of capital) 2. Calculate the distance to your stop loss in pips/points 3. Divide risk amount by stop loss distance 4. This gives you your position size
:::example Position Sizing Example: With a $10,000 account risking 1% ($100), and a stop loss 50 pips away in EUR/USD:
:::
- Risk per pip = $100 ÷ 50 = $2 per pip
- Position size = $2 per pip = 0.2 lots (20,000 units)
Stop Loss Placement
Effective daily chart swing trading strategies require strategic stop loss placement:
Support/Resistance Based Stops:
- Place stops beyond significant support/resistance levels
- Allow for some breathing room (10-20 pips buffer)
- Consider market volatility when setting buffers
ATR-Based Stops:
- Use Average True Range (ATR) to set dynamic stops
- Multiply ATR by 1.5-2.5 for appropriate stop distance
- Adjust based on current market conditions
Managing Winning Trades
Trailing Stops: As your trade moves in your favor, trail your stop loss to lock in profits while allowing for continued upside.
Partial Profit Taking: Consider taking 25-50% profits at key resistance/support levels, letting the remainder run for larger gains.
:::warning Risk Management Warning: Never move your stop loss against your position. If the original analysis was wrong, accept the loss and move on to the next opportunity. :::
Exit Strategies and Profit Maximization
Knowing when and how to exit is as important as entry timing in daily chart swing trading strategies.
Target-Based Exits
Measured Moves: Use previous swing highs/lows to project targets. In trending markets, expect moves equal to or greater than previous swings.
Fibonacci Extensions: Project targets using 127.2%, 161.8%, and 200% Fibonacci extension levels from the previous swing.
Support/Resistance Targets: Exit before major support/resistance levels where price is likely to reverse or consolidate.
Momentum-Based Exits
Divergence Signals: Watch for momentum divergence between price and oscillators (RSI, MACD) as a sign to exit.
Candlestick Reversal Patterns: Exit on strong reversal patterns like shooting stars, hammers, or engulfing candles at key levels.
Volume Analysis: Decreasing volume on continuation moves often signals trend exhaustion.
Time-Based Exits
Sometimes the best exit strategy is based on time rather than price:
Holding Period: If a swing trade hasn't moved in your favor within 5-10 days, consider exiting to free up capital.
Friday Exits: Some traders prefer to exit before weekends to avoid gap risk, especially in volatile markets.
:::tip Profit Maximization Tip: Use a combination of exit strategies rather than relying on just one. Take partial profits at technical levels while letting runners capture extended moves. :::
Common Mistakes to Avoid
Even the best daily chart swing trading strategies can fail if you make these common errors:
Overcomplicating Your Analysis
Keep It Simple: Don't clutter your charts with dozens of indicators. Focus on price action, key levels, and 2-3 complementary indicators at most.
Analysis Paralysis: Avoid overthinking setups. If the basic criteria are met, take the trade rather than searching for perfect confirmation.
Poor Risk Management
Position Size Too Large: Trading with excessive size leads to emotional decision-making and account destruction.
Moving Stops Against You: This violates the fundamental rule of cutting losses short.
No Stop Loss: Never enter a trade without a predetermined exit point for losses.
Emotional Trading Decisions
FOMO (Fear of Missing Out): Don't chase breakouts or enter trades after significant moves have already occurred.
Revenge Trading: After a loss, don't immediately seek to "get even" with larger position sizes or lower-quality setups.
Ignoring the Plan: Stick to your predetermined entry and exit criteria rather than making impulsive changes.
Market Environment Misunderstanding
Trading Against the Trend: While counter-trend trades can be profitable, they're generally lower probability than trend-following setups.
Ignoring Higher Timeframes: Always consider the weekly and monthly chart context before entering daily chart trades.
One-Size-Fits-All Approach: Adapt your daily chart swing trading strategies to current market conditions rather than using the same approach in all environments.
:::warning Critical Mistake to Avoid: Never increase your position size after a series of losses. This is the fastest way to blow up your trading account. :::
Conclusion
Mastering daily chart swing trading strategies requires patience, discipline, and consistent application of proven techniques. The strategies outlined in this guide provide a solid foundation for capturing significant price moves while managing risk effectively.
Remember that successful swing trading isn't about finding the perfect setup every time—it's about consistently applying your edge over many trades. Focus on high-probability setups, maintain strict risk management, and always keep the bigger picture in mind.
The beauty of daily chart swing trading strategies lies in their balance: they offer substantial profit potential without the constant screen time required by shorter timeframes. By understanding market structure, timing your entries carefully, and managing your risk appropriately, you can build a sustainable and profitable swing trading approach.
Start by practicing these strategies on a demo account or with small position sizes until you're comfortable with the concepts. Paper trade for at least a month to validate your understanding before risking significant capital.
Ready to put these daily chart swing trading strategies into practice? Begin by analyzing your favorite markets on the daily timeframe, identifying key support and resistance levels, and paper trading your setups. Remember, consistency and patience are your greatest allies in swing trading success. Master these fundamentals, and you'll be well on your way to profitable swing trading on the daily charts.