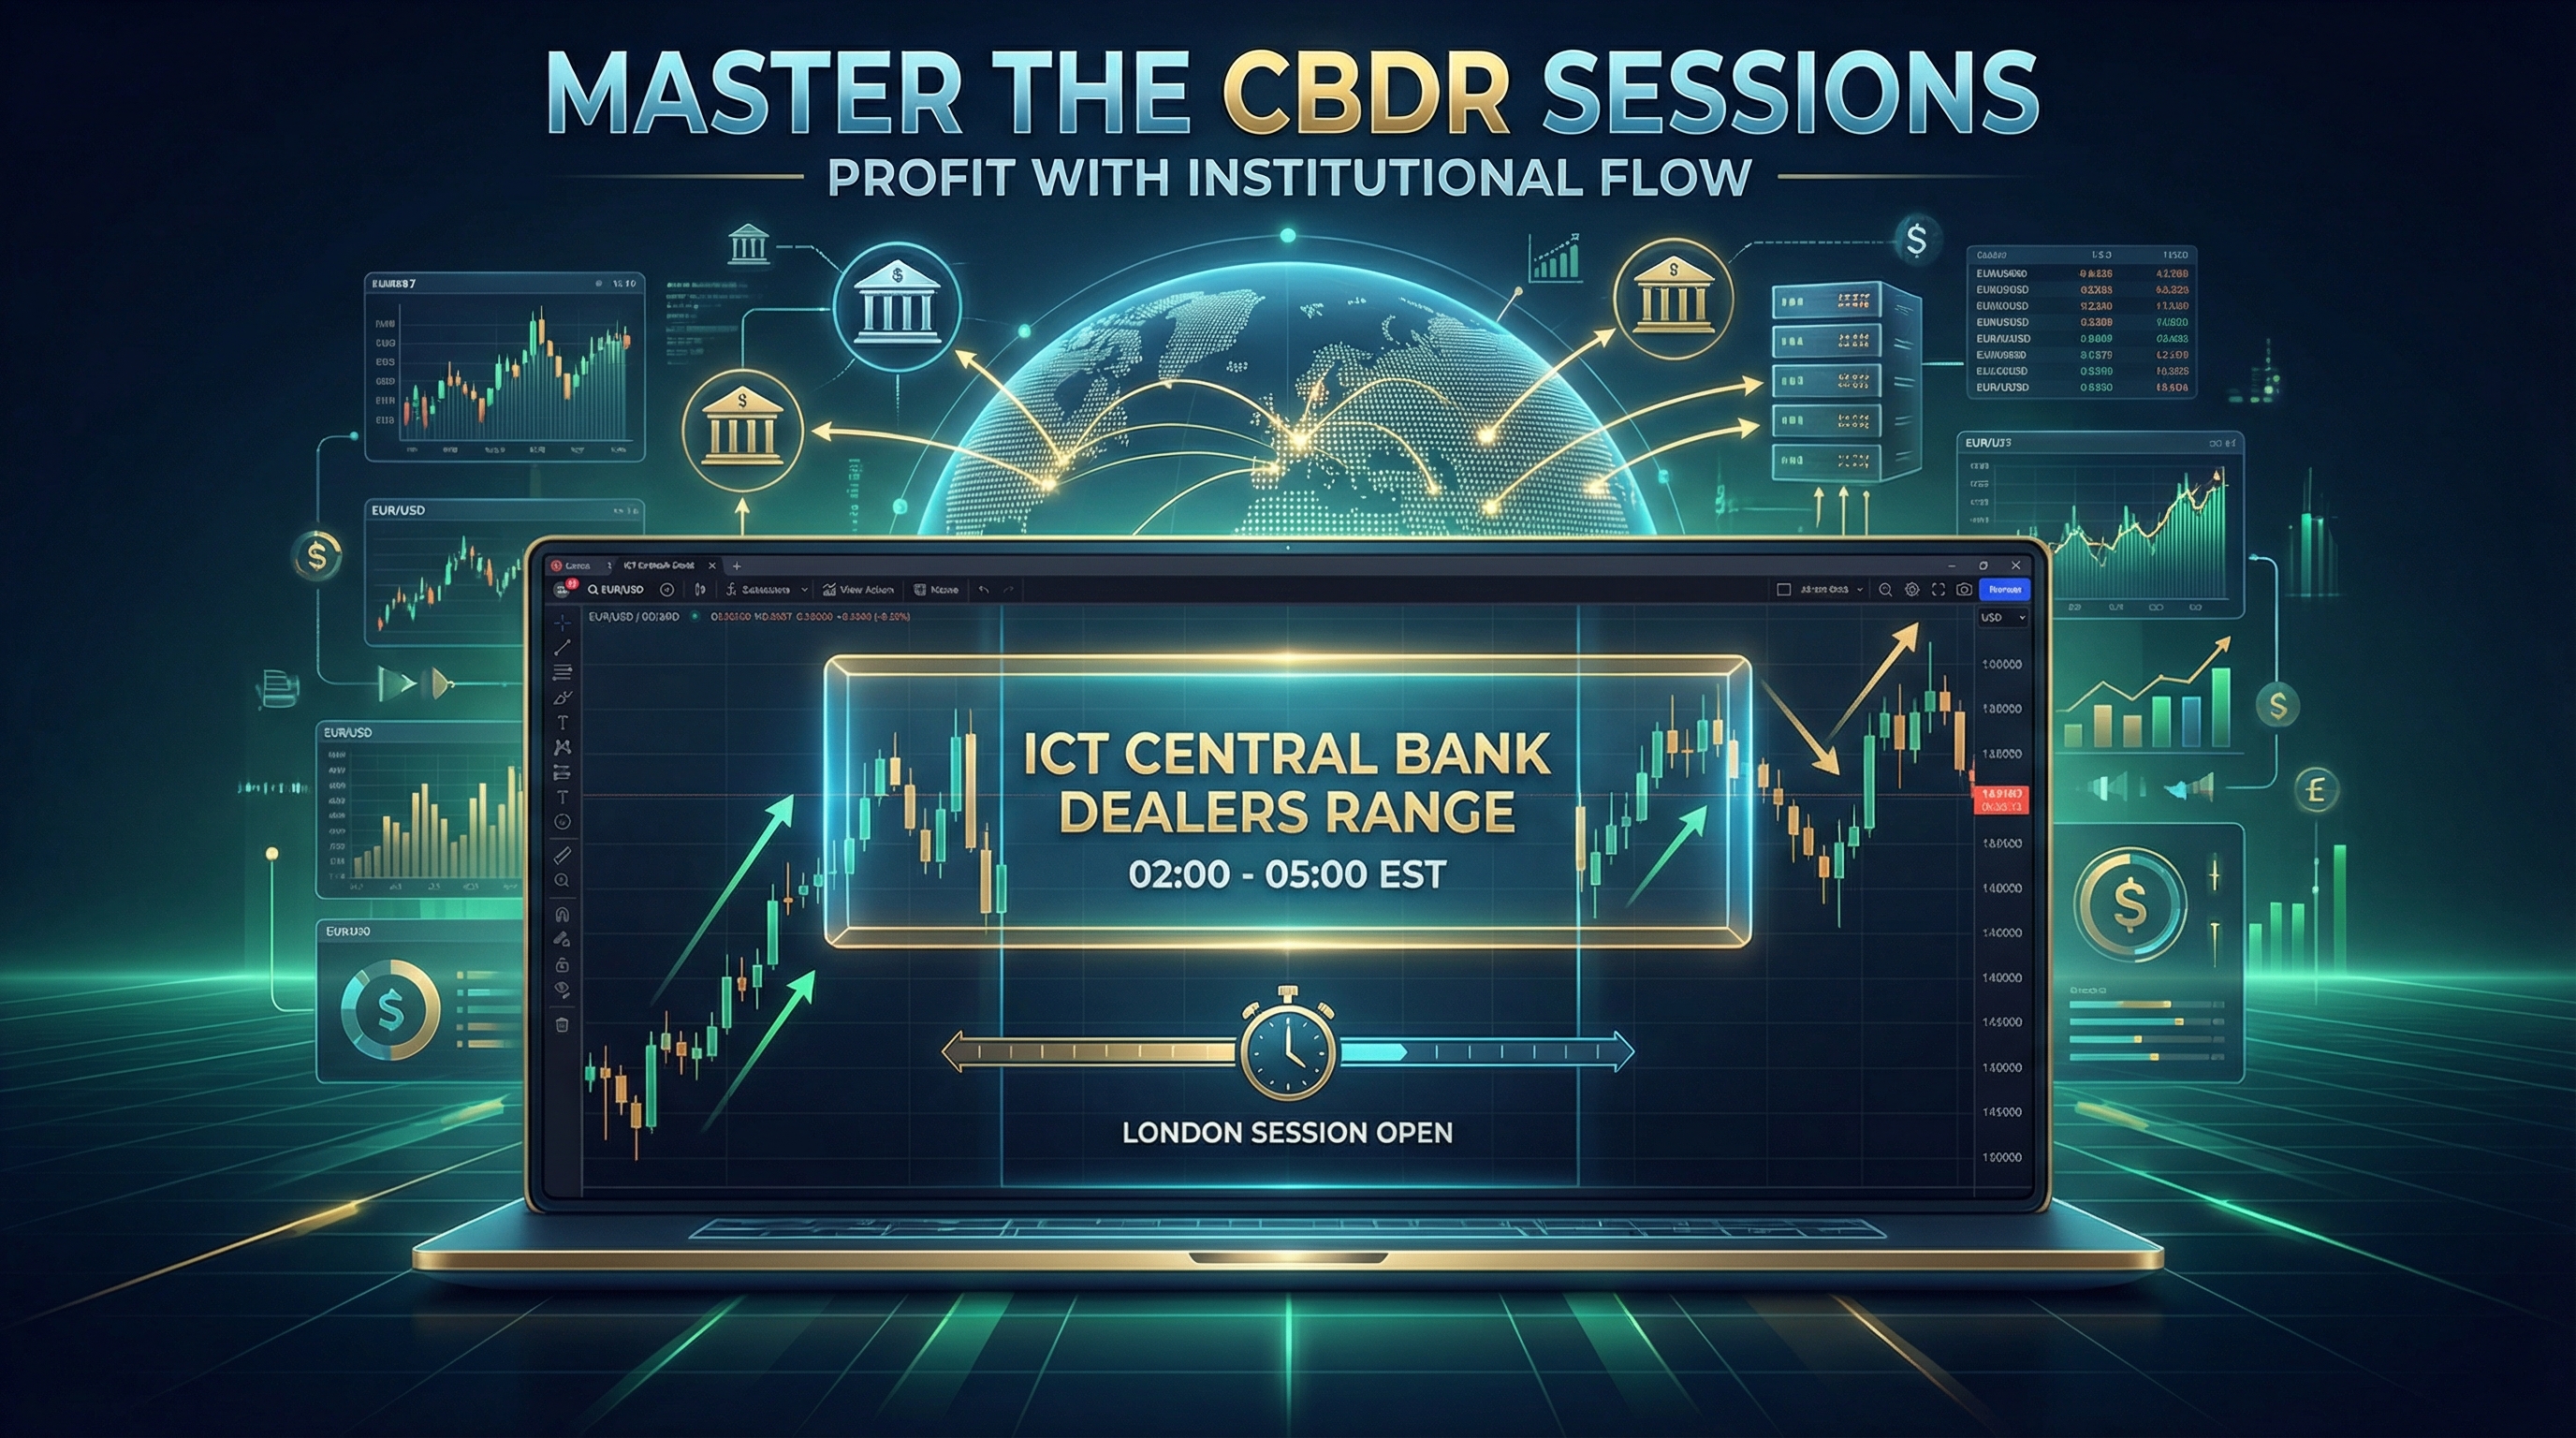
# Master ICT Central Bank Dealers Range: Complete Guide to Trading CBDR Sessions
The ICT Central Bank Dealers Range (CBDR) represents one of the most powerful concepts in institutional trading methodology. This trading session occurs during specific times when central bank dealers and institutional traders establish their positions, creating predictable price patterns that retail traders can exploit for consistent profits.
Understanding the ict central bank dealers range is crucial for anyone serious about trading with institutional flow rather than against it. This comprehensive guide will teach you how to identify, trade, and profit from CBDR sessions across multiple timeframes and markets.
Table of Contents
- [Understanding the Central Bank Dealers Range](#understanding-the-central-bank-dealers-range)
- [Timing and Session Analysis](#timing-and-session-analysis)
- [Identifying CBDR Setup Patterns](#identifying-cbdr-setup-patterns)
- [Trading Strategies and Entry Techniques](#trading-strategies-and-entry-techniques)
- [Risk Management and Trade Execution](#risk-management-and-trade-execution)
- [Advanced CBDR Concepts](#advanced-cbdr-concepts)
- [Conclusion](#conclusion)
Understanding the Central Bank Dealers Range
The Central Bank Dealers Range is a specific time period where institutional participants establish their daily positioning. During this session, banks and large financial institutions conduct their primary trading activities, creating ranges that often get revisited or broken throughout the trading day.
:::key-concept The ict central bank dealers range typically occurs between 02:00 and 05:00 EST (New York time), coinciding with the London session open. This timing allows institutions to position themselves before major market moves. :::
Key Characteristics of CBDR
The CBDR session exhibits several distinctive characteristics:
- Range Formation: Price tends to consolidate within defined highs and lows
- Institutional Volume: Higher than average trading volume during this period
- Liquidity Building: Accumulation of buy and sell stops above and below the range
- Directional Bias: Often sets the tone for the remaining trading session
:::example On EUR/USD, if the CBDR forms between 1.0850 and 1.0890, institutions are likely accumulating positions within this range. A break above 1.0890 could signal bullish institutional sentiment, while a break below 1.0850 might indicate bearish positioning. :::
Market Psychology During CBDR
Understanding the psychology behind the ict central bank dealers range helps traders anticipate price movements:
1. Accumulation Phase: Institutions quietly build positions 2. Range Testing: Price tests both highs and lows to gauge sentiment 3. Breakout Preparation: Liquidity builds at key levels 4. Directional Move: Clear break signals institutional bias
Timing and Session Analysis
Successful CBDR trading requires precise timing and understanding of global market sessions. The effectiveness of this strategy depends heavily on trading during the correct time windows.
Optimal Trading Hours
The most effective CBDR sessions occur during:
- Primary Window: 02:00 - 05:00 EST
- Secondary Window: 08:00 - 10:00 EST (London/New York overlap)
- Asian Extension: 20:00 - 23:00 EST (for USD/JPY pairs)
:::tip Always adjust these times for daylight saving changes in your local timezone. The key is to align with London banking hours when institutional activity is highest. :::
Currency Pair Selection
Different currency pairs respond better to CBDR analysis during specific sessions:
European Session Pairs:
- EUR/USD
- GBP/USD
- EUR/GBP
- USD/CHF
Asian Session Pairs:
- USD/JPY
- AUD/USD
- NZD/USD
Commodity Currencies:
- GBP/JPY
- EUR/JPY
- AUD/JPY
Weekend Gap Considerations
The ict central bank dealers range becomes particularly significant after weekend gaps:
1. Gap Fill Probability: CBDR often facilitates gap filling 2. Sentiment Reset: New weekly positioning begins during CBDR 3. Volatility Expansion: Higher probability of range breakouts
Identifying CBDR Setup Patterns
Recognizing valid CBDR setups requires understanding specific price action patterns and market structure elements.
Classic CBDR Formation
A textbook CBDR setup includes:
1. Clear Range Definition: Identifiable highs and lows 2. Multiple Touches: At least 2-3 tests of each boundary 3. Consolidation Period: Minimum 2-3 hours of ranging behavior 4. Volume Confirmation: Increased activity at range extremes
:::warning Avoid trading CBDR during major news events or economic announcements, as these can invalidate institutional positioning and create unpredictable price movements. :::
Range Quality Assessment
Not all ranges are created equal. High-quality CBDR setups exhibit:
Strong Characteristics:
- Clean bounces from range boundaries
- Decreasing volatility within the range
- Multiple timeframe confluence
- Clear liquidity pools at extremes
Weak Characteristics:
- Choppy, overlapping price action
- Multiple false breaks
- Narrow range relative to average daily range
- Lack of institutional volume
Multiple Timeframe Analysis
Effective CBDR analysis requires examining multiple timeframes:
- Higher Timeframe Context: Daily and 4-hour for overall bias
- Setup Timeframe: 1-hour for range identification
- Execution Timeframe: 15-minute for precise entries
- Confirmation Timeframe: 5-minute for trade validation
:::example On a 1-hour chart, identify the CBDR between 1.2050 and 1.2100 on GBP/USD. Switch to the 15-minute chart to find precise entry points near the range boundaries, then use the 5-minute chart to confirm momentum shifts. :::
Trading Strategies and Entry Techniques
Successful CBDR trading involves multiple strategic approaches, each suited to different market conditions and trader preferences.
Strategy 1: Range Reversal Trading
This conservative approach focuses on trading bounces from CBDR boundaries:
Entry Criteria: 1. Price approaches range high or low 2. Rejection candlestick pattern forms 3. Momentum divergence on oscillators 4. Entry on pullback toward range center
Stop Loss Placement:
- 10-20 pips beyond the range boundary
- Below/above the rejection candle
Take Profit Targets:
- Opposite range boundary
- 50% range retracement
- Previous support/resistance levels
Strategy 2: CBDR Breakout Trading
This aggressive approach capitalizes on range breaks with institutional backing:
Breakout Confirmation: 1. Clean break above/below range with momentum 2. Increased volume on the breakout candle 3. No immediate pullback into the range 4. Multiple timeframe alignment
Entry Techniques:
- Immediate Entry: Enter on breakout candle close
- Pullback Entry: Wait for retest of broken level
- Momentum Entry: Enter on acceleration past key levels
:::key-concept The most reliable CBDR breakouts occur when price breaks the range and immediately continues in the breakout direction without significant pullbacks. :::
Strategy 3: Liquidity Grab Setup
This advanced technique exploits false breaks designed to capture retail stops:
Setup Recognition: 1. Quick spike beyond range boundary 2. Immediate reversal back into range 3. Increased volume on the reversal 4. Clear rejection of the false break level
Trading Process: 1. Identify the Grab: False break captures stops 2. Wait for Reversal: Price returns to range 3. Enter on Confirmation: Strong rejection signal 4. Target Opposite Boundary: High probability target
Entry Timing Optimization
Optimal entry timing within the ict central bank dealers range requires patience and precision:
Best Entry Windows:
- First hour of CBDR formation
- Range boundary tests with clear rejection
- Breakout confirmation candles
- Post-liquidity grab reversals
Avoid Entry During:
- Range formation (unclear boundaries)
- Low volume periods
- Conflicting timeframe signals
- Major news events
Risk Management and Trade Execution
Proper risk management transforms CBDR trading from gambling into a professional trading approach.
Position Sizing Guidelines
Calculate position size based on:
1. Account Risk: Never risk more than 1-2% per trade 2. Stop Distance: Larger stops require smaller position sizes 3. Range Width: Wider ranges allow for larger stops 4. Market Volatility: Higher volatility requires reduced size
:::tip Use the formula: Position Size = (Account Risk ÷ Stop Loss Distance) × Account Balance. This ensures consistent risk regardless of stop placement. :::
Stop Loss Strategies
Conservative Stops:
- 20-30 pips beyond range boundaries
- Below/above previous session extremes
- Outside of significant support/resistance
Aggressive Stops:
- 10-15 pips beyond entry level
- Below/above recent swing points
- Based on average true range calculations
Trailing Stop Techniques: 1. Fixed Distance: Trail by predetermined pip amount 2. Swing Point: Move stops to recent highs/lows 3. ATR-Based: Trail using average true range multiples 4. Time-Based: Tighten stops during specific sessions
Take Profit Management
Effective profit-taking strategies for CBDR trades:
Partial Profit Taking:
- 50% at first target (opposite range boundary)
- 25% at extended targets
- 25% trailed to maximize runners
Target Selection: 1. Range-Based: Opposite boundary or range projection 2. Technical Levels: Previous support/resistance zones 3. Fibonacci Extensions: 127.2%, 161.8% projections 4. Round Numbers: Psychological levels ending in 00 or 50
:::example For a CBDR breakout on EUR/USD from 1.0850-1.0890 range, set initial targets at 1.0930 (range projection), 1.0950 (previous resistance), and 1.1000 (psychological level). :::
Advanced CBDR Concepts
Mastering advanced CBDR concepts separates professional traders from beginners.
Market Structure Integration
Combining CBDR analysis with broader market structure:
Trend Alignment:
- Bullish CBDR breakouts in uptrends
- Bearish CBDR breakouts in downtrends
- Range trading in sideways markets
Support/Resistance Confluence:
- CBDR boundaries at key technical levels
- Multiple timeframe support/resistance
- Previous day/week/month extremes
Volume Profile Analysis
Enhancing CBDR trading with volume analysis:
Volume Indicators:
- High Volume: Confirms institutional participation
- Low Volume: Suggests range continuation
- Volume Spikes: Signal potential breakouts
- Volume Divergence: Warns of reversal potential
Seasonal and Cyclical Patterns
The ict central bank dealers range exhibits patterns based on:
Daily Cycles:
- Stronger CBDR during mid-week sessions
- Reduced effectiveness on Mondays/Fridays
- Holiday period considerations
Monthly Patterns:
- Month-end institutional rebalancing
- Quarter-end position adjustments
- Central bank meeting schedules
Multi-Asset Correlation
Professional CBDR trading considers correlations:
Correlated Assets:
- Stock indices and risk currencies
- Bond yields and currency pairs
- Commodity prices and resource currencies
- Cryptocurrency and risk sentiment
:::warning Always check correlation strength before assuming relationship validity. Correlations can break down during stress periods or regime changes. :::
Conclusion
The ICT Central Bank Dealers Range represents a powerful tool for traders seeking to align with institutional flow. By understanding the timing, identification, and trading strategies surrounding the ict central bank dealers range, you can significantly improve your trading consistency and profitability.
Key takeaways for successful CBDR trading:
- Timing is Critical: Trade during optimal institutional hours
- Quality Over Quantity: Focus on high-probability setups
- Risk Management: Never compromise on position sizing and stops
- Multiple Timeframes: Always confirm signals across timeframes
- Continuous Learning: Adapt strategies as markets evolve
Remember that mastering CBDR trading requires practice, patience, and disciplined execution. Start by paper trading these concepts, gradually implementing them with small position sizes as your confidence and skill develop.
Ready to start implementing CBDR strategies in your trading? Begin by identifying potential setups on your preferred currency pairs during the next London session, and practice recognizing the patterns discussed in this guide. Consistent practice with proper risk management will help you develop the expertise needed to profit from institutional trading sessions.