# Mastering Daily Bias: How Higher Timeframes Dictate Intraday Moves
Welcome, traders! Have you ever found yourself in the middle of an intraday trade, watching price action unfold, only to be surprised by an unexpected reversal or a powerful breakout that seemed to come out of nowhere? The truth is, these "unpredictable" moves often aren't so unpredictable when you understand the foundational concept of daily bias.
Daily bias is your directional roadmap for intraday trading. It's the conviction that price is more likely to move in a particular direction – up, down, or sideways – over the course of a trading day. This isn't some mystical prediction; it's a measured assessment derived from the powerful influence of higher timeframes. Many retail traders get caught in the noise of lower timeframes, missing the bigger picture that professional traders keenly observe.
In this comprehensive guide, we'll demystify daily bias, showing you how to correctly interpret higher timeframe charts to inform your intraday decisions. By the end, you'll have a robust framework for identifying key levels, understanding market structure, and anticipating price action with greater confidence, leading to more informed and potentially more profitable trades.
Table of Contents
- [The Hierarchical Nature of Timeframes](#the-hierarchical-nature-of-timeframes)
- [Identifying Higher Timeframe Trends and Market Structure](#identifying-higher-timeframe-trends-and-market-structure)
- [Pinpointing Key Higher Timeframe Levels](#pinpointing-key-higher-timeframe-levels)
- [Developing Your Daily Bias](#developing-your-daily-bias)
- [Integrating Daily Bias into Your Intraday Strategy](#integrating-daily-bias-into-your-intraday-strategy)
- [Conclusion: Chart Your Course with Confidence](#conclusion-chart-your-course-with-confidence)
The Hierarchical Nature of Timeframes
Imagine trying to navigate a city using only a street-level map. You might know individual streets well, but you'd lack an understanding of the major highways, districts, and overall flow of traffic. The same applies to trading. Relying solely on a 5-minute or 15-minute chart for your trading decisions is like navigating that city without a broader perspective.
:::key-concept Higher timeframes (HTF) such as the daily, 4-hour, or even weekly charts, provide the overarching context for price action. They reveal the dominant trend, significant support and resistance zones, and the "magnets" that attract price over longer periods. Lower timeframes (LTF) like the 1-minute, 5-minute, or 15-minute charts offer granular detail, showing entry and exit opportunities within the broader HTF narrative. :::
Understanding this hierarchy is paramount. Moves on a 1-minute chart are often just noise when viewed against the backdrop of a daily trend. A strong daily bullish trend, for example, will typically absorb intraday bearish pullbacks, presenting opportunities for long entries rather than sustained shorts. Conversely, trying to take long positions against a strong daily bearish trend is like attempting to swim upstream against a powerful current – it's exhausting and often futile.
:::tip Always start your analysis from the highest relevant timeframe and work your way down. This top-down approach ensures you're aligned with the path of least resistance. :::
Identifying Higher Timeframe Trends and Market Structure
The first step in establishing a reliable daily bias is to understand the prevailing trend and market structure on your chosen higher timeframes. For intraday traders, the daily and 4-hour charts are typically the most relevant for this analysis, though some may extend to the weekly for even broader context.
What to Look For:
1. Higher Highs and Higher Lows (Uptrend): In an uptrend, price consistently creates peaks that are higher than previous peaks (Higher Highs) and troughs that are higher than previous troughs (Higher Lows). 2. Lower Highs and Lower Lows (Downtrend): In a downtrend, price creates peaks that are lower than previous peaks (Lower Highs) and troughs that are lower than previous troughs (Lower Lows). 3. Consolidation/Range: When price repeatedly bounces between identifiable support and resistance levels without clear higher highs/lows or lower highs/lows, it
is said to be in consolidation or a range.
:::example Daily Chart Analysis for Intraday Bias:
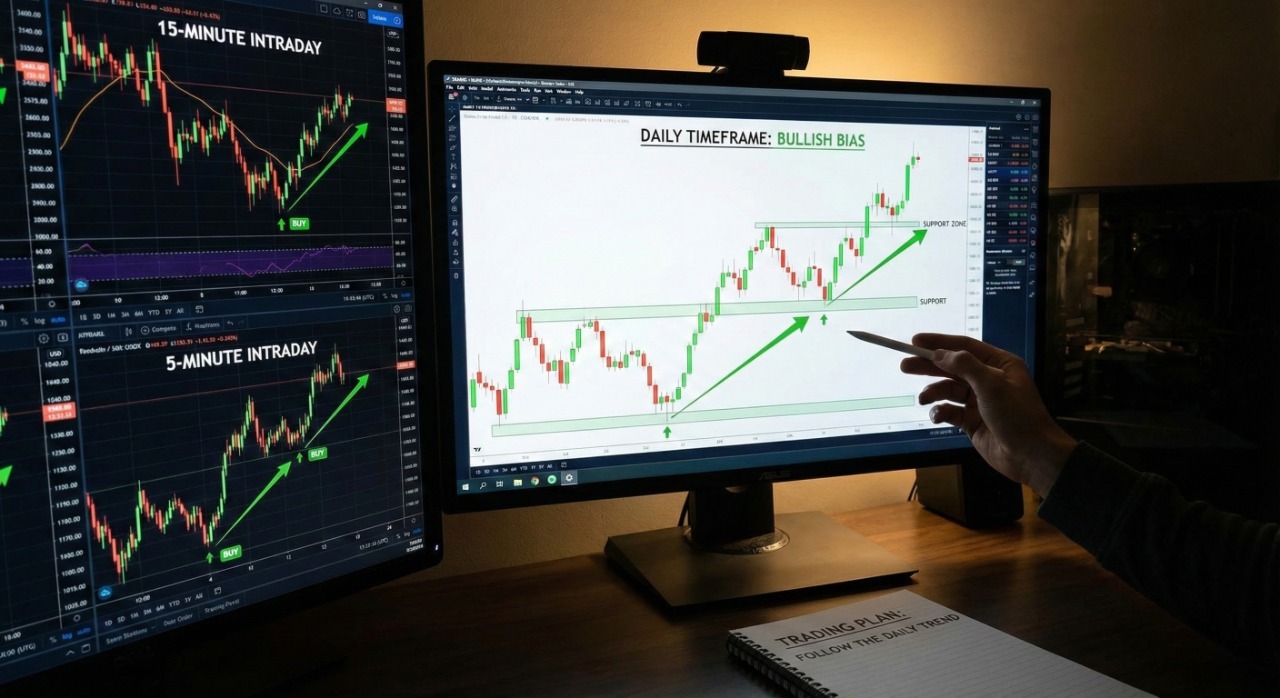
Imagine the daily chart shows a clear series of higher highs and higher lows, with the last daily candle closing strongly near its high. This immediately suggests a strong bullish daily bias. Your intraday strategy for the next day should heavily favor long opportunities, looking for pullbacks into support to buy.
Conversely, if the daily chart has just broken a significant support level and is printing lower lows and lower highs, your daily bias is bearish. You'd primarily look for short setups on your lower timeframes, perhaps fading rallies into resistance. :::
Establishing Your Daily Bias: A Step-by-Step Approach
Once you've analyzed the higher timeframes, you can systematically formulate your daily bias. This isn't about predicting the exact high or low of the day, but rather about identifying the most probable direction price will move and the areas of interest.
1. Identify the Dominant HTF Trend: As discussed, use the daily and 4-hour charts. Is it an uptrend, downtrend, or range? This is your primary directional filter. 2. Locate Key HTF Support and Resistance: Mark significant swing highs, swing lows, previous daily opens/closes, weekly levels, and potential supply/demand zones. These are the "magnets" or "walls" price might react to. 3. Determine HTF Market Structure Breaks (MSBs): Has the HTF broken a significant swing high (bullish MSB) or swing low (bearish MSB)? A recent MSB often signals a continuation or reversal of the trend. 4. Look for HTF Liquidity: Where is obvious liquidity resting? Above old highs, below old lows? Price often moves to sweep liquidity before continuing or reversing. 5. Formulate Your Daily Bias Statement: Based on the above, articulate a clear bias. E.g., "Daily/4H is bullish, looking for sustained upward movement, targeting X resistance level after a pullback to Y support." Or, "Daily/4H is bearish, expecting further downside with rallies likely to be sold, targeting Z liquidity zone."
:::tip Always consider multiple HTFs. A daily uptrend but a 4-hour range might suggest a temporary pause before continuation. Be flexible in your interpretation but always prioritize the highest timeframe's direction. :::
Integrating Daily Bias into Intraday Trading
Now that you have your daily bias, how do you use it effectively in your intraday trading?
1. Confirmation and Entry on Lower Timeframes: Once your daily bias is established, use your LTFs (e.g., 5-minute, 15-minute) to find precise entry points in alignment with that bias.
- Bullish Daily Bias: Look for LTF confirmations of bullish price action: breaks of LTF resistance, higher lows forming on pullbacks, successful retests of support, bullish candlestick patterns at key HTF support levels.
- Bearish Daily Bias: Look for LTF confirmations of bearish price action: breaks of LTF support, lower highs forming on rallies, successful retests of resistance, bearish candlestick patterns at key HTF resistance levels.
2. Avoid Counter-Trend Trading Against Strong Bias: If your daily bias is strongly bullish, resist the urge to short minor intraday pullbacks. These are often shallow and quickly reversed. Your highest probability trades will be with the dominant flow. :::warning Trading against your established daily bias, especially when it's strong, significantly reduces your probability of success and increases risk. Only consider counter-trend trades if HTF market structure clearly indicates an impending reversal or if you have a very specific, high-probability scalp setup with tight risk management. :::
3. Targeting and Risk Management: Your daily bias helps define reasonable targets. If your daily bias is bullish and price is approaching a significant HTF resistance level, you might tighten stops or take partial profits. If your bias is bearish and price is heading towards HTF support, the same principle applies.
4. Adapting to Shifting Bias: Market conditions are dynamic. What was a bullish daily bias at the open might shift if a major HTF support level breaks or news causes a significant reversal. Stay vigilant and be prepared to re-evaluate your bias throughout the trading day if HTF market structure changes.
:::key-concept Your daily bias serves as your compass. It tells you which direction to sail. Your lower timeframe analysis provides the fine-tuned adjustments to the rudder to navigate specific waves and currents. Without the compass, you're adrift. :::
Example Trade Walkthrough (Applying Daily Bias)
Let's put it all together with a hypothetical scenario.
Instrument: EUR/USD Date: October 26th
1. Daily Chart Analysis (Previous Day's Close: Oct 25th):
- Price has been in a sustained uptrend for the past week, making clear higher highs and higher lows.
- Yesterday (Oct 25th) closed strongly as a bullish engulfing candle, breaking above a minor swing high.
- The next significant daily resistance level is ~50 pips above the current price.
- The nearest significant daily support is ~70 pips below, at a previous swing low.
2. 4-Hour Chart Analysis (Morning of Oct 26th):
- Echoes the daily uptrend, showing continuous higher highs and higher lows.
- Price has just pulled back slightly into a 4-hour order block/supply zone which has now flipped to demand.
- No significant bearish market structure breaks on the 4H.
3. Daily Bias Formulation:
- Bias: Strongly Bullish.
- Reasoning: Daily and 4H charts show clear uptrends, recent strong bullish closes, and no signs of reversal on higher timeframes. Price is currently at a potential demand zone on the 4H.
- Action Plan: Look for long opportunities on LTFs. Avoid shorts unless there is a very clear and sustained LTF shift with HTF validation (unlikely given current context). Target the next daily resistance level.
4. Intraday (15-Minute/5-Minute) Analysis & Execution:
- Market Open: Price opens slightly lower, filling into the 4H demand zone.
- Observation: On the 15-minute chart, price forms a bullish hammer candlestick at the exact level of the 4H demand. Followed by a break above a minor 15-minute swing high.
- Entry: Enter long after the 15-minute swing high break, with stop loss below the low of the hammer candle/demand zone.
- Management: As price moves up, scale out partial profits as it approaches the daily resistance level. Move stop loss to breakeven.
- Outcome: Price continues higher throughout the day, hitting the daily resistance target.
Without the daily bias, an intraday trader might have seen the initial slight dip at the open and mistakenly attempted to short, going against the path of least resistance and likely getting stopped out.
Conclusion
Mastering the concept of daily bias is transformative for any active trader. It shifts your perspective from reactive to proactive, providing a structured framework for navigating the complexities of intraday price action. By anchoring your trading decisions to the larger narrative woven by higher timeframes, you significantly increase the probability of aligning with the dominant market flow.
Key Takeaways:
- Timeframe Hierarchy is King: Higher timeframes dictate the overall trend and key areas; lower timeframes provide precision entries.
- Top-Down Analysis: Always start your analysis from the daily/4-hour chart and work your way down.
- Define Your Bias Early: Before the trading day begins, formulate a clear directional bias based on HTF market structure, support/resistance, and liquidity.
- Trade With the Bias: Prioritize trades that align with your daily bias. Counter-trend trades are inherently riskier.
- Flexibility is Key: While having a bias, be prepared for dynamic shifts and adapt if HTF market structure changes during the day.
The daily bias isn't a crystal ball, but it's an indispensable compass. It helps you understand "why" prices are moving in a certain direction and "where" they are likely headed next, allowing you to choose high-probability setups and avoid chasing noise.
:::tip Practice Makes Perfect: Regularly review significant price movements on your charts. Go back in time and practice identifying the daily bias for previous trading days. Then, observe how intraday price action unfolded in relation to that bias. This hands-on application will solidify your understanding and refine your analytical skills. :::
Now, armed with a deeper understanding of how higher timeframes control intraday price action, begin incorporating daily bias into your routine. The consistency and clarity it brings to your trading analysis will be a game-changer. Start by dedicating 10-15 minutes each morning to your HTF analysis before even looking at your intraday charts. Over time, this discipline will become second nature and form the bedrock of your trading success.