# Mastering Liquidity Trading: Understanding Grabs & Sweeps for Smarter Entries
In the dynamic world of financial markets, understanding liquidity is paramount to navigating price action effectively. Smart money operators, alongside algorithmic trading systems, constantly seek liquidity to execute their large orders without causing excessive market impact. For retail traders, recognizing where liquidity resides and how it's targeted can provide invaluable insights, helping to refine entry points, optimize stop-loss placements, and avoid being trapped by seemingly unexpected price movements.
This guide will demystify the concepts of liquidity grabs and sweeps, explaining their significance in market structure and providing practical strategies for incorporating this understanding into your daily trading. By the end, you'll have a clearer perspective on how institutional players operate and how you can align your trades with the underlying flow of capital.
Table of Contents
- [The Essence of Liquidity in Trading](#the-essence-of-liquidity-in-trading)
- [What are Liquidity Grabs?](#what-are-liquidity-grabs)
- [Understanding Liquidity Sweeps](#understanding-liquidity-sweeps)
- [Identifying Liquidity Pools](#identifying-liquidity-pools)
- [Trading Strategies Incorporating Liquidity](#trading-strategies-incorporating-liquidity)
- [Conclusion and Call to Action](#conclusion-and-call-to-action)
The Essence of Liquidity in Trading
At its core, liquidity in financial markets refers to how easily an asset can be converted into cash without affecting its market price. In a broader sense for traders, it represents the availability of willing buyers and sellers. High liquidity means there are many participants, allowing for smooth order execution and tight spreads. Conversely, low liquidity can lead to volatile price swings and wider spreads, making it harder to enter or exit positions.
From a market structure perspective, liquidity isn't just about volume; it's about the location of pending orders. Traders typically place their stop-loss orders and take-profit orders at significant technical levels, such as above resistance, below support, or at previous highs/lows. These clusters of orders represent pools of liquidity – essentially, fuel for institutional moves.
:::key-concept Liquidity Pools Defined: Liquidity pools are areas on a price chart where a large number of stop-loss orders, pending buy/sell limit orders, or breakout orders are clustered. These areas act as magnets for price, as institutions often target them to fill their large positions with minimal slippage. :::
Understanding where these liquidity pools are forming is the first step in comprehending liquidity grabs and sweeps. The market often moves in engineered ways to "collect" this liquidity, triggering orders and clearing the path for its next significant move.
What are Liquidity Grabs?
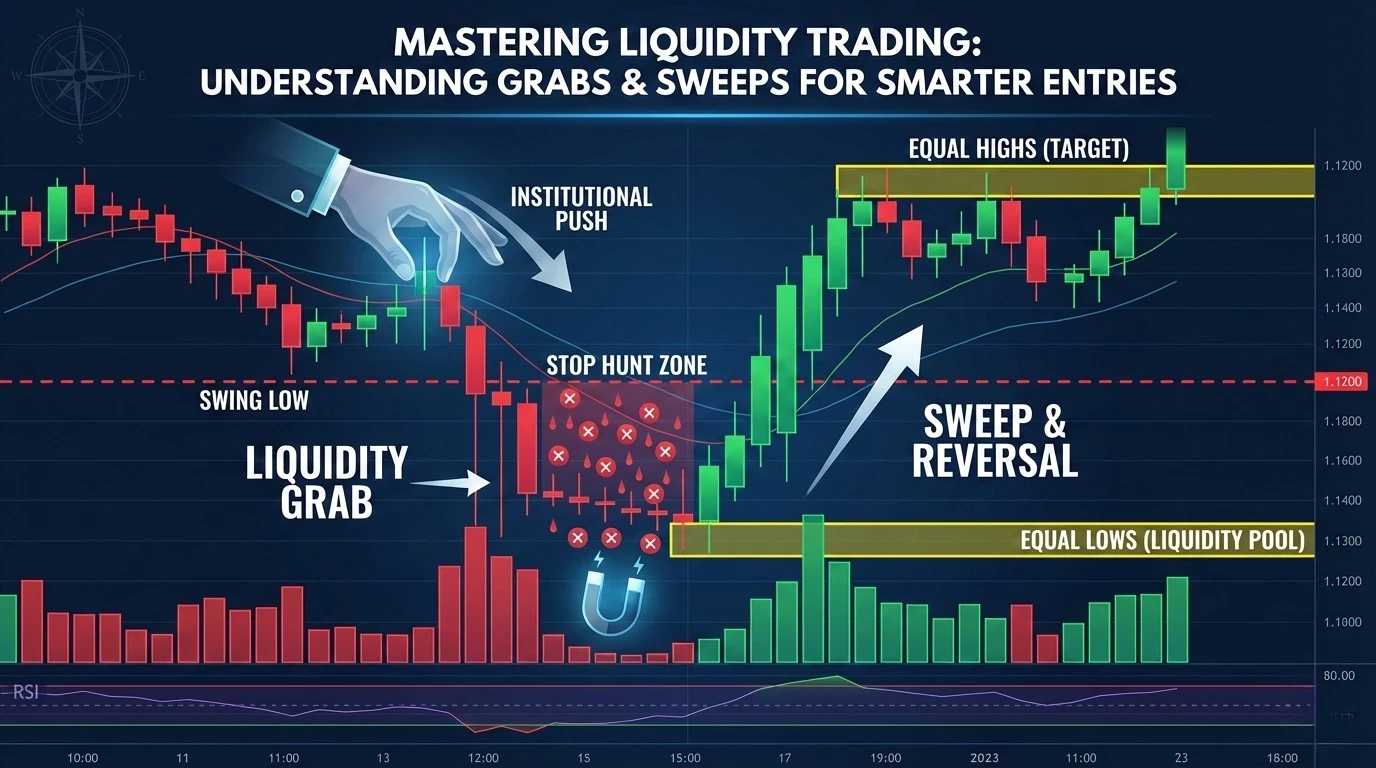
A liquidity grab, often synonymous with a "stop hunt," occurs when price briefly moves beyond a clear support or resistance level, or a previous high/low, only to reverse sharply shortly thereafter. The primary purpose of a liquidity grab is to trigger stop-loss orders placed by retail traders and to entice breakout traders into positions that will quickly become unprofitable.
:::tip Liquidity grabs are often characterized by a quick, sharp move in one direction, violating a key level, followed by an equally sharp reversal in the opposite direction. Look for strong candlestick rejections or immediate retracements. :::
Characteristics of a Liquidity Grab:
1. Violation of a Key Level: Price breaks above a swing high or below a swing low, or breaches a significant support/resistance zone. 2. Increased Volatility: The move is often swift and accompanied by an increase in trading volume, indicating strong participation during the event. 3. Quick Reversal: The crucial characteristic is the swift return of price back within the original range or a move in the opposite direction of the initial grab. 4. False Breakout: To many, it appears as a classic false breakout, designed to trap traders entering on the breakout.
:::example Scenario: Bearish Liquidity Grab Imagine a currency pair has been consolidating, forming clear swing lows around 1.1200. Many traders will place their stop-loss orders just below this level, expecting it to hold as support. A liquidity grab would see price dip quickly to 1.1190 or 1.1185, triggering those stop losses, potentially creating panic selling from breakout traders. Immediately after, price aggressively reverses back above 1.1200, signaling that the move lower was simply to collect sell-side liquidity before a genuine move higher. :::
Liquidity grabs are essentially engineered moves by larger players to accumulate or distribute positions. If they want to go long, they need sellers. By pushing price below support, they trigger stop-loss orders (which are sell orders) and encourage new selling from breakout traders, providing the necessary liquidity for their buy orders.
Understanding Liquidity Sweeps
While closely related to liquidity grabs, a liquidity sweep often implies a slightly broader or more sustained "sweep" through an area to collect orders, rather than just a quick spike. A sweep can be seen as a more thorough "cleaning out" of a particular range of stop-loss and pending orders.
:::key-concept Distinguishing Grabs vs. Sweeps: A grab is typically a quick, often one-candlestick event that "spikes" through a level and immediately reverses. A sweep can be a slightly more prolonged encounter with a liquidity zone, penetrating it more deeply or even closing a few candles beyond it before reversing, but still with the ultimate intention of collecting orders rather than a true directional shift at that moment. :::
Characteristics of a Liquidity Sweep:
1. Penetration of a Zone: Price enters and sometimes even closes a few candles beyond a significant liquidity zone (e.g., beyond multiple equal highs or lows). 2. Order Collection: The primary objective is to absorb all available orders in that area. 3. Subsequent Reversal or Continuation: After the sweep, price will either reverse course aggressively or use the collected liquidity to fuel a continuation in the original direction, but with stronger momentum. 4. Often Precedes Major Moves: Sweeps are frequently observed before significant directional shifts, indicating that major players have now accumulated or distributed their desired positions.
:::example Scenario: Bullish Liquidity Sweep Consider a stock that has established a clear resistance zone around $150, attracting short sellers and limit-sell orders. A liquidity sweep might involve price pushing convincingly above $150 to $151.50, clearing out stop-loss orders above $150 from previous short positions and filling new buy-stop orders. After collecting this liquidity, if the underlying institutional bias is bearish, the price might then quickly reverse and fall sharply, indicating that the move above $150 was primarily to attract buyers and provide liquidity for institutions to sell their holdings at higher prices. :::
Liquidity sweeps are essentially a more intricate form of market manipulation where price is intentionally driven into areas of high order density. By removing these orders, market makers "cleanse" the order book, creating clearer pathways for their intended moves.
Identifying Liquidity Pools
To effectively trade liquidity grabs and sweeps, you must first be adept at identifying potential liquidity pools on your chart. These are not always obvious but follow logical patterns based on how retail traders and algorithms tend to place their orders.
Common Liquidity Pool Locations:
1. Swing Highs and Swing Lows: The most common areas. Stop-loss orders accumulate above swing highs (for short positions) and below swing lows (for long positions). 2. Equal Highs / Equal Lows: Known as "double tops" or "double bottoms" in traditional technical analysis. These create very attractive liquidity areas, as many traders will place stops just beyond these visually distinct levels. 3. Trendline Support/Resistance: Breaks of trendlines often trigger stop losses and new breakout orders, making areas just beyond trendlines prime for liquidity hunts. 4. Major Support and Resistance Levels: Confluence zones where multiple technical tools align often become significant liquidity areas. 5. Previous Daily/Weekly/Monthly Highs and Lows: Important institutional levels that often hold significant order flow.
:::tip Always factor in timeframes. A liquidity pool on a 5-minute chart might be quickly swept, while a major liquidity pool on a daily or weekly chart implies a much more significant institutional play and a potentially larger subsequent move. :::
Practical Steps to Identify Liquidity:
1. Mark Swing Points: Clearly identify recent swing highs and lows on your chosen timeframe. 2. Look for Equalizations: Pay close attention to areas where price has touched a level multiple times, especially if it created equal highs or lows. 3. Identify Order Blocks/Supply & Demand Zones: These areas often contain significant pending orders and can be targeted for liquidity removal before a reversal or continuation. 4. Visualize Stop-Loss Placements: Put yourself in the shoes of other traders – where would you place your stop loss if you were entering a trade based on common retail strategies?
Trading Strategies Incorporating Liquidity
Once you can identify liquidity pools and understand the mechanics of grabs and sweeps, you can develop more sophisticated trading strategies. The goal is to avoid being caught in these traps and, ideally, to trade with the institutional flow rather than against it.
Strategy 1: Trading the Liquidity Grab Reversal
This strategy involves waiting for a clear liquidity grab to occur and then entering in the direction of the expected reversal.
Steps: 1. Identify a Key Liquidity Level: Mark a clear swing high/low or support/resistance zone that you anticipate to be targeted. 2. Wait for the Grab: Observe price breaking through this level with conviction. 3. Look for Rejection/Confirmation: The critical step. Price must show signs of immediate rejection (e.g., a long wick candlestick reversing back into the range) or a rapid return above/below the broken level. 4. Enter on Confirmation: Place your entry once the reversal is confirmed (e.g., a bullish engulfing candle after a bearish grab below support, or price closing back above the contested level). 5. Set Stop-Loss: Place your stop loss just beyond the high/low of the rejection candle or the new swing formed by the reversal, giving the trade room but minimizing risk. 6. Target Significant Levels: Aim for the next significant liquidity pool or a key structural level as your take-profit.
:::example Trading the Inverse Daily Liquidity Grab: If the daily chart shows a strong support at 1.0500 that has been holding for days, and then price suddenly drops to 1.0490 with a large wick piercing below 1.0500, but then closes back above it, this is a strong sign of a bullish liquidity grab. You could then look for a long entry on the next candle, placing your stop loss just below the wick low of the grab candle, targeting the nearest significant resistance level. :::
Strategy 2: Confluence with Order Blocks / Imbalance Zones
Liquidity grabs and sweeps often serve to "clear the path" toward an unmitigated order block or an imbalance (fair value gap) where institutions still have pending orders to fill.
Steps: 1. Identify an Unmitigated Order Block or Imbalance: Find a clear area on the chart where price has left an inefficiency (e.g., a gap or a strong single-direction candle move without retracement) or an order block that hasn't been retested. 2. Locate Proximal Liquidity: Identify the liquidity pools (swing highs/lows) that lie between current price and your identified order block/imbalance. 3. Anticipate the Sweep: Expect price to sweep the proximal liquidity before heading to fill the order block or imbalance. 4. Enter at the Order Block/Imbalance: Once the liquidity is swept and price approaches your target order block/imbalance, look for confirmation of a reversal at that zone. 5. Refine Entry: Look for smaller timeframe confirmations like a change of character or market structure shift within the order block/imbalance zone for a precision entry.
:::warning Trading liquidity requires patience and discipline. Do not chase price. Wait for the liquidity grab/sweep to fully develop and confirm before making a trade decision. Premature entries on perceived grabs can lead to false signals. :::
Conclusion and Call to Action
Understanding liquidity grabs and sweeps is a critical step in advancing your trading acumen. It allows you to peer behind the curtain of seemingly random market movements and anticipate the intentions of larger market participants. By recognizing where genuine supply and demand lie and where stop-loss clusters provide "fuel," you can avoid common pitfalls and identify high-probability trading opportunities.
Remember, the market is constantly seeking liquidity. Mastering the identification of liquidity pools and the subsequent price action around them will give you a significant edge, enabling you to refine your entries, manage your risk more effectively, and ultimately improve your overall trading performance. This isn't just about avoiding traps; it's about aligning yourself with the smart money flow.
Ready to put this knowledge into practice? Start by observing your favorite charts across different timeframes. Identify recent swing highs and lows, visualize where stop losses would be, and watch for clear liquidity grabs and sweeps. Pay attention to how price reacts after these events. Practice makes perfect – the more you analyze, the better you'll become at spotting these crucial market dynamics.