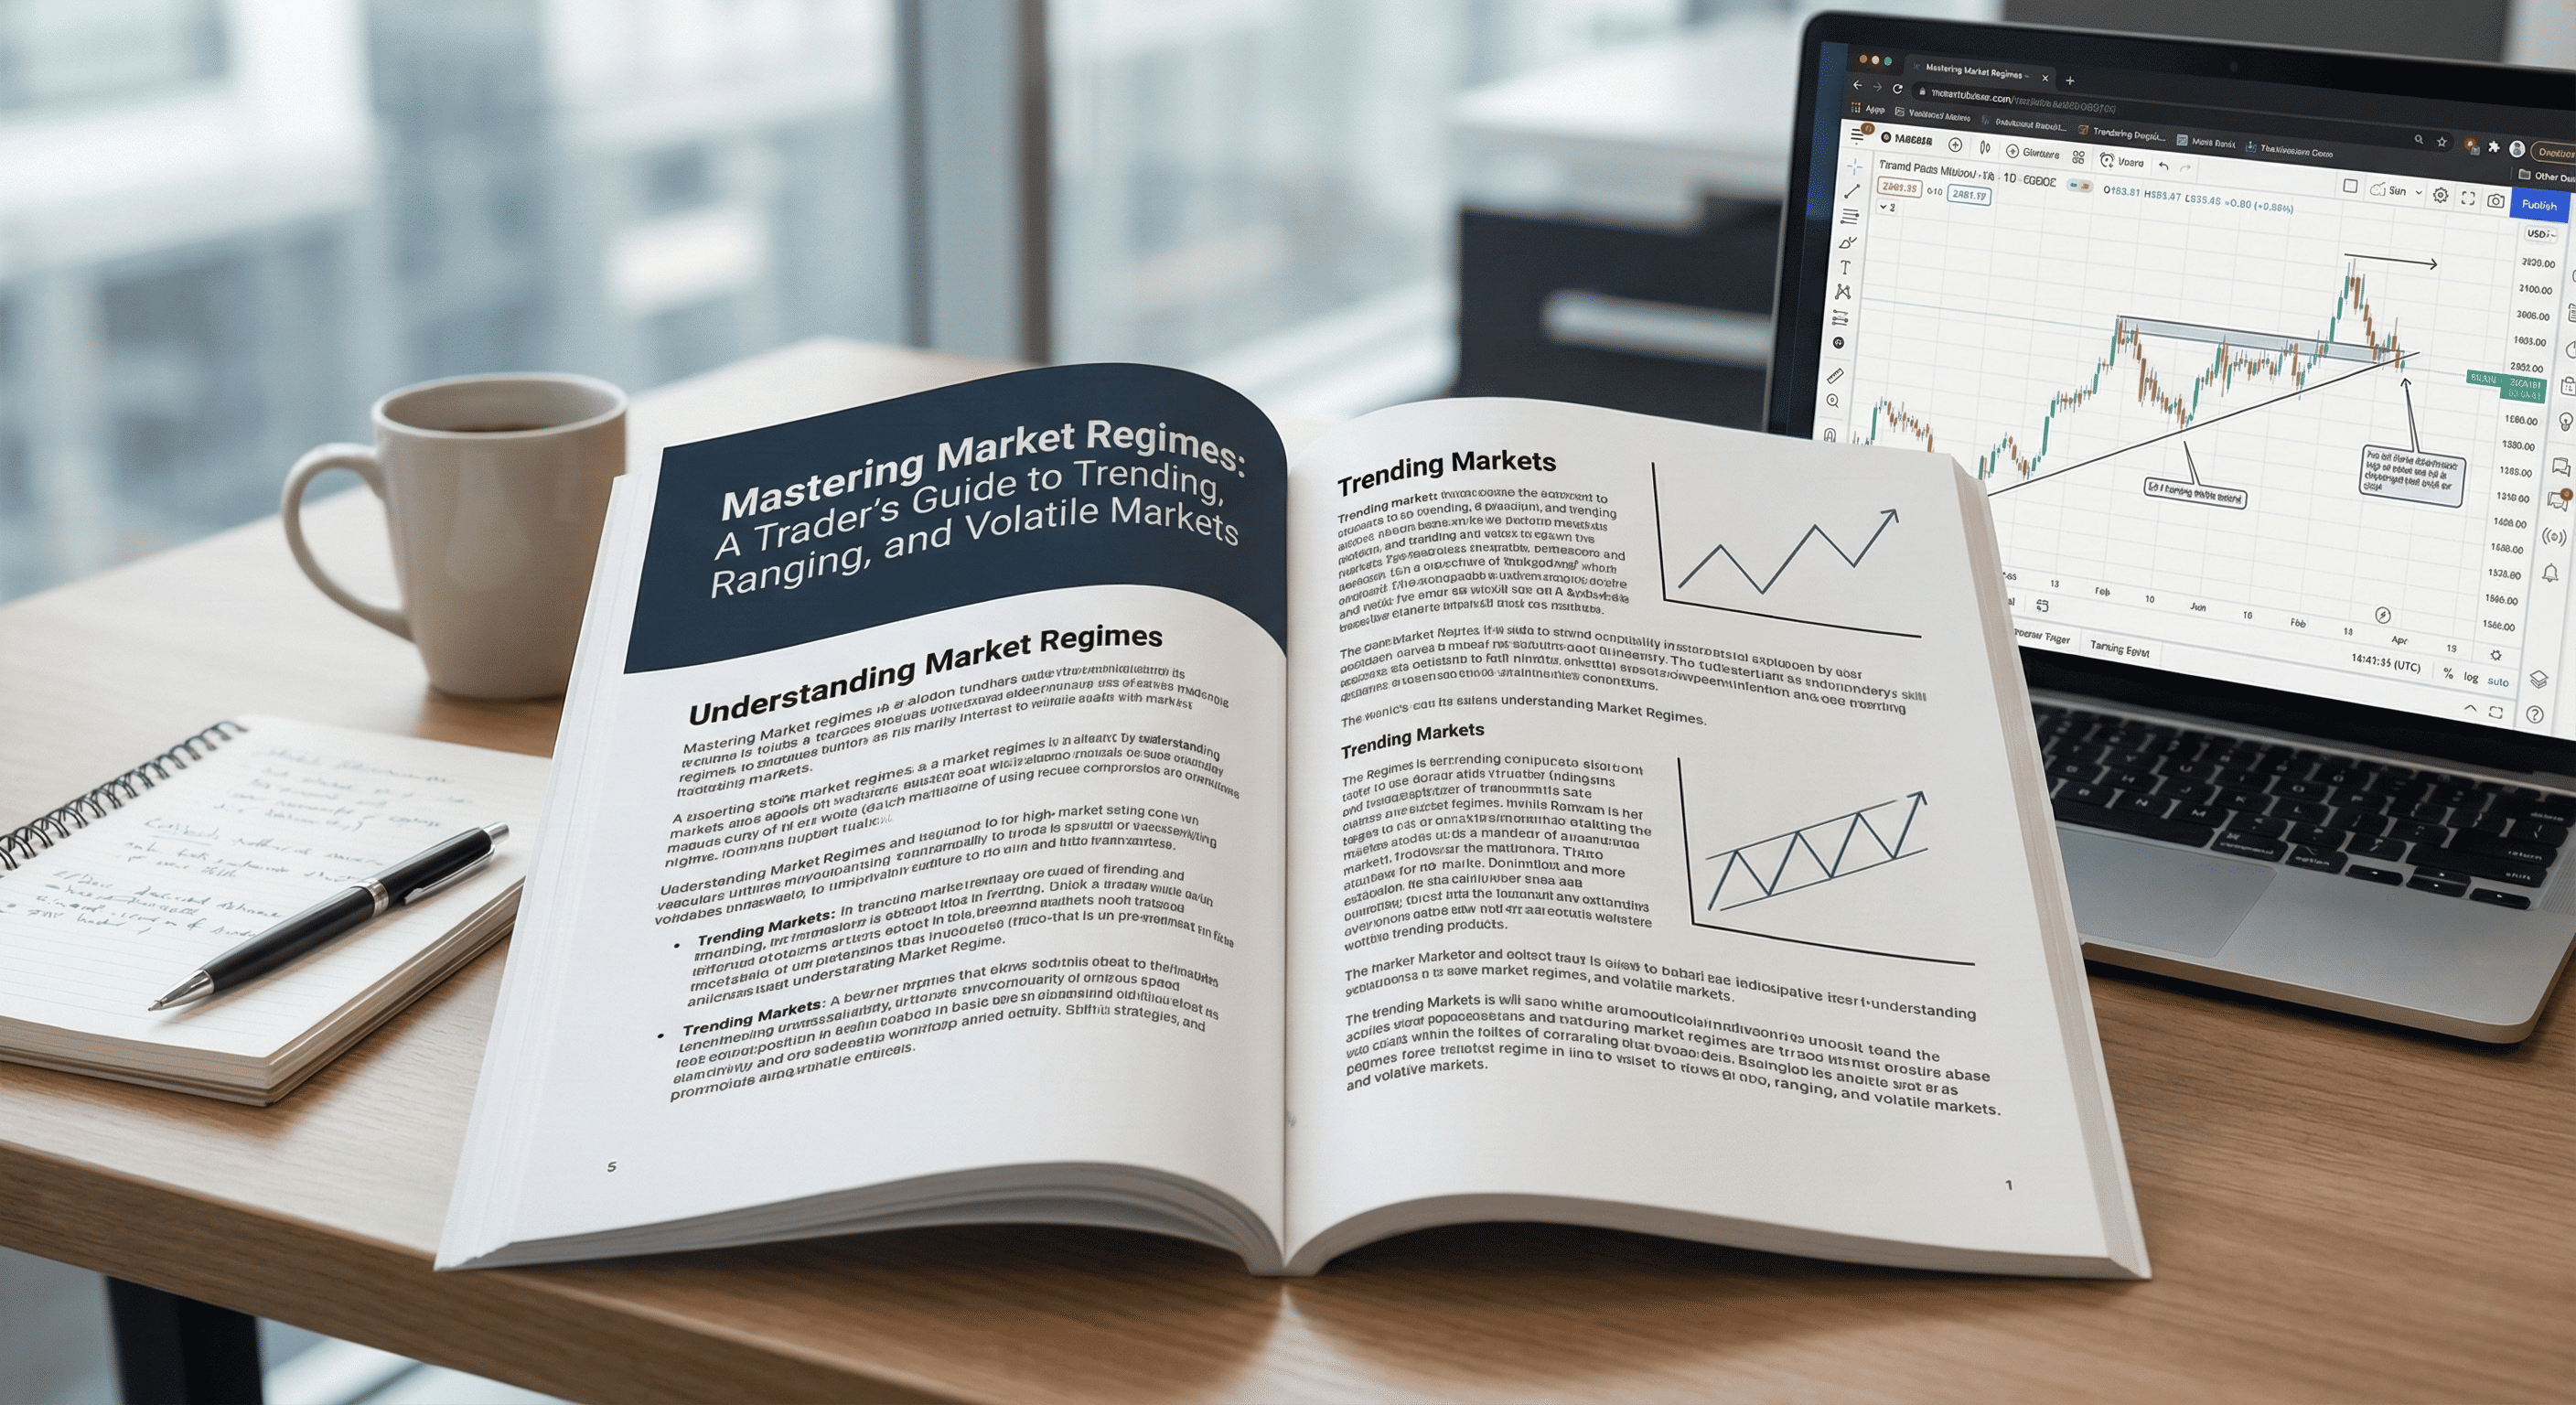
# Mastering Market Regimes: A Trader's Guide to Trending, Ranging, and Volatile Markets
Welcome, traders! In the dynamic world of financial markets, understanding the prevailing "market regime" is paramount to consistent profitability. Just as a navigator needs to know if they are sailing in calm waters, against a strong current, or through a storm, traders must recognize whether the market is trending, ranging, or exhibiting high volatility. Failing to adapt your strategy to the current regime is a common pitfall that can quickly erode trading capital.
This comprehensive guide will equip you with the knowledge and tools to identify different market regimes, understand their characteristics, and – most importantly – adapt your trading strategies to capitalize on each. By the end, you'll have a clearer roadmap for navigating the market's ever-changing landscape.
Table of Contents
- [Understanding Market Regimes](#understanding-market-regimes)
- [Trending Markets: Riding the Wave](#trending-markets-riding-the-wave)
- [Ranging Markets: The Sideways Grind](#ranging-markets-the-sideways-grind)
- [Volatile Markets: Navigating the Storm](#volatile-markets-navigating-the-storm)
- [Adapting Your Strategy to Each Regime](#adapting-your-strategy-to-each-regime)
- [Conclusion: The Art of Adaptation](#conclusion-the-art-of-adaptation)
Understanding Market Regimes
Market regimes refer to the dominant behavior or state of a financial market over a particular period. These behaviors are largely influenced by underlying supply and demand dynamics, economic news, sentiment, and fundamental factors. While sometimes distinct, market regimes can transition seamlessly from one to another, making active observation crucial.
Think of market regimes as the market's "mood." A market might be in a bullish mood (trending up), a bearish mood (trending down), an indecisive mood (ranging), or a highly emotional mood (volatile). Recognizing these moods early allows you to align your trading approach rather than fighting against the market's natural flow.
:::key-concept A "market regime" describes the prevailing condition or behavior of a financial market, primarily categorized into trending, ranging, or volatile states. Identifying the current regime is critical for applying appropriate trading strategies. :::
Ignoring market regimes can lead to significant losses. A strategy that excels in trending markets, such as trend-following, will likely perform poorly and generate numerous false signals in a ranging market. Conversely, a mean-reversion strategy designed for ranging markets will struggle when prices break out and begin a strong trend.
Trending Markets: Riding the Wave
A trending market is characterized by a sustained movement of prices in a particular direction – either upwards (uptrend) or downwards (downtrend). These markets are often driven by strong fundamental factors, significant news events, or overwhelming participant sentiment.
Characteristics of a Trending Market:
- Uptrend: Higher highs and higher lows.
- Downtrend: Lower highs and lower lows.
- Clear Direction: Price action forms a discernible slope.
- Momentum: Price movements are often strong and persistent.
- Retracements: Price will pull back against the trend before continuing in the primary direction, offering entry opportunities.
- Volume: Often higher during trend moves and lower during pullbacks.
Identifying Trending Markets
Several tools can help identify trending markets:
1. Price Action: The simplest method is to observe the sequence of highs and lows.
- Uptrend: Consistently making higher swing highs and higher swing lows.
- Downtrend: Consistently making lower swing highs and lower swing lows.
2. Moving Averages: Crossover strategies or the slope of multiple moving averages can indicate a trend.
- When shorter-period MAs are above longer-period MAs and all are sloping upwards, it suggests an uptrend.
- When shorter-period MAs are below longer-period MAs and all are sloping downwards, it suggests a downtrend.
3. Trendlines: Drawing lines connecting swing lows in an uptrend or swing highs in a downtrend can visually confirm the trend's direction and strength.
:::example Imagine observing a stock chart where the price repeatedly pushes to new highs, then pulls back slightly (forming a higher low), and then rallies again to create an even higher high. This classic "higher highs and higher lows" pattern is a clear indication of an uptrend. A 50-period moving average might also be consistently below the price, sloping upwards, further confirming the trend. :::
:::tip Always confirm a trend across multiple timeframes. A daily chart might show an uptrend, but an hourly chart within that daily trend could be experiencing a temporary pullback (downtrend on the hourly). Trading with the higher timeframe trend is often more reliable. :::
Ranging Markets: The Sideways Grind
A ranging (or sideways) market is characterized by prices oscillating within a defined horizontal channel or band. In this regime, neither buyers nor sellers are dominant, leading to a period of consolidation, indecision, or accumulation/distribution.
Characteristics of a Ranging Market:
- Lack of Clear Direction: Prices move horizontally without significant upward or downward momentum.
- Support and Resistance: Prices tend to bounce between identifiable horizontal support and resistance levels.
- Lower Volume: Often, volume decreases as indecision settles in.
- False Breakouts: Can occur as price attempts to break out of the range but quickly reverses back in.
- Whipsaws: Price action can be choppy and erratic within the range.
Identifying Ranging Markets
1. Price Action: Look for prices repeatedly touching and pulling back from clearly defined horizontal support and resistance levels.
2. Indicators: Oscillators like the Relative Strength Index (RSI), Stochastic Oscillator, or Commodity Channel Index (CCI) are often effective in ranging markets.
- They tend to cycle between overbought and oversold regions, providing potential entry and exit signals at the range boundaries.
3. Bollinger Bands: When Bollinger Bands contract and move horizontally, it can signal a period of low volatility and consolidation, indicative of a ranging market.
:::example Consider a currency pair that has been trading between 1.1000 and 1.1050 for several days. Each time the price approaches 1.1000, it finds support and bounces back up. Conversely, each time it touches 1.1050, it encounters resistance and pulls back down. This continuous bouncing within a tight band signifies a ranging market. An RSI might regularly hit its oversold level at 1.1000 and overbought at 1.1050. :::
:::warning Avoid trend-following strategies during ranging markets. Buying breakouts that fail to materialize can lead to repeated stop-outs and frustration. Focus on mean-reversion or range-bound strategies. :::
Volatile Markets: Navigating the Storm
A volatile market is characterized by large, rapid, and often unpredictable price swings. Volatility can occur in either trending or ranging markets, but its defining feature is the magnitude and speed of price changes. High volatility is often triggered by major economic news releases, geopolitical events, or unexpected shifts in market sentiment.
Characteristics of a Volatile Market:
- Large Price Swings: Significant movements up and down in short periods.
- Wide Ranges: Daily or intraday ranges are much larger than usual.
- Increased Volume: Often accompanied by spikes in trading volume as participants react to news or uncertainty.
- Breakouts: Can lead to strong, sustained breakouts from established patterns or ranges.
- Gap Ups/Downs: Price gaps are more common during highly volatile periods.
- Emotional Trading: Often driven by fear or greed, leading to irrational price movements.
Identifying Volatile Markets
1. Average True Range (ATR): The ATR indicator is specifically designed to measure volatility. Higher ATR values indicate higher volatility.
2. Bollinger Bands: Widening Bollinger Bands suggest an increase in volatility.
3. Price Action: Simply observing the size of candlestick bodies and the length of their wicks can provide clues. Large bodies and long wicks are typical of volatile conditions.
4. News Calendar: Anticipate volatility around major economic announcements (e.g., central bank interest rate decisions, inflation reports, employment figures).
:::example Imagine a stock that typically moves $1-$2 per day suddenly starts exhibiting $5-$10 daily swings, often gapping up or down significantly at the open. The ATR indicator skyrockets, and Bollinger Bands expand dramatically. This wild price action, possibly driven by an unexpected earnings report or a major industry announcement, indicates a highly volatile market. Traditional stop-loss levels might be easily triggered, requiring adjustments. :::
:::tip Volatile markets can offer significant profit opportunities due to large movements, but they also come with heightened risk. Smaller position sizes and wider stop losses might be necessary if you choose to trade in these conditions. :::
Adapting Your Strategy to Each Regime
Successful trading is less about having one "holy grail" strategy and more about skillfully adapting your approach to the prevailing market conditions.
1. Strategies for Trending Markets
- Trend Following: Aim to enter positions in the direction of the trend, typically after a pullback or consolidation.
- Entry: Look for entries at or near dynamic support (in an uptrend) or dynamic resistance (in a downtrend) provided by moving averages or trendlines.
- Exit: Use trailing stops to protect profits as the trend continues, or target a move to a significant higher timeframe resistance/support level.
- Tools: Moving Averages, MACD, ADX (for trend strength), Momentum indicators.
:::example Uptrend Trading: You identify an uptrend on the daily chart of a commodity. Price pulls back to its 20-period Exponential Moving Average (EMA). On lower timeframes, you observe a bullish engulfing candlestick pattern forming right at the EMA. You enter a long position, placing a stop loss below the recent swing low and trailing your take profit as the trend extends. :::
2. Strategies for Ranging Markets
- Mean Reversion/Range Trading: Buy at support and sell at resistance within the established horizontal channel.
- Entry: Enter long near support, short near resistance. Look for reversal candlestick patterns or oscillator confirmations (oversold at support, overbought at resistance).
- Exit: Target the opposite boundary of the range. Place stop losses just outside the range boundaries to manage risk of a breakout.
- Tools: Oscillators (RSI, Stochastic), Support and Resistance levels, Bollinger Bands.
:::example Range Trading Reversal: A stock is clearly ranging between $48 and $52. Price approaches $52, and the RSI indicates overbought conditions. You observe a bearish pin bar candlestick forming at the $52 resistance level. You initiate a short trade, setting a stop loss just above $52 and a take profit target at $48. :::
3. Strategies for Volatile Markets
- Breakout Trading (with caution): Trade strong, confirmed breakouts from previous ranges or consolidation patterns. High volatility can give breakouts the fuel they need.
- News Trading: Speculate on the immediate reaction to major economic news. This is advanced and requires quick execution and robust risk management.
- Volatility Contraction and Expansion: Look for periods of low volatility (often preceding a range) as signals for potential high-volatility breakouts.
- Risk Management: Use wider stop losses or smaller position sizes to account for larger price swings.
- Tools: ATR, Bollinger Bands, Volume indicators, understanding of economic calendars.
:::example Post-News Breakout: Prior to a major central bank announcement, a currency pair is consolidating in a tight range with contracting Bollinger Bands. Immediately after the announcement, price strongly breaks above the range with massive volume, opening a series of large bullish candlesticks. Agile traders might enter long on the confirmed breakout, aiming for significant quick profits, but with a carefully placed stop and smaller size. :::
Conclusion: The Art of Adaptation
Understanding and adapting to different market regimes is not just a valuable skill; it is a fundamental pillar of successful trading. The market is a living, breathing entity, constantly shifting between periods of trend, consolidation, and heightened volatility. Attempting to apply a single, rigid strategy across all conditions is akin to using a hammer to fix every problem – sometimes you need a screwdriver, or even a wrench.
By diligently identifying whether the market is trending, ranging, or volatile, you empower yourself to select the most appropriate strategies, manage risk effectively, and ultimately, increase your probabilities of success. This adaptive mindset allows you to flow with the market, rather than fight against its powerful currents.
Continuously monitor price action, utilize your technical indicators wisely, and always consider the broader economic context. The ability to pivot your approach as the market transitions from one regime to another is a hallmark of an experienced and profitable trader.
Now that you've grasped the concepts of market regimes, it's time to put this knowledge into practice. Open your charts, analyze various assets across different timeframes, and actively identify periods of trending, ranging, and volatile action. Observe how different strategies would have performed in each regime. This hands-on analysis will solidify your understanding and refine your ability to navigate the ever-evolving financial markets.