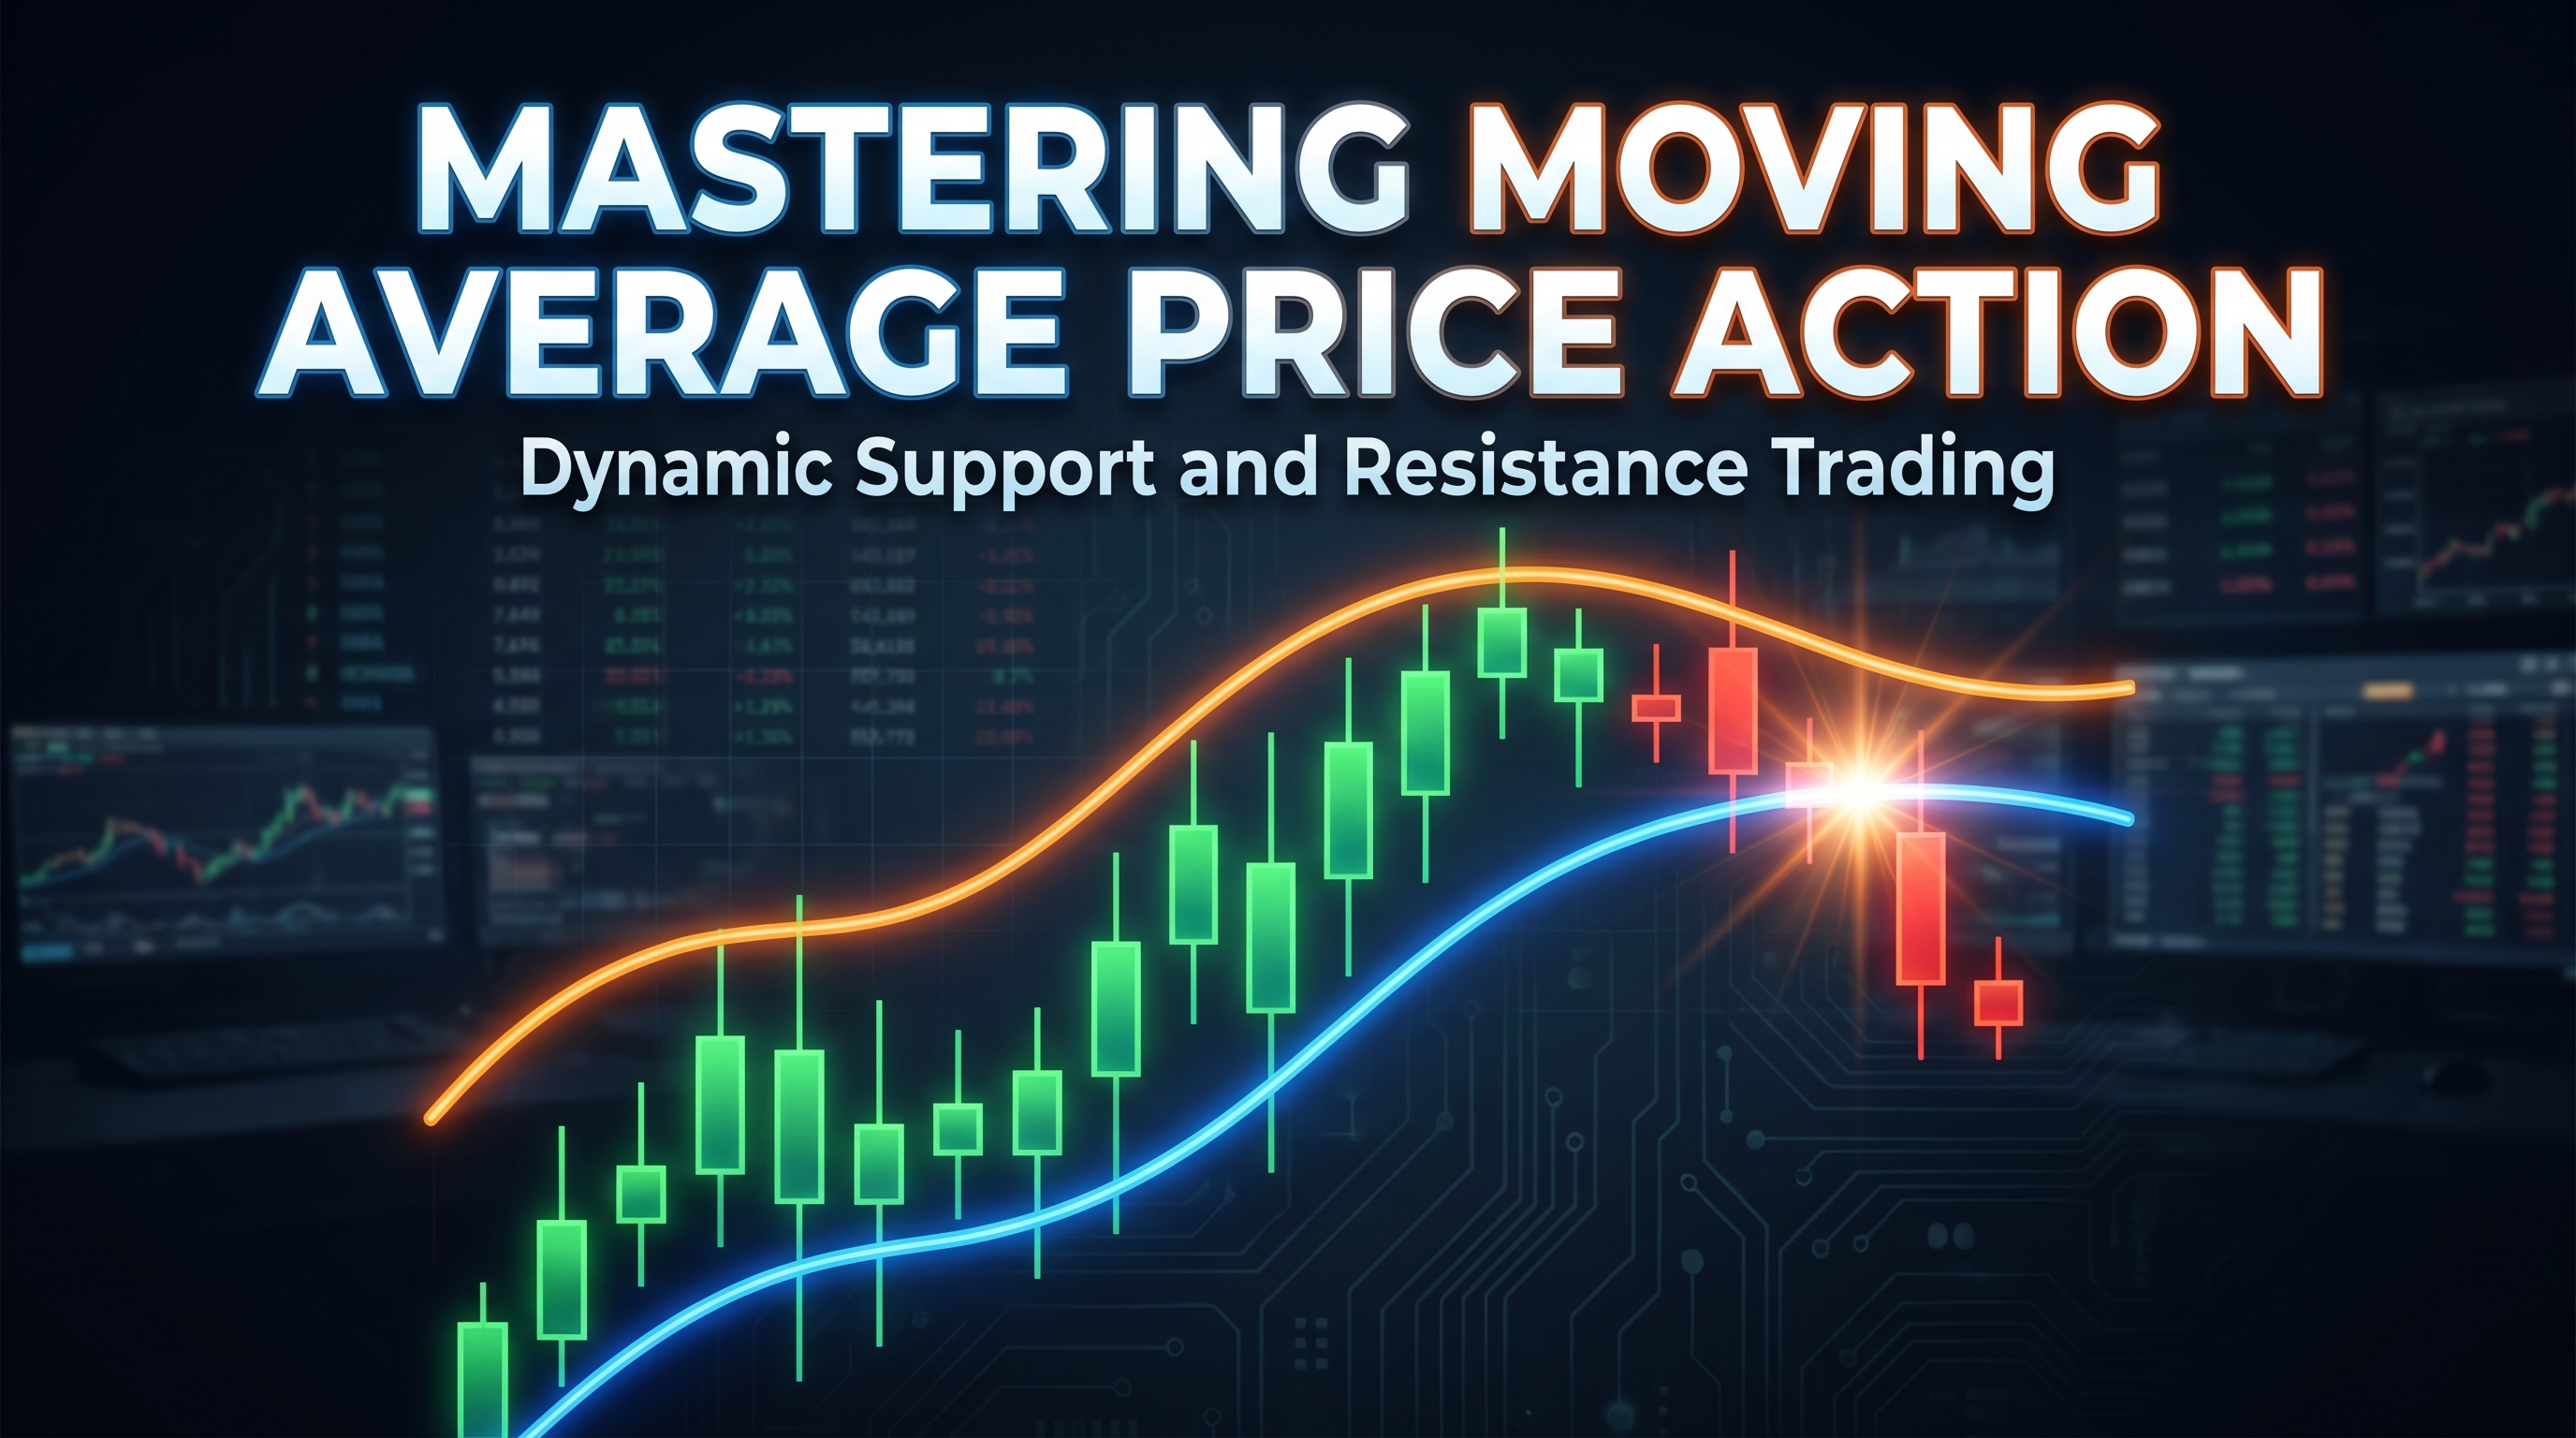
# Mastering Moving Average Price Action: Dynamic Support and Resistance Trading
Moving averages are among the most fundamental and versatile tools in technical analysis, yet many traders underutilize their true potential as dynamic support and resistance levels. Unlike static horizontal lines, moving averages adapt to price movement, creating flexible boundaries that can provide exceptional trading opportunities when properly understood.
In this comprehensive guide, we'll explore how to harness moving average price action to identify high-probability trade setups, understand market sentiment shifts, and improve your overall trading performance. Whether you're a beginner learning the basics or an experienced trader looking to refine your approach, mastering these concepts will significantly enhance your market analysis capabilities.
Table of Contents
- [Understanding Dynamic Support and Resistance](#understanding-dynamic-support-and-resistance)
- [Key Moving Averages for Price Action Trading](#key-moving-averages-for-price-action-trading)
- [Reading Price Reactions at Moving Averages](#reading-price-reactions-at-moving-averages)
- [Trading Strategies Using Moving Average Price Action](#trading-strategies-using-moving-average-price-action)
- [Advanced Techniques and Market Context](#advanced-techniques-and-market-context)
- [Conclusion](#conclusion)
Understanding Dynamic Support and Resistance
Traditional support and resistance levels are fixed horizontal lines based on previous highs and lows. While these remain important, moving averages offer something unique: they evolve with price movement, creating dynamic levels that adjust to changing market conditions.
:::key-concept Dynamic support and resistance levels move with price trends, providing adaptive reference points that reflect current market sentiment and momentum. :::
When price is above a moving average, that average typically acts as dynamic support. Conversely, when price trades below a moving average, it often functions as dynamic resistance. This relationship creates a framework for understanding market structure and identifying potential reversal points.
The Psychology Behind Moving Average Interactions
Moving average price action reflects the collective psychology of market participants. When price approaches a significant moving average from above, it represents a test of bullish sentiment. If buyers step in at this level, it confirms the uptrend's strength. If price breaks below, it suggests weakening momentum and potential trend change.
Similarly, when price approaches a moving average from below during a downtrend, it tests whether sellers maintain control. A rejection at this level confirms bearish sentiment, while a break above might signal trend exhaustion or reversal.
:::example Consider a stock in an uptrend trading above its 20-period moving average. Each time price pulls back to test this level and bounces higher, it demonstrates that buyers value the security at these prices, reinforcing the moving average's role as dynamic support. :::
Key Moving Averages for Price Action Trading
Different moving average periods serve distinct purposes in price action analysis. Understanding these roles helps you select the most appropriate averages for your trading timeframe and strategy.
Short-Term Moving Averages (8-21 periods)
These responsive averages closely follow price movement and are excellent for:
- Identifying immediate trend direction
- Short-term support and resistance levels
- Entry and exit signals for day trading
- Quick trend changes and momentum shifts
The 20-period moving average is particularly popular among swing traders, as it often provides reliable dynamic support in trending markets while remaining sensitive enough to signal changes in momentum.
Medium-Term Moving Averages (50-100 periods)
These averages balance responsiveness with stability, making them ideal for:
- Intermediate trend identification
- Swing trading reference points
- Market structure analysis
- Confirming longer-term directional bias
The 50-period moving average is widely watched by institutional traders and often acts as a significant battleground between bulls and bears.
Long-Term Moving Averages (200+ periods)
These slow-moving averages provide:
- Major trend identification
- Long-term investment guidance
- Key psychological levels
- Market regime changes
The 200-period moving average is considered the gold standard for distinguishing between bull and bear markets across various asset classes.
:::tip Using multiple timeframes with complementary moving averages provides a comprehensive view of market structure. For example, combine a 20-period MA for short-term bias with a 50-period MA for intermediate trend confirmation. :::
Reading Price Reactions at Moving Averages
Success with moving average price action requires developing the ability to interpret how price behaves when it encounters these dynamic levels. Different types of reactions provide valuable insights into market sentiment and future price direction.
Strong Bounces and Rejections
When price approaches a moving average and immediately reverses with strong momentum, it indicates:
- Respect for the dynamic level
- Strong directional bias in the underlying trend
- High probability continuation setups
These reactions often occur with increased volume and create excellent risk-reward opportunities for trend-following trades.
Weak Reactions and Consolidation
Price that hovers around a moving average or shows weak reactions suggests:
- Indecision in the market
- Potential trend weakening
- Consolidation before the next move
These situations require patience and often benefit from waiting for a clear break and retest before entering positions.
Clean Breaks and Follow-Through
When price decisively breaks through a significant moving average with volume, it often signals:
- Trend change or acceleration
- Shift in market sentiment
- New trading opportunities in the breakout direction
:::warning False breaks are common, especially during low-volume periods or around major news events. Always wait for confirmation before assuming a trend change is legitimate. :::
Multiple Moving Average Interactions
When price interacts with multiple moving averages simultaneously, the confluence creates stronger support or resistance zones. These areas often produce the most reliable trading signals and offer better risk-reward ratios.
:::example A pullback in an uptrend that finds support right at the intersection of the 20-period and 50-period moving averages creates a high-confidence buying opportunity, as it represents multiple layers of potential support. :::
Trading Strategies Using Moving Average Price Action
Now that we understand how price interacts with moving averages, let's explore specific strategies that capitalize on these relationships.
The Moving Average Bounce Strategy
This strategy focuses on buying bounces off moving average support in uptrends or selling rejections from moving average resistance in downtrends.
Entry Criteria: 1. Identify a clear trend using longer-term moving averages 2. Wait for price to pull back to a key shorter-term moving average 3. Look for signs of rejection (reversal candlestick patterns, volume increase) 4. Enter in the direction of the main trend
Risk Management:
- Place stop loss slightly beyond the moving average
- Target previous highs/lows or use trailing stops
- Position size based on the distance to your stop loss
The Moving Average Crossover Breakout
This approach combines moving average price action with traditional breakout principles.
Setup Requirements: 1. Price consolidates around a significant moving average 2. Volume decreases during consolidation 3. Price breaks cleanly above/below the moving average 4. Volume expands on the breakout
Execution Steps: 1. Wait for the initial break 2. Look for a retest of the broken moving average 3. Enter when price shows rejection at the retest 4. Use the moving average as your dynamic stop loss
:::tip The retest entry often provides better risk-reward ratios than entering on the initial break, as it allows for tighter stop placement and confirms the breakout's validity. :::
The Multiple Moving Average Filter System
This comprehensive approach uses several moving averages to create a robust trading framework.
Components:
- Fast MA (20-period): Entry signals and short-term bias
- Medium MA (50-period): Intermediate trend filter
- Slow MA (200-period): Long-term trend direction
Trading Rules: 1. Only take long trades when price is above all moving averages 2. Only take short trades when price is below all moving averages 3. Use the fast MA for entries and exits 4. Exit when moving averages begin to converge
Trend Continuation Patterns
Moving average price action excels at identifying continuation patterns within established trends.
Flag and Pennant Continuations:
- Trend moves away from moving average
- Brief consolidation back toward the moving average
- Breakout continuation in the original direction
Pullback Continuations:
- Strong trend movement
- Orderly pullback to moving average support/resistance
- Resumption of the original trend
Advanced Techniques and Market Context
To truly master moving average price action, you must consider broader market context and employ advanced analytical techniques.
Market Structure Integration
Combining moving average analysis with market structure concepts enhances trading precision:
- Higher highs and higher lows in uptrends
- Lower highs and lower lows in downtrends
- Moving averages as structure confirmation tools
When moving average price action aligns with market structure, it creates high-probability setups with excellent risk-reward profiles.
Volume Confirmation
Volume analysis adds crucial context to moving average interactions:
- High volume on bounces confirms strength
- Low volume on tests suggests weakness
- Volume spikes on breaks validate breakouts
:::key-concept Moving average price action becomes significantly more reliable when confirmed by appropriate volume patterns. :::
Time-Based Considerations
Different market sessions and time periods affect how price interacts with moving averages:
- Opening gaps and moving average reactions
- Session-specific volume patterns
- Weekly and monthly moving average significance
Multi-Timeframe Analysis
Analyzing moving average price action across multiple timeframes provides comprehensive market perspective:
1. Higher timeframe for trend direction 2. Lower timeframe for precise entries 3. Confluence of signals across timeframes
Risk Management Excellence
Advanced moving average price action trading requires sophisticated risk management:
Position Sizing:
- Calculate position size based on moving average distance
- Adjust for volatility and market conditions
- Consider correlation across positions
Stop Loss Placement:
- Use moving averages as dynamic stops
- Allow for normal price fluctuations
- Adjust stops as moving averages evolve
Profit Taking:
- Scale out at key resistance levels
- Use trailing stops with moving averages
- Recognize when moving average structure breaks down
:::warning Never risk more than you can afford to lose on any single trade, regardless of how confident you are in the moving average setup. :::
Adapting to Different Market Conditions
Moving average price action effectiveness varies with market conditions:
Trending Markets:
- Moving averages provide excellent dynamic levels
- Bounce strategies work exceptionally well
- Clear directional bias enhances success rates
Ranging Markets:
- Moving averages may provide false signals
- Focus on longer-term averages for guidance
- Wait for clear breakouts before committing capital
Volatile Markets:
- Use wider stops to account for noise
- Focus on higher timeframe moving averages
- Reduce position sizes to manage risk
Conclusion
Mastering moving average price action transforms your trading by providing a dynamic, adaptive framework for understanding market behavior. Unlike static support and resistance levels, moving averages evolve with price movement, offering real-time insights into market sentiment and trend strength.
The key to success lies in understanding that moving averages are not just mathematical calculations—they represent the collective psychology of market participants at different time horizons. When price respects these levels, it confirms the underlying trend's strength. When price decisively breaks through, it signals potential changes in market structure.
Remember these critical points as you develop your moving average price action skills:
- Context is everything: Always consider broader market structure and multiple timeframes
- Volume confirms price action: Look for volume confirmation on key moving average interactions
- Risk management comes first: Use moving averages to define risk, not just entries
- Practice builds intuition: Spend time observing how different assets react to various moving averages
- Adapt to conditions: Modify your approach based on whether markets are trending, ranging, or volatile
Moving average price action provides a foundation for consistent trading success, but it requires patience, practice, and proper risk management. Start by focusing on one or two key moving averages, master their behavior on your preferred timeframes, and gradually expand your analysis as your skills develop.
Ready to put these concepts into practice? Begin by analyzing your favorite trading instruments and observe how they interact with key moving averages. Look for the patterns discussed in this guide, and start paper trading setups that align with these principles. With dedicated practice and careful observation, you'll develop the intuition needed to successfully trade moving average price action in any market condition.