# Mastering Multi-Indicator Confluence: Advanced Techniques to Avoid Analysis Paralysis
The holy grail of trading isn't found in a single perfect indicator—it lies in the sophisticated art of combining multiple analytical tools to create high-probability trade setups. Yet paradoxically, many experienced traders fall into the trap of indicator overload, where too many signals create confusion rather than clarity.
Professional traders understand that effective multi-indicator analysis requires a disciplined approach to confluence, where each tool serves a specific purpose within a well-defined framework. This guide explores advanced techniques for combining indicators strategically, maintaining analytical clarity while maximizing edge.
Table of Contents
- [The Hierarchy of Market Analysis](#the-hierarchy-of-market-analysis)
- [Strategic Indicator Selection Framework](#strategic-indicator-selection-framework)
- [Professional Confluence Techniques](#professional-confluence-techniques)
- [Advanced Multi-Timeframe Integration](#advanced-multi-timeframe-integration)
- [Risk Management in Multi-Indicator Systems](#risk-management-in-multi-indicator-systems)
- [Implementation and Optimization Strategies](#implementation-and-optimization-strategies)
The Hierarchy of Market Analysis
:::key-concept Professional traders operate with a clear analytical hierarchy: Market Structure > Price Action > Volume > Indicators. This hierarchy prevents indicator dependency and maintains focus on what matters most. :::
Successful multi-indicator trading begins with understanding the fundamental hierarchy of market information. Price action and market structure form the foundation, while indicators serve as confirmation tools rather than primary decision drivers.
Primary Analysis Layer: Market Structure
Market structure encompasses:
- Higher highs and higher lows in uptrends
- Lower highs and lower lows in downtrends
- Key support and resistance levels
- Institutional order blocks and fair value gaps
This structural analysis provides the directional bias that all other indicators must support, not contradict.
Secondary Analysis Layer: Price Action Context
Price action patterns include:
- Candlestick formations at key levels
- Chart patterns (flags, pennants, triangles)
- Breakout and reversal patterns
- Volume-price relationships
Tertiary Analysis Layer: Indicator Confluence
Indicators serve three primary functions: 1. Trend confirmation (moving averages, MACD) 2. Momentum assessment (RSI, Stochastic) 3. Volatility measurement (Bollinger Bands, ATR)
:::warning Never let indicators override clear price action signals. If price action suggests one direction but indicators suggest another, always defer to price action while investigating the divergence. :::
Strategic Indicator Selection Framework
Professional indicator selection follows a systematic approach that ensures each tool adds unique value without redundancy.
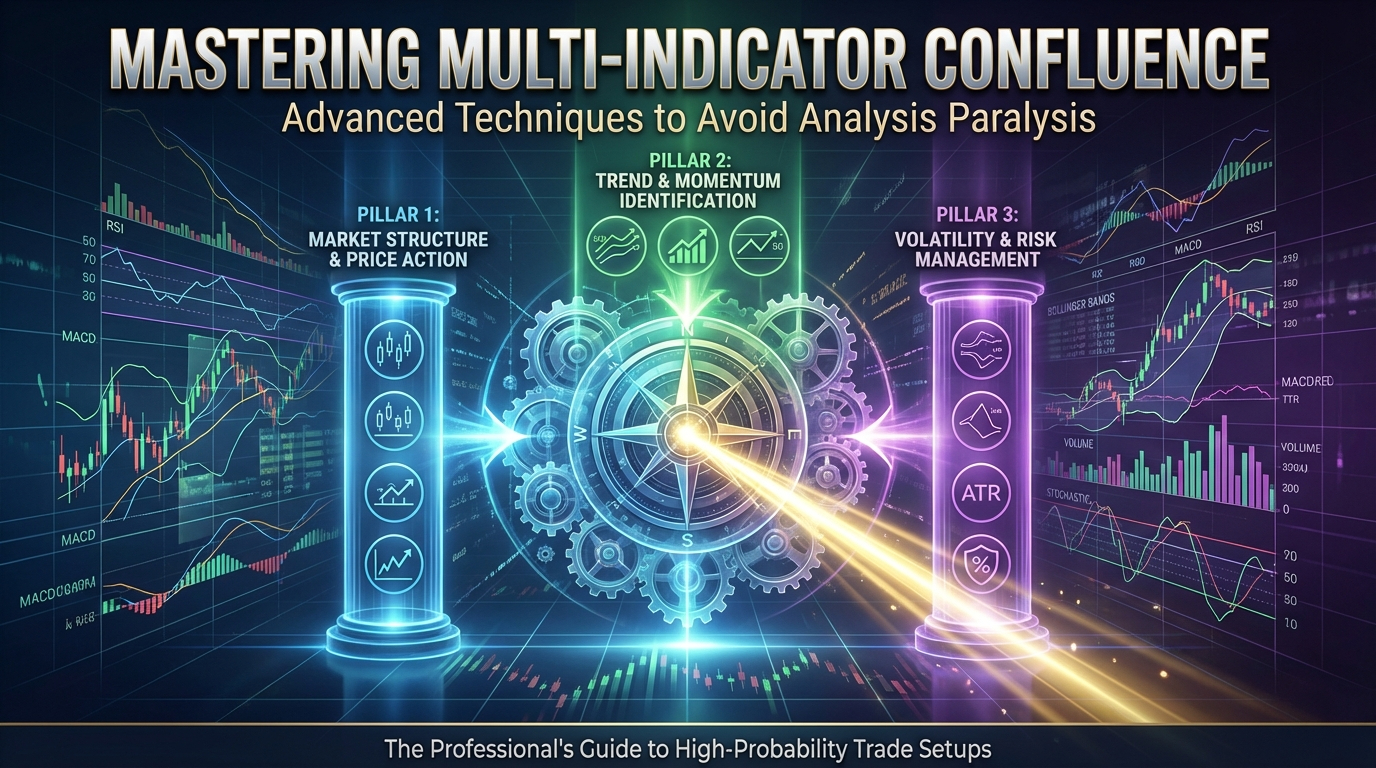
The Three-Pillar Approach
Pillar 1: Trend Identification
- Primary: 20/50/200 EMA alignment
- Secondary: MACD histogram
- Tertiary: ADX for trend strength
Pillar 2: Momentum Analysis
- Primary: RSI (14) for overbought/oversold conditions
- Secondary: Stochastic for precise entry timing
- Tertiary: Williams %R for additional confirmation
Pillar 3: Volatility Assessment
- Primary: ATR for position sizing
- Secondary: Bollinger Bands for volatility breakouts
- Tertiary: VIX (for equity traders) for market sentiment
:::tip Limit yourself to one primary indicator per pillar, with secondary indicators used only for high-conviction setups. This prevents analysis paralysis while maintaining comprehensive market coverage. :::
Indicator Correlation Matrix
Before combining indicators, analyze their correlation to avoid redundancy:
High Correlation (Avoid Combining):
- RSI + Stochastic + Williams %R (all momentum oscillators)
- Multiple moving averages with similar periods
- MACD + Price Rate of Change (both momentum indicators)
Low Correlation (Effective Combinations):
- Moving averages + RSI (trend + momentum)
- Bollinger Bands + MACD (volatility + momentum)
- Volume indicators + price oscillators
Dynamic Indicator Adaptation
Market conditions require adaptive indicator selection:
Trending Markets:
- Emphasize trend-following indicators
- Reduce weight on oscillators
- Focus on moving average alignment
Range-bound Markets:
- Prioritize oscillators (RSI, Stochastic)
- Use Bollinger Bands for mean reversion
- Minimize trend indicator influence
High Volatility Periods:
- Increase ATR-based position sizing
- Widen indicator parameters
- Focus on volume confirmation
Professional Confluence Techniques
True confluence occurs when multiple independent analytical methods align to support the same trading decision. Professional traders use specific techniques to identify and validate confluence.
The 3-2-1 Confluence Rule
For high-probability trades, seek:
- 3 confirming signals from different indicator categories
- 2 timeframe alignment (higher and lower timeframes)
- 1 clear risk management plan with defined exit strategy
:::example Example Confluence Setup: 1. Market Structure: Price breaking above previous swing high (bullish) 2. Price Action: Bullish engulfing candle at support level 3. Trend Indicator: Price above 20/50 EMA with EMA alignment 4. Momentum: RSI breaking above 50 from oversold territory 5. Volume: Above-average volume on breakout
This setup demonstrates confluence across structure, price action, trend, momentum, and volume—creating high probability for success. :::
Sequential Confirmation Process
Step 1: Structural Analysis
- Identify market structure bias
- Locate key support/resistance levels
- Determine institutional order flow areas
Step 2: Price Action Validation
- Wait for price action confirmation at key levels
- Assess candlestick patterns and formations
- Evaluate volume confirmation
Step 3: Indicator Alignment
- Check trend indicator alignment
- Assess momentum indicator positioning
- Evaluate volatility conditions
Step 4: Multi-Timeframe Verification
- Confirm higher timeframe trend
- Verify lower timeframe entry precision
- Assess overall market context
Advanced Confluence Patterns
The Trinity Setup:
- Technical confluence: Support/resistance + chart pattern
- Indicator confluence: Trend + momentum alignment
- Time confluence: Key market session or economic event
The Institutional Mirror:
- Smart money accumulation: Volume spike at support
- Technical breakout: Pattern completion
- Momentum confirmation: Indicator alignment
:::key-concept Professional traders wait for confluence rather than forcing trades. Patience in waiting for multiple confirming factors significantly improves win rates and risk-adjusted returns. :::
Advanced Multi-Timeframe Integration
Multi-timeframe analysis prevents indicators from providing conflicting signals by establishing clear hierarchical relationships between different time perspectives.
Timeframe Hierarchy Structure
Higher Timeframe (HTF) - Trend Direction:
- Daily/Weekly charts for overall market bias
- Primary trend indicators: 200 EMA, weekly MACD
- Structural levels: Major support/resistance
Intermediate Timeframe (ITF) - Setup Identification:
- 4-hour/1-hour charts for trade setup analysis
- Pattern recognition: Flags, pennants, triangles
- Confluence confirmation: Multiple indicator alignment
Lower Timeframe (LTF) - Execution Timing:
- 15-minute/5-minute charts for precise entries
- Entry triggers: Momentum divergence, breakouts
- Risk management: Stop loss placement, initial targets
Multi-Timeframe Indicator Synchronization
Synchronized Moving Averages:
- HTF: 20/50/200 EMA alignment
- ITF: 20/50 EMA for intermediate trend
- LTF: 10/20 EMA for entry timing
Momentum Indicator Cascade:
- HTF: MACD histogram direction
- ITF: RSI trend and level
- LTF: Stochastic for precise timing
:::tip Use the same indicator parameters across timeframes to maintain consistency. This creates a natural hierarchy where higher timeframes guide lower timeframe decisions. :::
Cross-Timeframe Confirmation Strategies
The Top-Down Approach: 1. HTF Analysis: Establish directional bias 2. ITF Setup: Identify high-probability patterns 3. LTF Entry: Time precise entry points 4. Execution: Trade in direction of HTF bias
The Confluence Pyramid:
- Base: HTF trend direction (strongest weight)
- Middle: ITF pattern confirmation (moderate weight)
- Top: LTF timing signals (weakest weight)
This pyramid structure ensures that short-term noise doesn't override longer-term structural trends.
Risk Management in Multi-Indicator Systems
Sophisticated indicator combinations require equally sophisticated risk management approaches that account for the complexity of multi-signal environments.
Position Sizing for Confluence Trades
Confidence-Based Position Sizing:
- High confluence (4+ confirming signals): 2-3% risk per trade
- Moderate confluence (2-3 confirming signals): 1-2% risk per trade
- Low confluence (1-2 confirming signals): 0.5-1% risk per trade
Indicator-Weighted Risk Allocation:
- Trend signals: 40% weight in risk calculation
- Momentum signals: 35% weight in risk calculation
- Volume signals: 25% weight in risk calculation
:::warning Never increase position size just because multiple indicators align. High confluence reduces risk but doesn't eliminate it. Maintain consistent risk management regardless of signal strength. :::
Dynamic Stop Loss Management
Multi-Indicator Stop Loss Levels:
- Primary stop: Based on key support/resistance
- Secondary stop: ATR-based volatility stop
- Tertiary stop: Indicator-based trailing stop
Indicator Exit Strategies:
- Momentum divergence: Partial profit taking
- Trend indicator reversal: Full position exit
- Volume confirmation loss: Immediate exit consideration
Performance Tracking and Optimization
Individual Indicator Performance:
- Track win rate for each indicator independently
- Measure contribution to overall profitability
- Identify which indicators add versus subtract value
Confluence Performance Metrics:
- 2-indicator confluence: Win rate and average return
- 3-indicator confluence: Risk-adjusted performance
- 4+ indicator confluence: Frequency and reliability
:::example Performance Tracking Example:
- RSI + MACD confluence: 68% win rate, 1.8:1 reward-to-risk
- EMA + Volume confluence: 72% win rate, 1.6:1 reward-to-risk
- Three-indicator confluence: 78% win rate, 2.1:1 reward-to-risk
This data reveals that three-indicator confluence provides optimal risk-adjusted returns for this trader's strategy. :::
Implementation and Optimization Strategies
Transitioning from theory to practical application requires systematic implementation and continuous optimization of multi-indicator approaches.
Systematic Implementation Process
Phase 1: Foundation Building (Weeks 1-2)
- Select primary indicators for each analytical pillar
- Establish clear hierarchy and weighting system
- Define confluence requirements for trade entry
Phase 2: Integration Testing (Weeks 3-4)
- Test indicator combinations on historical data
- Identify optimal parameter settings
- Validate multi-timeframe synchronization
Phase 3: Live Implementation (Weeks 5-8)
- Begin with smaller position sizes
- Track performance metrics meticulously
- Adjust parameters based on real market feedback
Phase 4: Optimization (Weeks 9-12)
- Refine indicator selection based on performance data
- Optimize confluence requirements
- Implement advanced risk management features
Technology and Tools Integration
Professional Trading Platforms:
- TradingView: Advanced charting and indicator customization
- MetaTrader: Expert advisor automation capabilities
- NinjaTrader: Professional-grade backtesting and optimization
Custom Indicator Development:
- Confluence dashboards: Visual representation of signal alignment
- Multi-timeframe indicators: Synchronized cross-timeframe analysis
- Risk management overlays: Automated position sizing and stop management
Performance Analysis Tools:
- Trade journaling software: Detailed performance tracking
- Statistical analysis packages: Advanced performance metrics
- Backtesting platforms: Historical validation and optimization
Continuous Improvement Framework
Monthly Performance Reviews:
- Analyze individual indicator contribution
- Assess confluence pattern effectiveness
- Identify market condition adaptations needed
Quarterly Strategy Adjustments:
- Update indicator parameters for changing market conditions
- Modify confluence requirements based on performance data
- Implement new indicators or remove underperforming ones
Annual Comprehensive Evaluation:
- Complete system overhaul assessment
- Technology upgrade considerations
- Strategic direction adjustments
:::tip Maintain detailed records of all parameter changes and their performance impact. This historical data becomes invaluable for future optimization efforts and helps identify what works across different market cycles. :::
Advanced Optimization Techniques
Machine Learning Integration:
- Pattern recognition: Automated confluence pattern identification
- Parameter optimization: AI-driven indicator parameter selection
- Adaptive weighting: Dynamic indicator weight adjustment based on performance
Market Regime Classification:
- Trending market parameters: Optimized for trend-following strategies
- Range-bound market parameters: Optimized for mean reversion approaches
- High volatility parameters: Adjusted for increased market uncertainty
Cross-Market Analysis:
- Correlation analysis: Understanding indicator performance across different markets
- Sector rotation: Adapting indicator combinations for sector-specific trading
- Currency pair optimization: Forex-specific indicator tuning
Conclusion
Mastering multi-indicator confluence represents the evolution from amateur to professional trading analysis. The key lies not in using more indicators, but in using them more intelligently through systematic selection, hierarchical organization, and continuous optimization.
Successful implementation requires patience, discipline, and a commitment to data-driven decision making. Remember that indicators are tools to support your analysis, not replace your critical thinking. The market's complexity demands sophisticated analytical approaches, but that sophistication must be balanced with practical application and clear execution.
The most successful traders understand that confluence is about quality, not quantity. Three well-chosen, properly weighted indicators will consistently outperform ten randomly selected ones. Focus on building robust systems that can adapt to changing market conditions while maintaining their core analytical integrity.
As you implement these advanced techniques, remember that consistency in application is more valuable than perfection in selection. Develop your confluence methodology systematically, test it rigorously, and refine it continuously based on real market feedback.
Start applying these professional confluence techniques to your chart analysis today. Begin with the three-pillar framework, implement the sequential confirmation process, and gradually build toward more sophisticated multi-timeframe integration. Your journey toward mastering multi-indicator confluence starts with your next trade analysis.