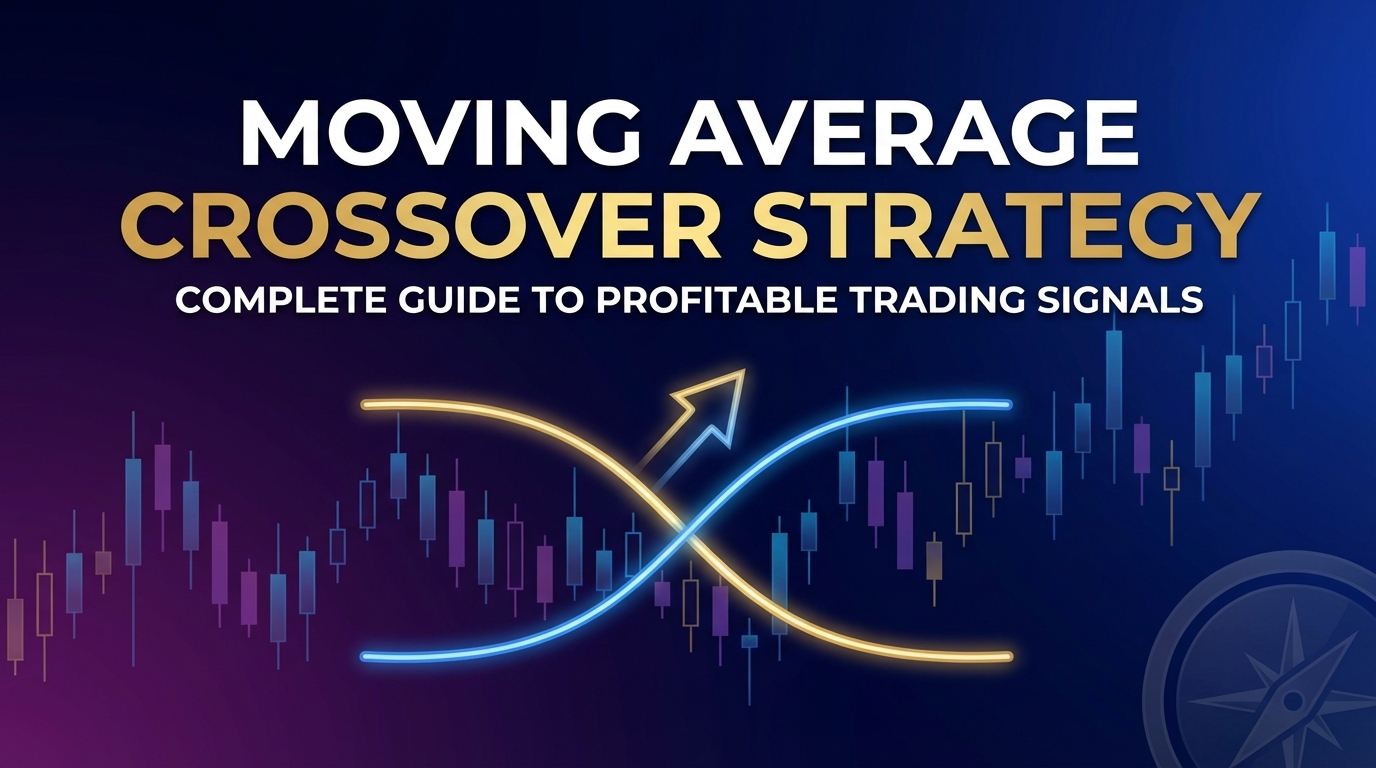
# Moving Average Crossover Strategy: Complete Guide to Profitable Trading Signals
The moving average crossover strategy stands as one of the most fundamental and widely-used trading approaches in financial markets. This time-tested technique has helped countless traders identify trend changes and capture significant price movements across stocks, forex, commodities, and cryptocurrencies. Whether you're a beginner seeking your first reliable trading strategy or an experienced trader looking to refine your approach, understanding moving average crossovers is essential for trading success.
This comprehensive guide will walk you through everything you need to know about implementing moving average crossover strategies, from basic concepts to advanced optimization techniques. You'll discover how to identify high-probability setups, manage risk effectively, and avoid common pitfalls that trap many traders.
Table of Contents
- [Understanding Moving Averages and Crossovers](#understanding-moving-averages-and-crossovers)
- [Types of Moving Average Crossover Strategies](#types-of-moving-average-crossover-strategies)
- [Setting Up Your Moving Average Crossover System](#setting-up-your-moving-average-crossover-system)
- [Entry and Exit Rules for Maximum Profitability](#entry-and-exit-rules-for-maximum-profitability)
- [Risk Management and Position Sizing](#risk-management-and-position-sizing)
- [Common Mistakes and How to Avoid Them](#common-mistakes-and-how-to-avoid-them)
- [Advanced Optimization Techniques](#advanced-optimization-techniques)
- [Conclusion](#conclusion)
Understanding Moving Averages and Crossovers
:::key-concept A moving average crossover occurs when a faster (shorter period) moving average crosses above or below a slower (longer period) moving average, potentially signaling a change in trend direction. :::
Moving averages smooth out price data by creating a constantly updated average price over a specific time period. When plotted on a chart, they help traders identify the underlying trend direction and potential reversal points. The crossover strategy leverages the relationship between two or more moving averages to generate trading signals.
How Moving Average Crossovers Work
The fundamental principle behind crossover strategies is that shorter-period moving averages react more quickly to price changes than longer-period averages. When the faster moving average crosses above the slower one, it suggests upward momentum is building. Conversely, when the faster average crosses below the slower one, it indicates potential downward pressure.
:::example Consider a EUR/USD chart with a 20-period and 50-period exponential moving average. When the 20 EMA crosses above the 50 EMA, it generates a bullish signal suggesting the pair may trend higher. When the 20 EMA crosses below the 50 EMA, it produces a bearish signal indicating potential downward movement. :::
Types of Moving Averages
Before diving into crossover strategies, it's crucial to understand the different types of moving averages:
- Simple Moving Average (SMA): Calculates the arithmetic mean of closing prices over a specified period
- Exponential Moving Average (EMA): Gives more weight to recent prices, making it more responsive to current market conditions
- Weighted Moving Average (WMA): Assigns different weights to price data, typically giving more importance to recent prices
Most traders prefer EMAs for crossover strategies due to their responsiveness, though SMAs can work well for longer-term approaches.
Types of Moving Average Crossover Strategies
Dual Moving Average Crossover
The most common crossover strategy uses two moving averages of different periods. Popular combinations include:
- Short-term: 5 EMA and 13 EMA (for scalping and day trading)
- Medium-term: 20 EMA and 50 EMA (for swing trading)
- Long-term: 50 SMA and 200 SMA (for position trading)
:::tip The Golden Cross (50-day MA crossing above 200-day MA) and Death Cross (50-day MA crossing below 200-day MA) are legendary signals among long-term investors, often marking major trend changes in stock indices. :::
Triple Moving Average Crossover
This advanced variation uses three moving averages to filter signals and reduce false breakouts. A typical setup might use 5, 13, and 21 EMAs, where:
- All three averages must align in the same direction for trend confirmation
- Entry occurs when the fastest average crosses the middle average in trending markets
- The slowest average acts as dynamic support or resistance
Moving Average Ribbon
This approach uses multiple moving averages (typically 6-8) with incrementally increasing periods. When all averages fan out in the same direction, it confirms a strong trend. Convergence of the ribbon often signals consolidation or potential reversal.
Setting Up Your Moving Average Crossover System
Choosing the Right Time Frame
Your trading style determines the optimal time frame for crossover strategies:
- Scalping: 1-minute to 5-minute charts with fast EMAs (5/13 or 8/21)
- Day Trading: 15-minute to 1-hour charts with medium EMAs (20/50)
- Swing Trading: 4-hour to daily charts with balanced EMAs (50/100)
- Position Trading: Daily to weekly charts with slow SMAs (100/200)
:::warning Lower time frames generate more signals but also more false signals. Higher time frames produce fewer but typically more reliable signals. Match your time frame to your available trading time and risk tolerance. :::
Optimal Moving Average Periods
While no "perfect" combination exists, extensive backtesting has revealed several effective pairs:
For Trending Markets:
- 12 EMA / 26 EMA (MACD default)
- 21 EMA / 50 EMA
- 50 SMA / 200 SMA
For Volatile Markets:
- 8 EMA / 34 EMA
- 13 EMA / 55 EMA
For Smooth Markets:
- 20 SMA / 50 SMA
- 50 SMA / 100 SMA
Market Selection Considerations
Moving average crossovers work best in trending markets. Consider these factors when selecting instruments:
- Liquidity: Higher liquidity reduces slippage and improves fill quality
- Volatility: Moderate volatility provides good profit potential without excessive noise
- Trending Behavior: Some assets trend better than others; major currency pairs and indices often provide cleaner signals
Entry and Exit Rules for Maximum Profitability
Entry Signal Criteria
Bullish Entry Setup: 1. Fast moving average crosses above slow moving average 2. Price is above both moving averages (confirmation) 3. Volume increases on the crossover (if available) 4. Overall market trend supports the direction
Bearish Entry Setup: 1. Fast moving average crosses below slow moving average 2. Price is below both moving averages (confirmation) 3. Volume increases on the crossover (if available) 4. Overall market trend supports the direction
:::example On a GBP/JPY 4-hour chart, the 21 EMA crosses above the 50 EMA while price breaks above both averages. This creates a high-probability long entry, especially if it occurs after a pullback in an established uptrend. :::
Trade Management Techniques
Stop Loss Placement:
- Conservative: Below/above the slow moving average
- Moderate: Below/above recent swing low/high
- Aggressive: Below/above the fast moving average
Take Profit Strategies: 1. Fixed Risk-Reward: Use 2:1 or 3:1 risk-reward ratios 2. Technical Levels: Exit at resistance/support levels 3. Trailing Stops: Move stop loss with the fast moving average 4. Partial Profits: Take 50% at 2R, let remainder run
Exit Signal Recognition
Signal Deterioration:
- Moving averages begin to flatten
- Price consistently closes on wrong side of fast MA
- Volume decreases significantly
- Conflicting signals from other indicators
Reversal Signals:
- Opposite crossover occurs
- Price breaks key support/resistance
- Momentum indicators diverge
Risk Management and Position Sizing
:::key-concept Risk management is more important than entry signals. Even the best crossover strategy will fail without proper risk controls. :::
Position Sizing Formulas
Fixed Percentage Method:
- Risk 1-2% of account per trade
- Position Size = (Account Balance × Risk %) / Stop Loss Distance
Volatility-Based Sizing:
- Adjust position size based on Average True Range (ATR)
- Smaller positions in high volatility, larger in low volatility
Kelly Criterion:
- Mathematical approach based on win rate and average win/loss
- Formula: f = (bp - q) / b
- Where f = fraction to bet, b = odds, p = win probability, q = loss probability
Advanced Risk Management
Portfolio Heat:
- Never risk more than 6-8% of capital across all open positions
- Correlate position sizes with market correlation
Drawdown Controls:
- Reduce position sizes after consecutive losses
- Take trading breaks after significant drawdowns
- Implement daily/weekly loss limits
Common Mistakes and How to Avoid Them
Mistake 1: Chasing Every Crossover
Problem: Taking every signal without considering market context Solution: Filter signals using:
- Overall trend direction
- Key support/resistance levels
- Market volatility conditions
- Economic calendar events
Mistake 2: Ignoring Market Structure
Problem: Trading against major support/resistance zones Solution:
- Identify key levels before placing trades
- Avoid entries near major economic announcements
- Consider multiple timeframe analysis
Mistake 3: Poor Risk Management
Problem: Inconsistent position sizing and stop loss placement Solution:
- Develop and stick to position sizing rules
- Always define risk before entering
- Use proper stop loss techniques
:::warning The biggest account killers in crossover trading are: overtrading in choppy markets, ignoring proper position sizing, and failing to cut losses quickly when signals deteriorate. :::
Mistake 4: Optimization Trap
Problem: Over-optimizing parameters based on historical data Solution:
- Test strategies on out-of-sample data
- Use walk-forward analysis
- Prefer robust parameters over perfectly optimized ones
Advanced Optimization Techniques
Multi-Timeframe Analysis
Combine crossover signals from different timeframes for higher-probability trades:
- Primary Timeframe: Your main trading timeframe
- Higher Timeframe: For trend direction (4x primary)
- Lower Timeframe: For precise entry timing (1/4 primary)
Example Setup:
- Daily chart: Trend identification using 50/200 SMA
- 4-hour chart: Signal generation using 21/50 EMA
- 1-hour chart: Entry timing and risk management
Confluence Trading
Enhance crossover signals by combining with:
Technical Indicators:
- RSI divergence
- MACD confirmation
- Volume analysis
- Bollinger Band positions
Price Action Elements:
- Candlestick patterns
- Chart patterns
- Support/resistance levels
- Fibonacci retracements
Adaptive Moving Averages
Consider using adaptive moving averages that adjust to market volatility:
- Kaufman's Adaptive Moving Average (KAMA)
- Variable Index Dynamic Average (VIDYA)
- Fractal Adaptive Moving Average (FRAMA)
These can reduce whipsaws during consolidation while maintaining sensitivity during trends.
Machine Learning Enhancement
Advanced traders can apply machine learning to optimize crossover strategies:
- Feature Engineering: Create additional input variables
- Signal Filtering: Use ML models to filter false signals
- Parameter Optimization: Dynamic adjustment of MA periods
- Market Regime Detection: Identify when crossovers work best
:::tip Start with basic crossover strategies and gradually add complexity. The most profitable systems often balance simplicity with effective risk management rather than using overly complex entry rules. :::
Conclusion
The moving average crossover strategy remains a cornerstone of technical analysis for good reason. Its simplicity, versatility, and effectiveness across different markets and timeframes make it an invaluable tool for traders at all levels. However, success with crossover strategies requires more than just identifying when lines cross on a chart.
The key to profitable crossover trading lies in understanding market context, implementing proper risk management, and maintaining realistic expectations. Remember that no strategy works in all market conditions – crossovers excel in trending markets but can generate numerous false signals during consolidation periods.
As you develop your crossover trading approach, focus on:
- Selecting appropriate moving average combinations for your trading style
- Implementing robust risk management and position sizing rules
- Filtering signals using additional technical analysis tools
- Maintaining discipline and emotional control
- Continuously learning and adapting your approach
Success in trading comes from consistent application of sound principles rather than searching for the "holy grail" strategy. The moving average crossover provides an excellent foundation for building a comprehensive trading system, but remember that your ability to manage risk and maintain discipline will ultimately determine your long-term success.
Start by practicing crossover identification on historical charts, then move to paper trading before risking real capital. Focus on quality over quantity – a few high-probability trades often produce better results than numerous mediocre ones.
Ready to master moving average crossovers? Begin by analyzing charts in your preferred market, identifying clear crossover signals, and practicing your entry and exit techniques. Remember, consistent profitability comes from patient execution of well-defined rules, not from trying to catch every market move.