# Multi-Timeframe Analysis for Beginners: Your Complete Trading Guide
Multi-timeframe analysis is one of the most powerful tools in a trader's arsenal, yet many beginners overlook its importance. By examining price action across different time horizons, traders can gain a comprehensive view of market dynamics and make more informed trading decisions. This complete guide will walk you through everything you need to know about multi-timeframe analysis for beginners.
Table of Contents
- [What is Multi-Timeframe Analysis?](#what-is-multi-timeframe-analysis)
- [Why Multi-Timeframe Analysis Matters](#why-multi-timeframe-analysis-matters)
- [Setting Up Your Timeframe Structure](#setting-up-your-timeframe-structure)
- [The Top-Down Analysis Approach](#the-top-down-analysis-approach)
- [Practical Multi-Timeframe Trading Strategies](#practical-multi-timeframe-trading-strategies)
- [Common Mistakes to Avoid](#common-mistakes-to-avoid)
- [Tools and Platforms for Multi-Timeframe Analysis](#tools-and-platforms-for-multi-timeframe-analysis)
- [Putting It All Together](#putting-it-all-together)
What is Multi-Timeframe Analysis?
Multi-timeframe analysis is a trading methodology that involves examining the same financial instrument across different time periods to gain a complete picture of market sentiment and price movement. Instead of relying on just one chart timeframe, traders analyze multiple timeframes simultaneously to identify trends, support and resistance levels, and optimal entry and exit points.
:::key-concept Multi-timeframe analysis for beginners involves studying the same asset on different time horizons - from monthly charts down to minute charts - to understand both the big picture trend and short-term price movements. :::
The core principle behind this approach is that markets move in cycles and trends across different time horizons. What appears as a strong uptrend on a 5-minute chart might actually be a minor pullback within a larger downtrend visible on the daily chart. By understanding these different perspectives, traders can make more educated decisions about when to enter, exit, or avoid trades altogether.
Key Components of Multi-Timeframe Analysis
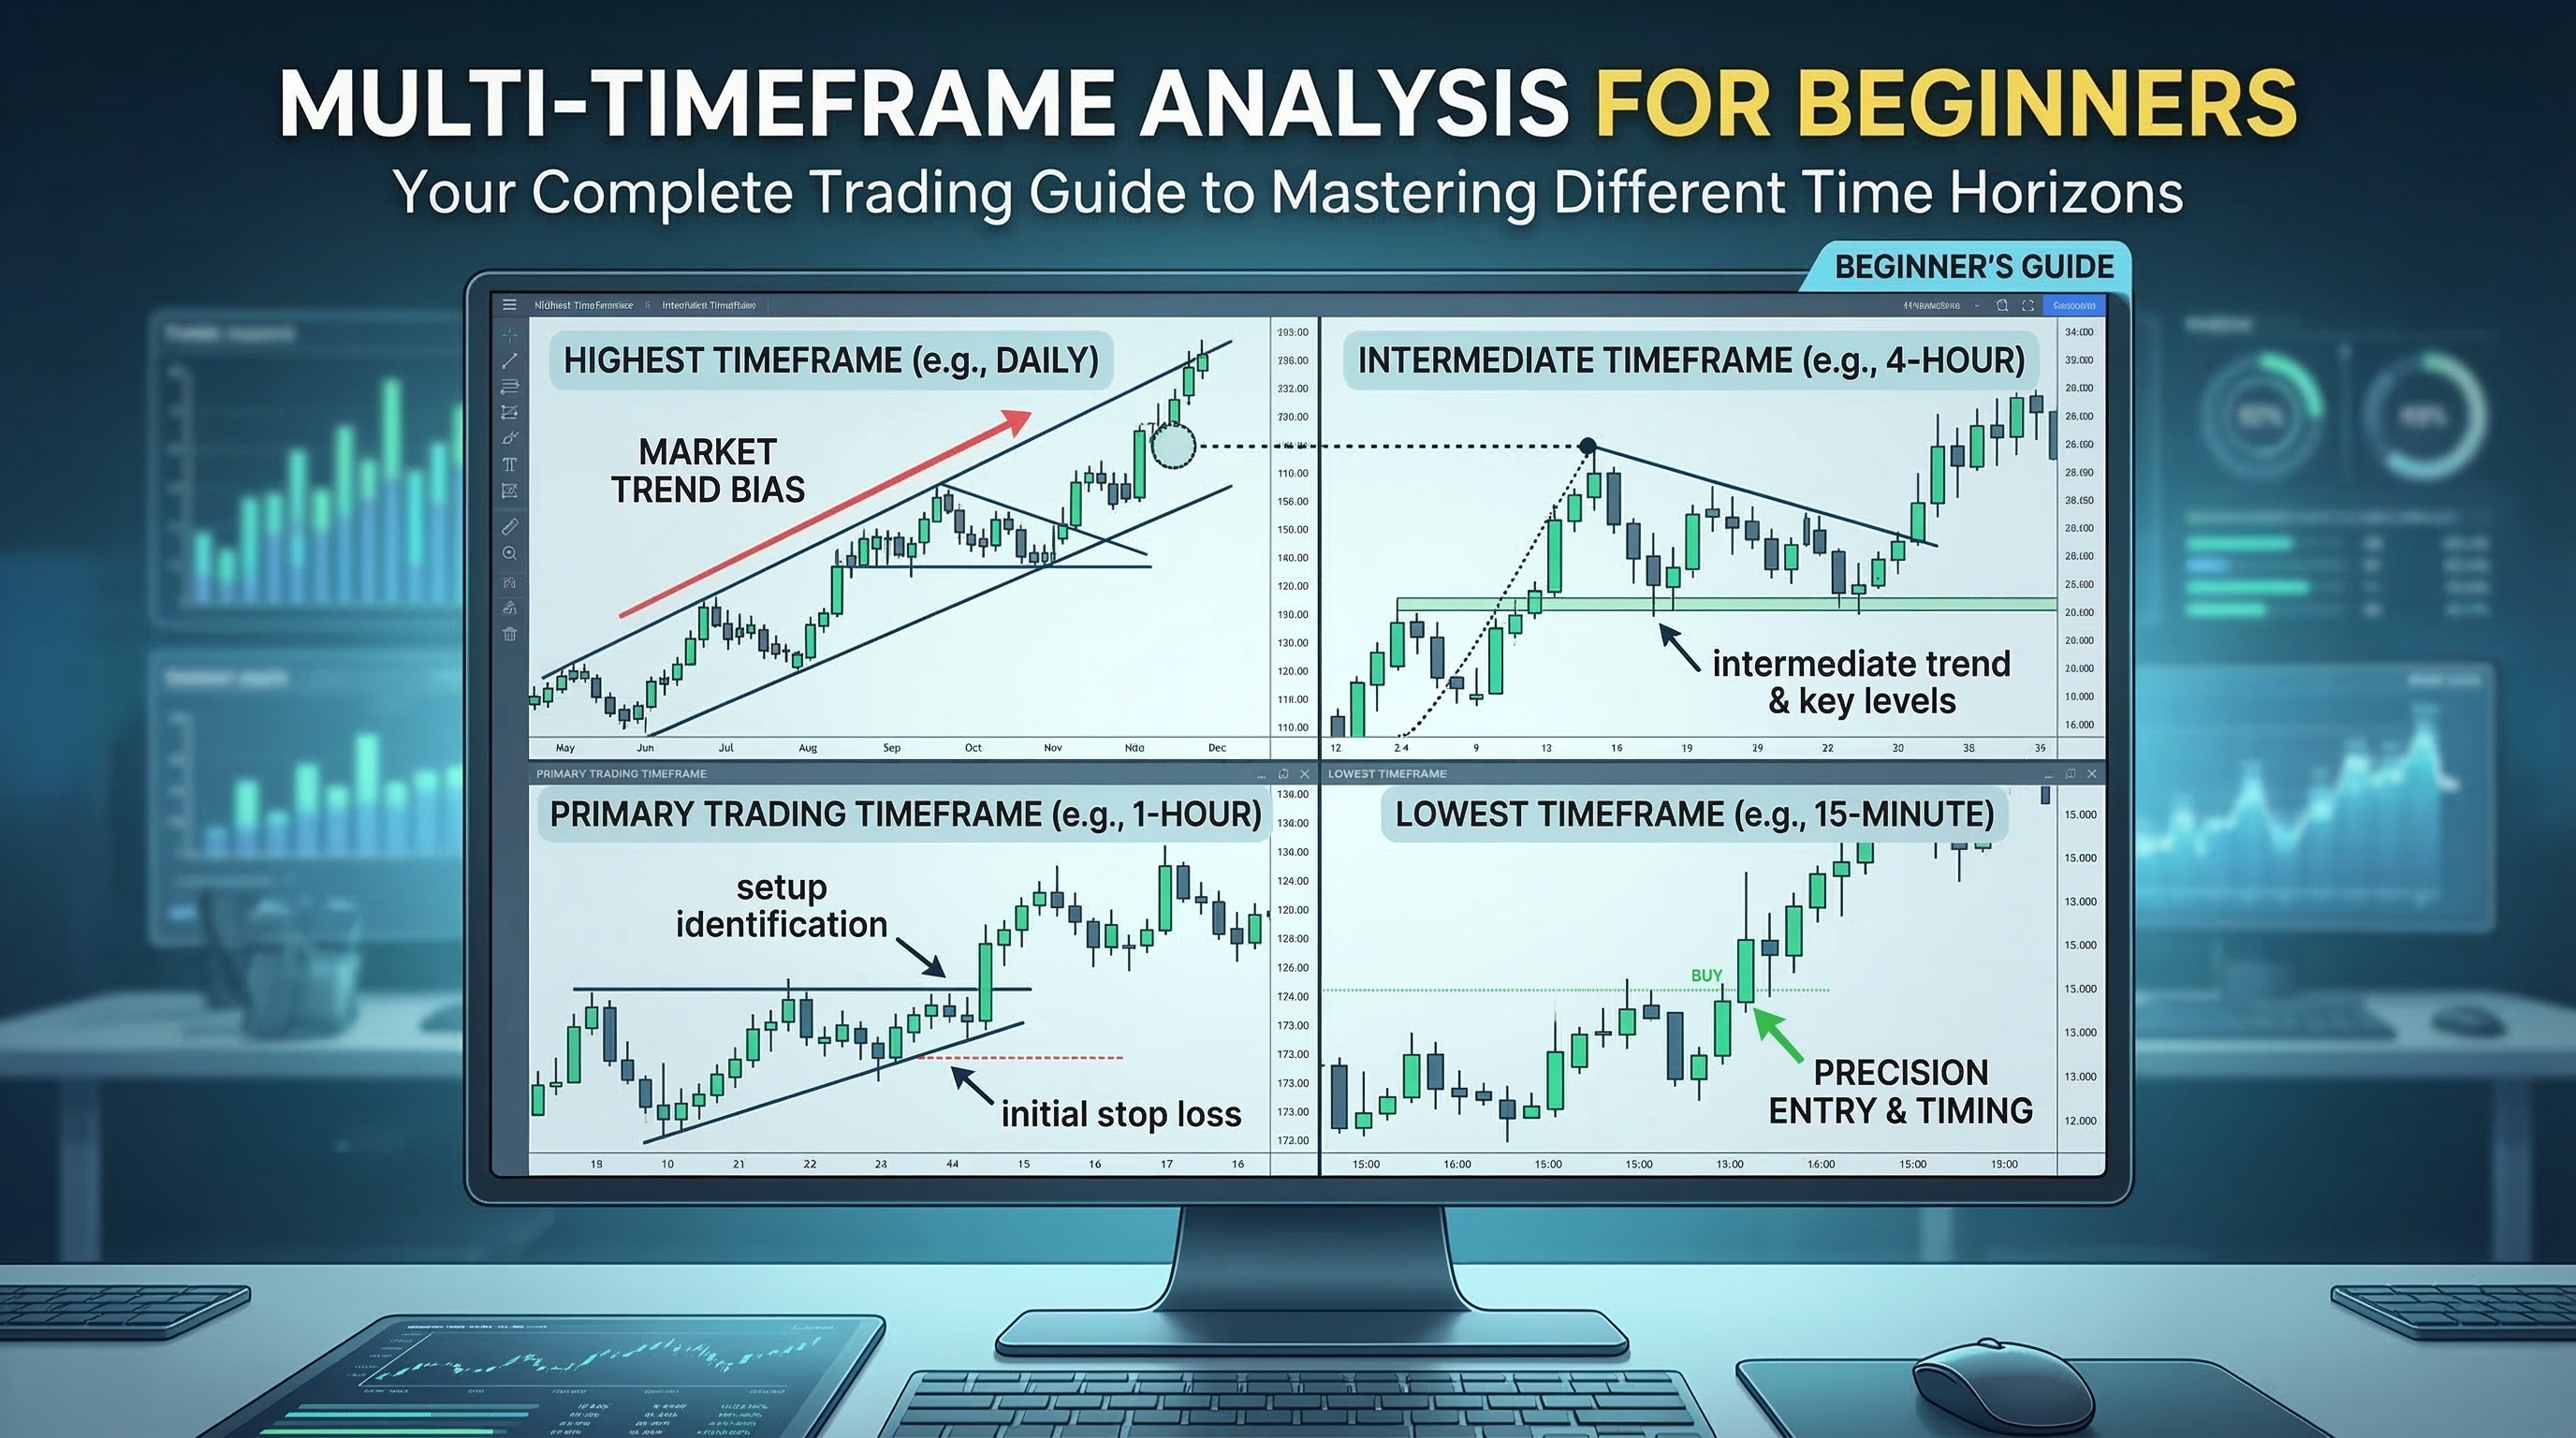
- Higher Timeframes: Provide overall market direction and major support/resistance levels
- Middle Timeframes: Show intermediate trends and key price levels
- Lower Timeframes: Offer precise entry and exit timing
- Correlation Analysis: Understanding how different timeframes interact
Why Multi-Timeframe Analysis Matters
Understanding multi-timeframe analysis for beginners is crucial because markets don't operate in isolation within single time periods. Here's why this approach provides significant advantages:
Enhanced Market Context
Single timeframe analysis can be misleading. A bullish pattern on a 15-minute chart might seem like a great buying opportunity until you check the daily chart and discover the price is approaching a major resistance level. Multi-timeframe analysis provides the context needed to interpret signals correctly.
:::example Imagine you're looking at EUR/USD on a 1-hour chart and see what appears to be a strong bullish breakout. However, when you check the daily chart, you notice the price is hitting a significant resistance level that has held for months. This context would make you more cautious about taking a long position. :::
Improved Risk Management
By analyzing multiple timeframes, traders can better understand where to place stop losses and take profit levels. Higher timeframes reveal natural support and resistance levels that may not be visible on lower timeframes, allowing for more strategic risk management decisions.
Better Trade Timing
While higher timeframes provide direction, lower timeframes offer precision timing for entries and exits. This combination allows traders to align with the overall trend while optimizing their entry points for better risk-to-reward ratios.
Reduced False Signals
Many trading signals that appear strong on one timeframe can be filtered out when viewed through the lens of multiple timeframes. This helps reduce the number of false breakouts and failed patterns that often trap single-timeframe traders.
Setting Up Your Timeframe Structure
Creating an effective multi-timeframe analysis setup requires choosing the right combination of timeframes that complement each other without creating information overload. Here's how beginners should structure their approach:
The Rule of Four
A practical approach for multi-timeframe analysis for beginners is to use approximately four timeframes with each one being 4-6 times larger than the previous one:
1. Primary Timeframe: Your main trading timeframe 2. Higher Timeframe 1: 4-6x the primary timeframe 3. Higher Timeframe 2: 4-6x the first higher timeframe 4. Lower Timeframe: 1/4 to 1/6 of the primary timeframe
:::tip For day traders using 15-minute charts as their primary timeframe, a good structure might be: 1-minute (lower), 15-minute (primary), 1-hour (higher 1), and 4-hour or daily (higher 2). :::
Common Timeframe Combinations
For Day Traders:
- 1-minute, 5-minute, 15-minute, 1-hour
- 5-minute, 15-minute, 1-hour, 4-hour
For Swing Traders:
- 1-hour, 4-hour, daily, weekly
- 4-hour, daily, weekly, monthly
For Position Traders:
- Daily, weekly, monthly, quarterly
Choosing Your Primary Timeframe
Your primary timeframe should align with your trading style and available time:
- Scalping: 1-5 minute charts
- Day Trading: 15-minute to 1-hour charts
- Swing Trading: 4-hour to daily charts
- Position Trading: Daily to weekly charts
The Top-Down Analysis Approach
The most effective way to conduct multi-timeframe analysis for beginners is through a top-down approach, starting with the highest timeframe and working your way down to the lowest.
Step 1: Analyze the Highest Timeframe
Start with your highest timeframe to identify:
- Overall market trend (bullish, bearish, or sideways)
- Major support and resistance levels
- Key chart patterns
- Long-term market structure
:::key-concept The highest timeframe sets the overall market bias. Trading against this bias significantly reduces your probability of success. :::
Step 2: Move to the Intermediate Timeframe
On your intermediate timeframe, look for:
- Confirmation of the higher timeframe trend
- Intermediate support and resistance levels
- Potential reversal signals if they align with higher timeframe levels
- Entry zones that respect the overall trend
Step 3: Examine Your Primary Trading Timeframe
This is where you'll identify:
- Specific trading setups
- Entry trigger signals
- Initial stop loss placement
- Trade management opportunities
Step 4: Use the Lowest Timeframe for Precision
The lowest timeframe helps with:
- Precise entry timing
- Fine-tuning stop loss placement
- Early exit signals
- Managing partial profits
:::example Let's say you're swing trading EUR/USD: 1. Weekly Chart: Shows a strong uptrend with price above key moving averages 2. Daily Chart: Reveals a pullback to a significant support level 3. 4-Hour Chart: Shows a potential double bottom forming at the support 4. 1-Hour Chart: Provides the exact entry point when price breaks above the double bottom neckline :::
Practical Multi-Timeframe Trading Strategies
Now that you understand the framework, let's explore specific strategies that utilize multi-timeframe analysis for beginners.
Strategy 1: Trend Continuation Setup
This strategy involves trading pullbacks in the direction of the higher timeframe trend.
Setup Requirements: 1. Higher timeframe shows a clear trend 2. Intermediate timeframe shows a pullback to support/resistance 3. Lower timeframe provides entry signal
Execution Steps: 1. Identify trend direction on highest timeframe 2. Wait for pullback on intermediate timeframe 3. Look for reversal signals at key levels 4. Enter on lower timeframe confirmation 5. Set stop loss below/above the pullback level 6. Target next higher timeframe resistance/support
Strategy 2: Break and Retest
This strategy combines breakout trading with multi-timeframe confirmation.
Setup Requirements: 1. Higher timeframe shows approaching key level 2. Price breaks the level on intermediate timeframe 3. Lower timeframe shows retest of broken level
Execution Steps: 1. Identify key levels on higher timeframes 2. Watch for breakout on intermediate timeframe 3. Wait for retest on lower timeframe 4. Enter on bounce from retested level 5. Stop loss beyond the retest level 6. Target based on higher timeframe analysis
Strategy 3: Divergence Confirmation
This approach uses multi-timeframe divergence for reversal trades.
:::warning Divergence trading requires experience and should be practiced extensively before using with real money. :::
Setup Requirements: 1. Divergence visible on intermediate timeframe 2. Price approaching higher timeframe support/resistance 3. Lower timeframe shows reversal confirmation
Common Mistakes to Avoid
While learning multi-timeframe analysis for beginners, avoid these common pitfalls:
Analysis Paralysis
Using too many timeframes can lead to conflicting signals and indecision. Stick to 3-4 timeframes maximum and ensure each serves a specific purpose.
Ignoring Higher Timeframe Bias
Trading against the higher timeframe trend significantly reduces your success rate. Always respect the overall market direction.
Over-Relying on Lower Timeframes
While lower timeframes provide good entry timing, they shouldn't override higher timeframe analysis. Use them for fine-tuning, not decision-making.
Inconsistent Timeframe Selection
Randomly switching between different timeframe combinations makes it difficult to develop consistent results. Choose a structure and stick with it.
Neglecting Market Context
Economic events, news releases, and market sentiment can override technical analysis. Always consider fundamental factors alongside your multi-timeframe analysis.
Tools and Platforms for Multi-Timeframe Analysis
Successful multi-timeframe analysis for beginners requires the right tools and platforms:
Essential Features to Look For
- Multiple Chart Windows: Ability to display several timeframes simultaneously
- Quick Timeframe Switching: Easy navigation between different time periods
- Synchronized Charts: Charts that move together when you scroll or zoom
- Template Saving: Save your multi-timeframe setups for quick access
- Alert Systems: Notifications when price reaches key levels across timeframes
Recommended Platform Features
TradingView: Excellent for multi-timeframe analysis with layout saving and synchronization MetaTrader 4/5: Professional platform with multi-chart capabilities NinjaTrader: Advanced charting with sophisticated multi-timeframe tools Thinkorswim: Comprehensive analysis platform with flexible chart arrangements
:::tip Most professional traders use at least two monitors to effectively display multiple timeframes. If you're limited to one screen, consider using chart templates that quickly switch between your preferred timeframe combinations. :::
Setting Up Your Workspace
1. Arrange Charts Logically: Place higher timeframes on the left/top, lower on right/bottom 2. Use Consistent Indicators: Apply the same indicators across all timeframes for easier comparison 3. Color Code: Use different color schemes to quickly identify each timeframe 4. Save Templates: Create saved workspace layouts for different trading setups
Putting It All Together
Mastering multi-timeframe analysis for beginners requires practice and patience. Here's a step-by-step approach to implementation:
Week 1-2: Foundation Building
- Choose your timeframe combination based on your trading style
- Practice identifying trends on different timeframes
- Learn to spot major support and resistance levels
- Study how price movements on lower timeframes fit within higher timeframe patterns
Week 3-4: Pattern Recognition
- Identify chart patterns across multiple timeframes
- Practice the top-down analysis approach
- Learn to spot divergences between timeframes
- Study real market examples of multi-timeframe setups
Week 5-8: Strategy Development
- Choose 1-2 multi-timeframe strategies to focus on
- Practice these strategies on demo accounts
- Keep a trading journal noting multi-timeframe observations
- Refine your approach based on results
Month 3+: Live Implementation
- Start with small position sizes on live accounts
- Continue journaling and analyzing results
- Gradually increase position sizes as consistency improves
- Develop your personal multi-timeframe trading style
:::key-concept Multi-timeframe analysis is a skill that improves with experience. Focus on consistency and patience rather than trying to master everything at once. :::
Daily Multi-Timeframe Routine
1. Market Open: Check higher timeframes for overall bias 2. Pre-Market Analysis: Identify key levels and potential setups 3. Active Trading: Use lower timeframes for entries and exits 4. Market Close: Review trades and multi-timeframe relationships 5. Evening: Plan for the next trading session
Conclusion
Multi-timeframe analysis for beginners represents a fundamental shift from single-timeframe trading to a more comprehensive approach to market analysis. By understanding how different time horizons interact and influence each other, you can make more informed trading decisions, improve your timing, and better manage risk.
The key to success with multi-timeframe analysis lies in starting simple and building complexity gradually. Begin with a basic three-timeframe structure, master the top-down analysis approach, and focus on one or two strategies until they become second nature. Remember that this skill develops over time, and consistent practice with proper journaling will accelerate your learning curve.
As you continue your trading journey, multi-timeframe analysis will become an invaluable tool that helps you see the market from multiple perspectives, avoid common traps, and identify high-probability trading opportunities that single-timeframe traders often miss.
Ready to master multi-timeframe analysis? Start by setting up your charts with a simple three-timeframe structure and spend the next week practicing the top-down analysis approach on your preferred markets. Focus on identifying the overall trend, key levels, and how price movements on lower timeframes respect higher timeframe structure. With dedicated practice, you'll soon discover how this powerful approach can transform your trading results.