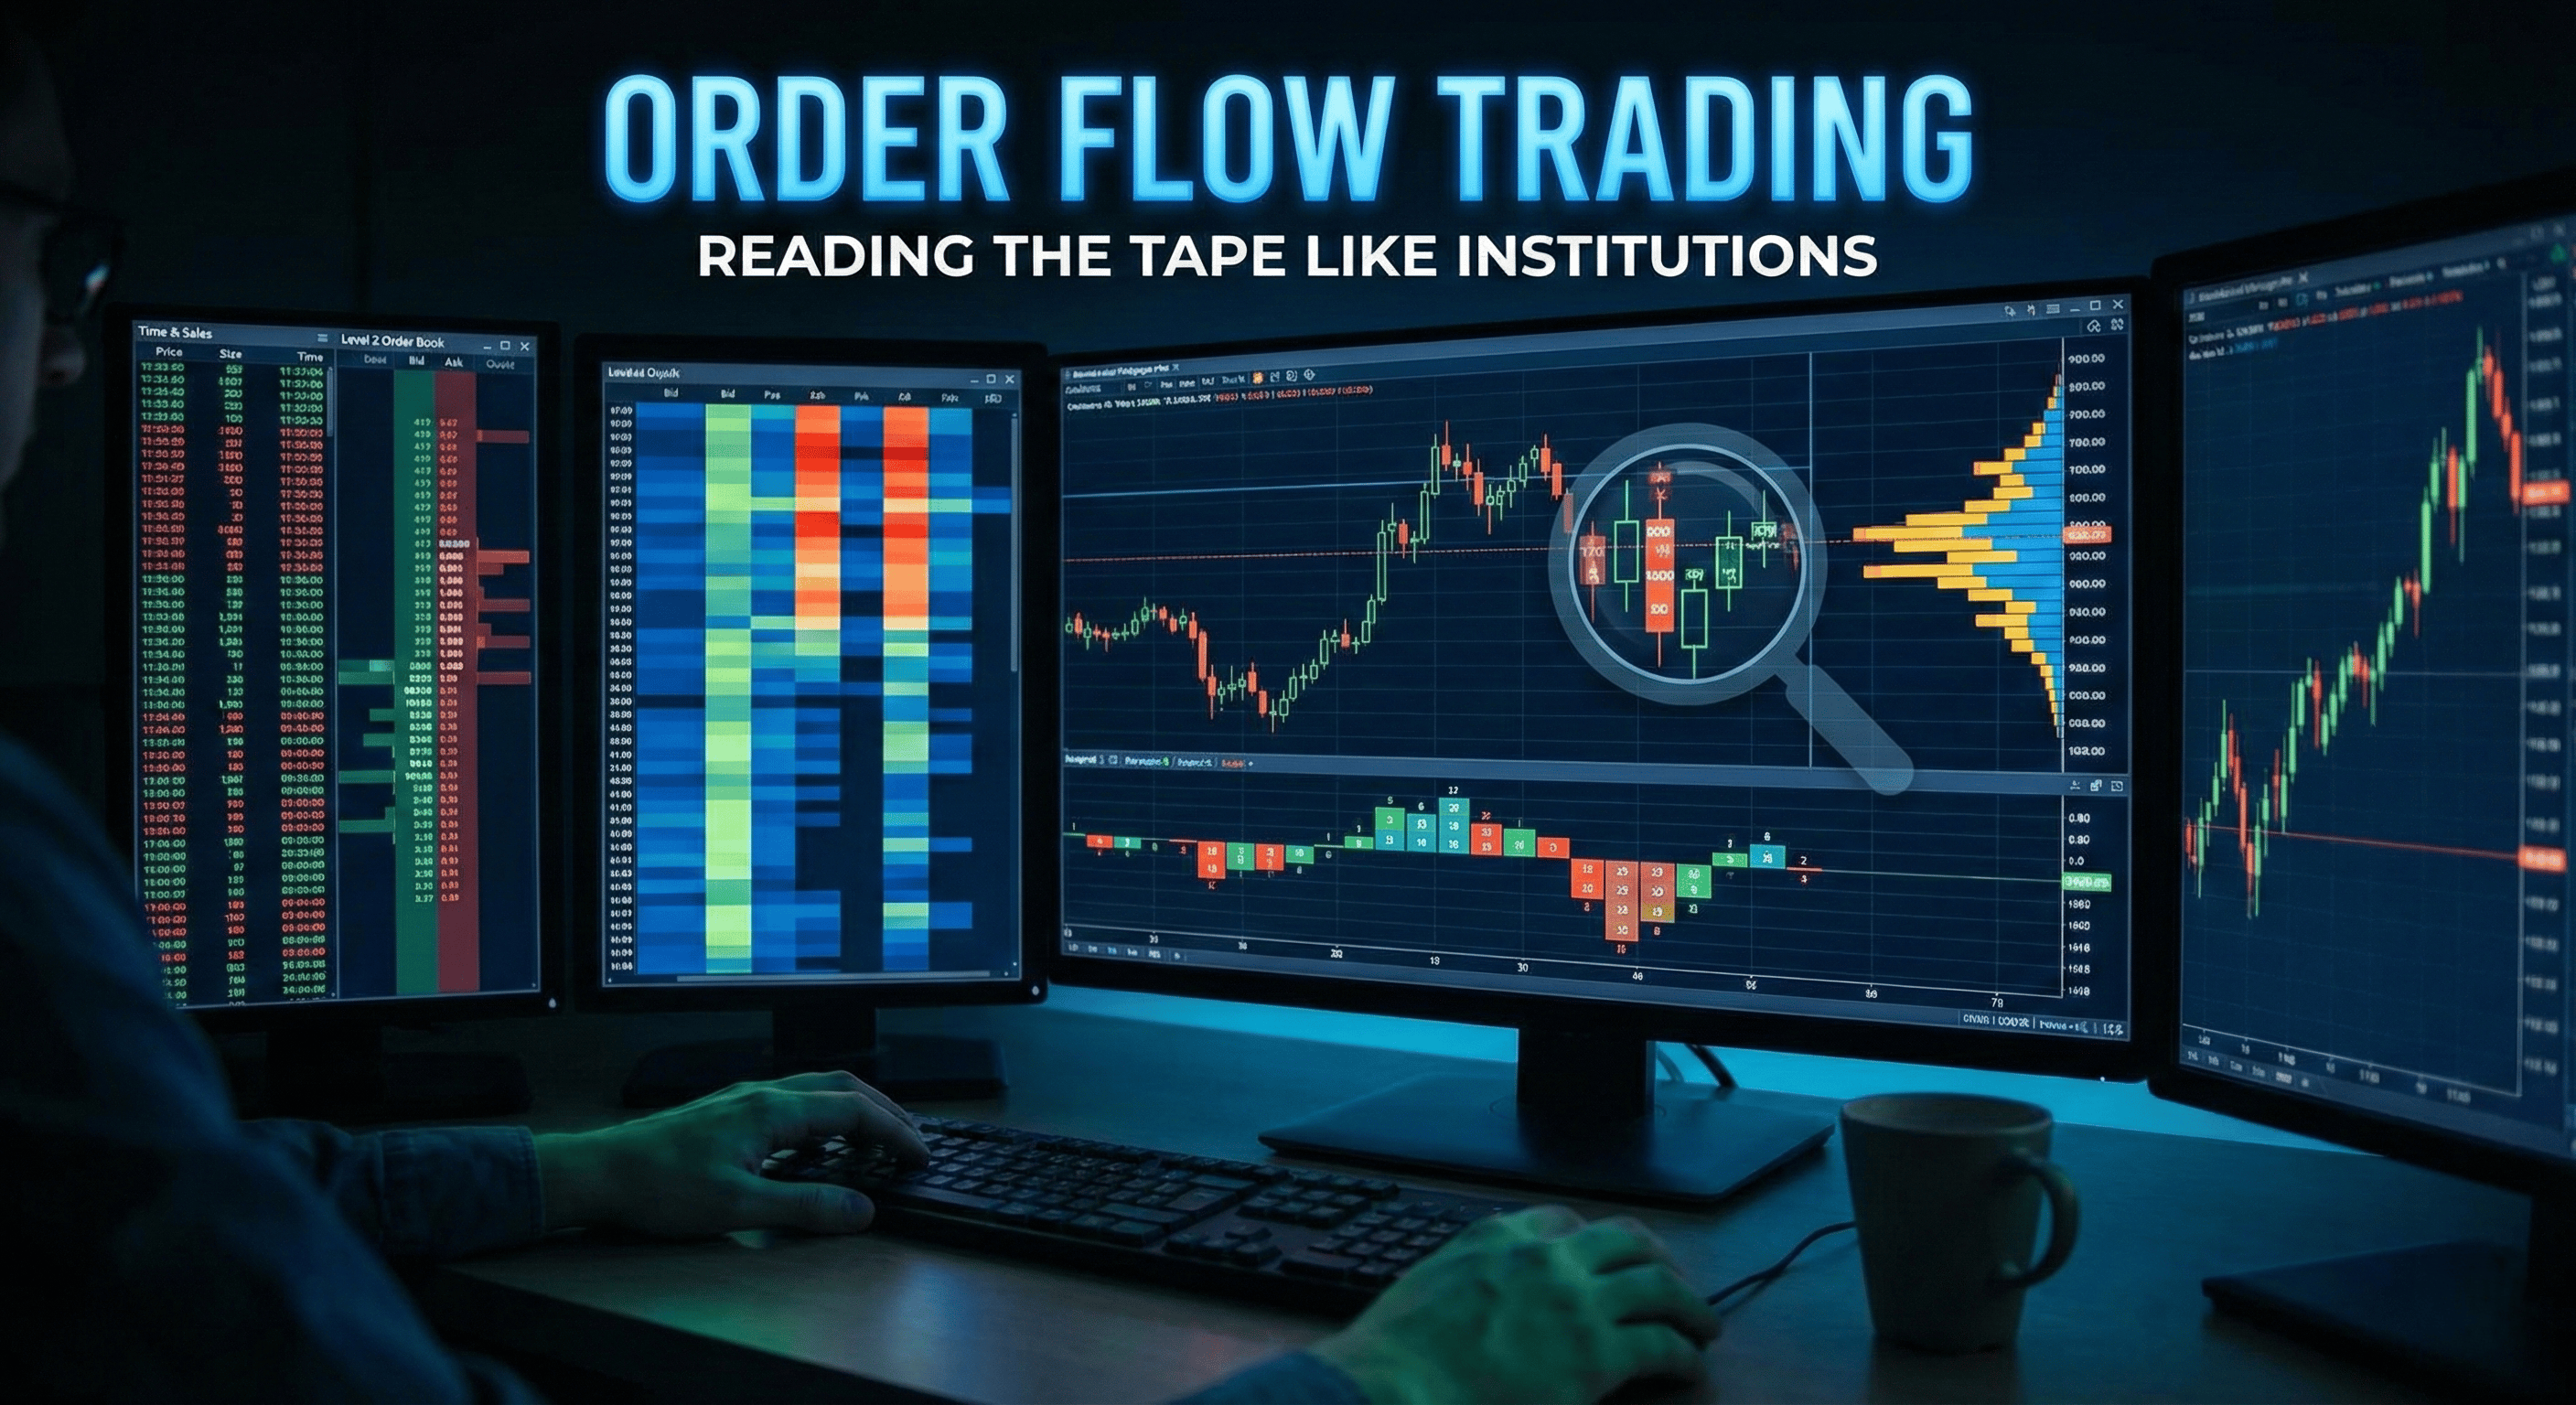
# Order Flow Trading for Retail Traders: Reading the Tape Like Institutions
Order flow trading represents one of the most sophisticated approaches to market analysis, traditionally reserved for institutional traders with access to Level 2 data and professional trading platforms. However, with advancing technology and retail trading platforms, individual traders can now access many of the same tools and techniques used by institutions to read market microstructure.
This comprehensive guide will transform your understanding of how markets actually move, moving beyond simple price action to analyze the underlying forces of buying and selling pressure. You'll learn to identify institutional footprints, recognize accumulation and distribution phases, and position yourself alongside smart money rather than against it.
Table of Contents
- [Understanding Order Flow Fundamentals](#understanding-order-flow-fundamentals)
- [The Anatomy of Market Microstructure](#the-anatomy-of-market-microstructure)
- [Reading Tape and Level 2 Data](#reading-tape-and-level-2-data)
- [Volume Profile and Market Auction Theory](#volume-profile-and-market-auction-theory)
- [Identifying Institutional Footprints](#identifying-institutional-footprints)
- [Advanced Order Flow Patterns](#advanced-order-flow-patterns)
- [Practical Implementation Strategies](#practical-implementation-strategies)
- [Conclusion](#conclusion)
Understanding Order Flow Fundamentals
Order flow analysis examines the actual buying and selling activity in the market, providing insights into the intentions and positioning of different market participants. Unlike traditional technical analysis that focuses on price and volume after the fact, order flow analysis reveals the underlying mechanics of price discovery in real-time.
:::key-concept Order Flow Definition: Order flow is the sequence of buy and sell orders that create price movement. It reveals who is buying, who is selling, at what prices, and in what quantities, providing a microscopic view of market dynamics. :::
The Three Pillars of Order Flow Analysis
1. Volume Distribution Volume distribution shows where the most trading activity occurs at different price levels. High volume areas often represent value zones where institutions accumulate or distribute positions. These areas frequently act as support or resistance levels because they represent price levels where significant participants have vested interests.
2. Order Book Dynamics The order book reveals pending buy and sell orders at various price levels. Analyzing changes in order book depth, the appearance and disappearance of large orders, and the relationship between bid and ask sizes provides insights into immediate supply and demand imbalances.
3. Trade Aggression Trade aggression indicates whether transactions are initiated by buyers (market buy orders hitting the ask) or sellers (market sell orders hitting the bid). Sustained aggressive buying or selling often precedes significant price moves and reveals the dominant market force.
:::example Real-World Application: During a sideways consolidation in ES futures, you notice large blocks of aggressive buying every time price approaches the lower range boundary at 4,200. Simultaneously, the volume profile shows increasing volume at this level. This suggests institutional accumulation, making it a high-probability long entry point. :::
Market Participant Categories
Understanding different market participants helps contextualize order flow patterns:
- Institutional Investors: Large funds, pension funds, and endowments with long-term horizons
- Hedge Funds: Sophisticated traders using various strategies with medium to short-term horizons
- High-Frequency Traders (HFT): Algorithmic traders providing liquidity and capturing small spreads
- Market Makers: Professional traders obligated to provide continuous bid and ask quotes
- Retail Traders: Individual traders with smaller position sizes and varying time horizons
Each participant type leaves distinct footprints in the order flow, and recognizing these patterns allows you to align your trading with the dominant forces.
The Anatomy of Market Microstructure
Market microstructure analysis examines how orders interact within the market's organizational framework. This deep dive into market mechanics reveals the hidden dynamics that drive price movement.
Bid-Ask Spread Dynamics
The bid-ask spread represents the difference between the highest price buyers are willing to pay and the lowest price sellers are willing to accept. Spread behavior provides crucial insights:
- Narrow Spreads: Indicate high liquidity and active market making
- Widening Spreads: Suggest decreasing liquidity or increasing uncertainty
- Spread Compression: Often occurs before significant news or market moves
:::tip Pro Tip: Watch for spread widening combined with declining order book depth. This combination often precedes volatile price movements as liquidity providers step aside. :::
Order Types and Their Market Impact
Market Orders Market orders execute immediately at the best available price, consuming liquidity from the order book. Large market orders reveal urgency and can indicate institutional positioning or news-driven activity.
Limit Orders Limit orders provide liquidity by resting in the order book at specified prices. The placement and size of limit orders reveal potential support and resistance levels and participant intentions.
Iceberg Orders Large institutions often use iceberg orders to hide their true position size, showing only small portions of their total order. Recognizing iceberg patterns helps identify significant institutional activity.
Stop Orders Stop orders become market orders when triggered, often creating cascading effects and increased volatility. Areas with clustered stops represent potential acceleration points.
Price Discovery Process
Price discovery occurs through the continuous auction process where buyers and sellers interact. Understanding this process helps predict short-term price direction:
1. Initial Price Setting: Market makers establish initial bid-ask spreads 2. Order Interaction: Incoming orders interact with resting liquidity 3. Price Adjustment: Prices adjust based on order flow imbalances 4. Equilibrium Seeking: Markets continuously seek fair value through this process
:::warning Important: Price discovery is most efficient in highly liquid markets. In thin markets, single large orders can cause disproportionate price moves that may not reflect true underlying value. :::
Reading Tape and Level 2 Data
Tape reading, also known as time and sales analysis, involves interpreting the stream of executed trades to understand market sentiment and potential price direction. This skill, once essential for floor traders, remains highly relevant in electronic markets.
Time and Sales Analysis
The time and sales window displays every executed trade with timestamp, price, and volume. Key elements to analyze:
Trade Size Patterns
- Small, consistent sizes often indicate retail activity or algorithmic trading
- Large, irregular sizes suggest institutional participation
- Clusters of similar-sized trades may indicate algorithmic execution strategies
Trade Timing
- Rapid-fire small trades often precede larger moves
- Sudden appearance of large trades can signal news or institutional activity
- Trade rhythm changes often coincide with market regime shifts
Price Impact Analysis
- Large trades with minimal price impact suggest good liquidity
- Small trades causing significant price moves indicate thin liquidity
- Trades that "print through" multiple price levels show strong conviction
:::example Tape Reading in Action: You observe a series of 500-lot ES trades executing every few seconds, all at the bid price, causing steady downward pressure. Simultaneously, smaller 50-100 lot trades appear at the ask, suggesting retail traders trying to catch a falling knife. This pattern indicates institutional distribution and suggests continued downward pressure. :::
Level 2 Order Book Analysis
Level 2 data shows pending orders at various price levels, providing a forward-looking view of potential support and resistance areas.
Order Book Depth
- Deep order books suggest strong liquidity and price stability
- Thin order books indicate potential for rapid price movements
- Asymmetric depth (heavy on one side) suggests directional bias
Order Placement Patterns
- Large orders at round numbers often represent institutional levels
- Clusters of orders may indicate algorithmic placement strategies
- Sudden order appearances or cancellations can signal changing sentiment
Spoofing and Layering Detection While illegal in many markets, spoofing (placing and quickly canceling large orders) and layering (placing multiple orders to create false depth) still occur. Recognizing these patterns helps avoid false signals.
Footprint Charts
Footprint charts combine price, volume, and order flow data into a single visualization, showing:
- Volume traded at each price level
- Bid vs. ask volume distribution
- Number of trades at each level
- Delta (difference between buy and sell volume)
:::key-concept Delta Analysis: Positive delta indicates more buying pressure (trades at ask), while negative delta shows selling pressure (trades at bid). Divergences between price and delta often signal potential reversals. :::
Volume Profile and Market Auction Theory
Volume profile analysis is fundamental to understanding where institutional participants have established positions and where they're likely to defend or exit those positions.
Market Profile Concepts
Market Profile, developed by J. Peter Steidlmayer, organizes trading activity by price and time, revealing market structure and participant behavior patterns.
Value Area The Value Area encompasses the price range where 70% of the volume traded, representing the fair value zone accepted by most market participants.
Point of Control (POC) The POC is the price level with the highest volume, often acting as a magnet for price and a significant support or resistance level.
Market Profile Letters Each 30-minute period receives a letter designation, and the distribution of these letters reveals market acceptance or rejection at various price levels.
Volume Profile Types
Session Volume Profile Shows volume distribution for a single trading session, useful for intraday analysis and identifying key levels for the next session.
Composite Volume Profile Combines multiple sessions to show longer-term volume patterns, revealing significant accumulation or distribution areas.
Anchored Volume Profile Anchored to specific events (earnings, news, significant moves), this tool shows how market participants have responded to particular catalysts.
:::example Volume Profile Strategy: After a stock gaps down 5% on earnings, you anchor a volume profile from the gap open. Over the next three days, 60% of volume trades in a narrow range 2% below the gap, creating a prominent POC. This suggests institutional accumulation at discounted levels, making it a potential reversal zone. :::
Auction Theory Application
Markets function as continuous auctions where price moves to facilitate trade between buyers and sellers. Understanding auction dynamics helps predict price behavior:
Two-Way Auction Healthy markets feature balanced participation from both buyers and sellers, creating two-way auctions with responsive trading at various levels.
One-Way Auction When one side dominates, markets enter one-way auction modes characterized by trend moves and limited counter-trend participation.
Failed Auctions Failed auctions occur when markets can't find willing participants at certain price levels, often leading to rapid reversals or continued trending.
Volume Profile Trading Strategies
POC Retest Strategy When price moves away from the POC and returns, the POC often provides support or resistance. The initial reaction at the POC offers high-probability trading opportunities.
Value Area Rejection When price auctions outside the value area and is quickly rejected back inside, it often signals a false breakout and potential counter-trend move.
Volume Node Analysis High-volume nodes (areas of high trading activity) often become significant support or resistance levels, while low-volume nodes may offer little price resistance.
:::tip Advanced Technique: Overlay multiple timeframe volume profiles to identify confluence areas where both short-term and long-term participants have established positions. These areas often provide the strongest support or resistance. :::
Identifying Institutional Footprints
Institutional trading leaves distinct signatures in the order flow that trained eyes can identify. Recognizing these footprints allows retail traders to align with smart money movements rather than trading against them.
Institutional Order Execution Characteristics
Large Block Trades Institutions often execute trades in large blocks (10,000+ shares in stocks, 100+ contracts in futures). However, they frequently break these into smaller parcels to minimize market impact.
TWAP and VWAP Strategies Many institutions use Time-Weighted Average Price (TWAP) or Volume-Weighted Average Price (VWAP) algorithms, creating consistent buying or selling pressure over extended periods.
Stealth Trading Sophisticated institutions attempt to hide their trading through:
- Varying order sizes
- Random timing intervals
- Using multiple venues
- Dark pool execution
Accumulation and Distribution Patterns
Accumulation Characteristics
- Increased volume on down moves with quick recovery
- Large buying interest at specific price levels
- Absorption of selling pressure without significant price decline
- Rising volume profile with price consolidation
Distribution Characteristics
- Increased volume on up moves with subsequent weakness
- Large selling interest at resistance levels
- Price struggle to advance despite increased volume
- Declining volume profile with price consolidation
:::example Institutional Accumulation Example: In AAPL, you notice that every time the stock approaches $150, large volume appears but the stock quickly bounces. The tape shows consistent 10,000+ share blocks executing at the bid around $150, but price immediately recovers. Volume profile shows increasing activity at $150 over several sessions. This suggests institutional accumulation at this level. :::
Dark Pool Indicators
While dark pool activity isn't directly visible, certain indicators suggest significant institutional off-exchange trading:
- Price gaps with no corresponding volume
- Sudden liquidity appearance at specific levels
- Price stability despite visible order book imbalances
- Volume-weighted average price tracking despite limited visible flow
Smart Money vs. Retail Flow
Smart Money Characteristics
- Early positioning before major moves
- Counter-trend accumulation during panic selling
- Distribution during euphoric buying
- Patient execution over extended periods
Retail Flow Characteristics
- Momentum chasing behavior
- Emotional reaction to news and price moves
- Clustering at obvious technical levels
- Impatient execution with immediate market orders
:::warning Risk Management: Never assume all large orders represent smart money. High-frequency traders, algorithmic strategies, and even retail traders using portfolio optimization can generate large orders. Always confirm institutional activity with multiple order flow indicators. :::
Advanced Order Flow Patterns
Mastering advanced order flow patterns separates professional traders from amateurs. These patterns often provide early warning signals for significant market moves.
Absorption Patterns
Absorption occurs when one side of the market consumes incoming orders without significant price movement, often indicating the presence of a large participant.
Buying Absorption
- Heavy selling pressure with minimal price decline
- Large volume at bid with quick price recovery
- Order book showing consistent bid refreshing
- Footprint charts revealing high buy volume at lower prices
Selling Absorption
- Strong buying pressure with limited price advance
- High volume at ask with price rejection
- Consistent ask refreshing in order book
- Footprint showing high sell volume at upper prices
Order Flow Divergences
Divergences between price and order flow often signal potential reversals or trend changes.
Bullish Divergence
- Price making new lows while delta improves
- Decreasing selling pressure on price declines
- Volume profile showing more activity at higher prices within the range
Bearish Divergence
- Price making new highs with weakening buying pressure
- Increasing distribution on rallies
- Volume profile showing more activity at lower prices within the range
:::example Order Flow Divergence Trade: EUR/USD makes a new session low, but the corresponding footprint chart shows significantly less selling pressure (lower negative delta) compared to the previous low. Simultaneously, you observe absorption of selling pressure with quick recovery. This bullish divergence suggests the low may hold, providing a high-probability long opportunity. :::
Liquidity Patterns
Liquidity Void Areas with little historical trading activity often see rapid price movement as there's minimal resistance to price advance or decline.
Liquidity Pool Areas of high historical volume often attract price return as participants have established positions and interests at these levels.
Stop Hunt Patterns Large participants sometimes drive price to obvious stop levels to generate liquidity for their larger orders, creating temporary spikes that quickly reverse.
Momentum vs. Rotation Analysis
Momentum Characteristics
- Sustained directional order flow
- Increasing volume in direction of move
- Limited counter-trend participation
- Price extension beyond normal ranges
Rotation Characteristics
- Balanced two-way order flow
- Volume concentration within established ranges
- Quick rejection of range extension attempts
- Mean reversion tendencies
Advanced Footprint Analysis
Unfinished Business When aggressive orders can't find sufficient liquidity at desired prices, they create "unfinished business" that often leads to future price attraction to these levels.
Trade Facilitation Large trades that require multiple price levels to complete often indicate significant positional interest and potential future support or resistance.
Order Flow Climax Extreme order flow readings often mark short-term exhaustion points, particularly when combined with extended price moves.
:::tip Pattern Recognition: Develop a systematic approach to pattern identification by creating checklists for each pattern type. This helps maintain objectivity and improves pattern recognition accuracy over time. :::
Practical Implementation Strategies
Transitioning from theoretical knowledge to practical application requires systematic implementation and continuous refinement of order flow analysis techniques.
Platform and Data Requirements
Essential Tools
- Level 2 market data
- Time and sales feed
- Volume profile capabilities
- Footprint or market delta charts
- Multiple timeframe analysis
Recommended Platforms Professional platforms like Sierra Chart, NinjaTrader, or TradingView Pro offer comprehensive order flow tools. For stocks, platforms like DAS Trader or Sterling Trader Pro provide professional-grade capabilities.
Data Considerations
- Real-time vs. delayed data significantly impacts analysis quality
- Market depth requirements vary by trading style
- Historical order flow data helps pattern recognition development
Developing Your Order Flow Workflow
Pre-Market Analysis 1. Review overnight volume profile development 2. Identify key levels from previous session 3. Note scheduled economic events or earnings 4. Assess overall market sentiment through futures
Market Open Analysis 1. Monitor opening auction dynamics 2. Identify initial institutional activity 3. Assess gap fill potential through order flow 4. Establish key levels for the session
Intraday Monitoring 1. Continuous tape reading during active periods 2. Volume profile updates at key intervals 3. Order book monitoring for significant changes 4. Delta and absorption pattern identification
:::example Complete Trade Example:
Setup: SPY showing distribution at $425 resistance with increasing selling pressure on each test.
Entry Signal: Large block selling appears as price approaches $425 for the fourth time, with footprint showing 3:1 sell ratio.
Execution: Enter short at $424.95 with stop at $425.25 (above resistance).
Management: Target first support at $423.50 based on volume profile POC, then trail stop using order flow signals.
Result: Position moves in favor as selling pressure accelerates, reaching target within 30 minutes. :::
Risk Management in Order Flow Trading
Position Sizing Order flow trading often provides precise entry and exit levels, allowing for tighter stops and larger position sizes relative to account risk.
Stop Loss Placement
- Place stops beyond significant order flow levels
- Use absorption patterns to define risk parameters
- Consider market structure in stop placement
Profit Taking
- Scale out at volume profile nodes
- Monitor order flow for exhaustion signals
- Use trailing stops based on flow characteristics
Common Implementation Mistakes
Over-Analysis Paralysis Beginners often become overwhelmed by information quantity, leading to missed opportunities or conflicting signals.
Ignoring Market Context Order flow analysis works best within broader market context. Don't ignore fundamental trends or major market themes.
Insufficient Sample Size Order flow patterns require sufficient volume and participation to be meaningful. Avoid thin markets or low-volume periods.
Technology Dependence While tools are important, developing intuitive feel for market flow is equally crucial. Don't rely solely on indicators.
Building Pattern Recognition Skills
Systematic Practice 1. Daily chart review focusing on order flow patterns 2. Screenshot successful patterns for reference 3. Maintain trading journal with order flow observations 4. Regular backtesting of pattern effectiveness
Continuous Learning 1. Study institutional trading literature 2. Network with other order flow traders 3. Attend professional trading education programs 4. Practice on simulation before risking capital
:::key-concept Mastery Timeline: Developing proficient order flow reading skills typically requires 6-12 months of dedicated practice and study. The complexity of market microstructure analysis demands patience and systematic skill development. :::
Performance Metrics
Track specific metrics to measure order flow trading improvement:
- Entry timing precision
- Stop loss frequency and size
- Profit target achievement rate
- Pattern recognition accuracy
- Trade duration optimization
Conclusion
Order flow trading represents the evolution of market analysis from simple price observation to comprehensive understanding of market microstructure and participant behavior. By learning to read the tape like institutions, retail traders gain access to information previously available only to professional market participants.
The key to successful order flow implementation lies in understanding that markets are continuous auctions driven by the interaction of different participant types, each with distinct characteristics and motivations. Recognizing these patterns allows you to position alongside institutional flow rather than against it, dramatically improving trading probabilities.
Remember that order flow analysis is not a standalone solution but rather a powerful complement to technical analysis, fundamental understanding, and proper risk management. The most successful order flow traders combine multiple analytical approaches while maintaining discipline in execution and risk control.
Mastering these techniques requires dedicated practice and continuous learning. Start by focusing on one or two key concepts, gradually building complexity as your pattern recognition skills develop. The investment in time and education will pay dividends through improved market timing, better risk management, and deeper market understanding.
Begin your order flow journey today by setting up proper market data and analysis tools. Practice pattern recognition on paper trades before risking capital, and maintain detailed records of your observations and results. With persistence and systematic approach, you'll develop the institutional-level market reading skills that separate professional traders from the crowd.