# Price Action for Beginners: Everything You Need to Know
Price action trading is one of the most fundamental and powerful approaches to trading any financial market. Unlike strategies that rely on complex indicators or automated systems, price action focuses purely on how prices move on your charts. It's the art of reading the story that price tells through its movements, patterns, and behavior.
Think of price action as the language of the market. Every candlestick, every swing high and low, every support and resistance level tells you something about what traders are thinking and doing. Once you learn to read this language, you'll have a skill that works across all markets and timeframes.
In this comprehensive guide, we'll take you from complete beginner to having a solid foundation in price action trading. You'll learn what price action is, why it works, and most importantly, how to use it to make better trading decisions.
:::key-concept Price action is the study of price movement over time. It focuses on analyzing candlestick patterns, support and resistance levels, and market structure to predict future price movements without relying on indicators. :::
Table of Contents
- [What Is Price Action Trading?](#what-is-price-action-trading)
- [Why Price Action Works](#why-price-action-works)
- [Essential Price Action Concepts](#essential-price-action-concepts)
- [Key Price Action Patterns](#key-price-action-patterns)
- [How to Analyze Market Structure](#how-to-analyze-market-structure)
- [Putting It All Together: A Trading Approach](#putting-it-all-together-a-trading-approach)
- [Common Beginner Mistakes to Avoid](#common-beginner-mistakes-to-avoid)
- [Conclusion](#conclusion)
What Is Price Action Trading?
Price action trading is a method of analyzing and trading financial markets based solely on price movements. Instead of using indicators like moving averages or RSI, price action traders make decisions by studying:
- Candlestick patterns - The shapes and formations that individual candles or groups of candles create
- Support and resistance levels - Price levels where the market tends to bounce or break through
- Market structure - How prices create trends through higher highs, higher lows, lower highs, and lower lows
- Chart patterns - Recognizable formations that often lead to predictable price movements
:::example Imagine you're looking at a chart where the price keeps bouncing off the same level multiple times. This level becomes a support (if price is above it) or resistance (if price is below it). A price action trader would watch for how price behaves when it approaches this level again - does it bounce again, or does it finally break through? :::
The beauty of price action is its simplicity. You don't need to learn complex formulas or memorize indicator settings. Everything you need to know is right there on the chart in the form of price movements.
The Philosophy Behind Price Action
Price action is based on a simple but powerful idea: price discounts everything. This means that all the information that affects a market - news, economic data, trader sentiment, institutional buying and selling - is already reflected in the price movement you see on your chart.
When you learn to read price action, you're essentially learning to read the collective psychology of all market participants. Every candlestick represents a battle between buyers (bulls) and sellers (bears), and the outcome of these battles creates the patterns we can learn to recognize and trade.
Why Price Action Works
Price action has been used by successful traders for decades, and there are several reasons why it remains effective:
1. It's Based on Market Psychology
Human psychology doesn't change. Fear, greed, hope, and panic drive market movements today just as they did decades ago. Price action patterns reflect these emotions, making them timeless and reliable across different markets and time periods.
2. It's Self-Fulfilling
Because so many traders watch the same support and resistance levels and chart patterns, these levels often work simply because everyone is watching them. When thousands of traders are waiting to buy at a support level, that level becomes stronger.
3. It Works Across All Markets and Timeframes
Whether you're trading forex, stocks, commodities, or cryptocurrencies, price action principles remain the same. A support level works the same way on a 5-minute chart as it does on a daily chart.
4. It Provides Context
Indicators can give you signals, but price action gives you context. It helps you understand not just what might happen, but why it might happen based on market behavior.
:::tip Start by focusing on one market and one timeframe when learning price action. Master the patterns and behavior on daily charts before moving to shorter timeframes, which can be more noisy and challenging for beginners. :::
Essential Price Action Concepts
Before diving into specific patterns and strategies, you need to understand these fundamental concepts that form the foundation of all price action analysis.
Support and Resistance
Support and resistance are arguably the most important concepts in price action trading:
Support is a price level where buying pressure tends to emerge, preventing the price from falling further. Think of it as a floor that price bounces off.
Resistance is a price level where selling pressure tends to emerge, preventing the price from rising further. Think of it as a ceiling that price can't break through.
:::key-concept Support becomes resistance when broken, and resistance becomes support when broken. This is called a "role reversal" and is one of the most reliable concepts in trading. :::
How to Identify Support and Resistance
1. Look for price levels that have been tested multiple times - The more times a level holds, the stronger it becomes 2. Pay attention to previous swing highs and lows - These often act as future support or resistance 3. Watch for psychological levels - Round numbers like 1.2000 in EUR/USD or 2000 in the S&P 500 often act as support or resistance 4. Consider timeframe confluence - A level that shows up on multiple timeframes is typically stronger
Market Structure
Market structure refers to how price moves and creates trends. Understanding market structure helps you identify:
- Whether the market is trending or ranging
- The strength of a trend
- Potential reversal points
Uptrend Structure:
- Higher highs (HH) - Each peak is higher than the previous peak
- Higher lows (HL) - Each low is higher than the previous low
Downtrend Structure:
- Lower highs (LH) - Each peak is lower than the previous peak
- Lower lows (LL) - Each low is lower than the previous low
Ranging Structure:
- Price moves between defined support and resistance levels
- No clear pattern of higher highs/lower lows
:::example In an uptrend, you want to see price making higher highs and higher lows. If price makes a lower low, it might signal that the uptrend is weakening or ending. This is called a "break of structure" and is an important signal for price action traders. :::
Candlestick Basics
Candlesticks are the building blocks of price action analysis. Each candlestick shows you four key pieces of information:
1. Open - The price when the time period started 2. High - The highest price during the time period 3. Low - The lowest price during the time period 4. Close - The price when the time period ended
The body of the candlestick (the thick part) shows the difference between open and close. The wicks (thin lines) show how far price traveled beyond the open and close.
Bullish candlesticks close higher than they opened (usually green or white) Bearish candlesticks close lower than they opened (usually red or black)
Key Price Action Patterns
Now that you understand the basics, let's explore some of the most important price action patterns that beginners should learn.
Pin Bars (Hammer and Shooting Star)
Pin bars are one of the most reliable single-candlestick patterns. They show rejection at a price level and often signal reversals.
Characteristics of a pin bar:
- Long wick (at least 2-3 times the body length)
- Small body
- The wick shows rejection of higher or lower prices
Bullish pin bar (Hammer): Long lower wick, small body at the top of the range Bearish pin bar (Shooting star): Long upper wick, small body at the bottom of the range
:::warning Pin bars are most reliable when they form at key support or resistance levels. A pin bar in the middle of nowhere is much less significant than one that forms at a major level. :::
Inside Bars
An inside bar is a candlestick that forms completely within the range of the previous candlestick. Inside bars represent consolidation and often lead to breakout moves.
How to trade inside bars: 1. Wait for price to break above or below the inside bar 2. Enter in the direction of the breakout 3. Set your stop loss on the opposite side of the inside bar 4. Target the next significant support or resistance level
Engulfing Patterns
Engulfing patterns consist of two candlesticks where the second candle completely "engulfs" or covers the first candle's body.
Bullish engulfing: A large green candle engulfs a smaller red candle, suggesting buying pressure Bearish engulfing: A large red candle engulfs a smaller green candle, suggesting selling pressure
Double Tops and Double Bottoms
These are reversal patterns that form when price tests a level twice and fails to break through.
Double top: Price reaches a high, pulls back, then returns to test the same high but fails to break above it. This suggests selling pressure at that level.
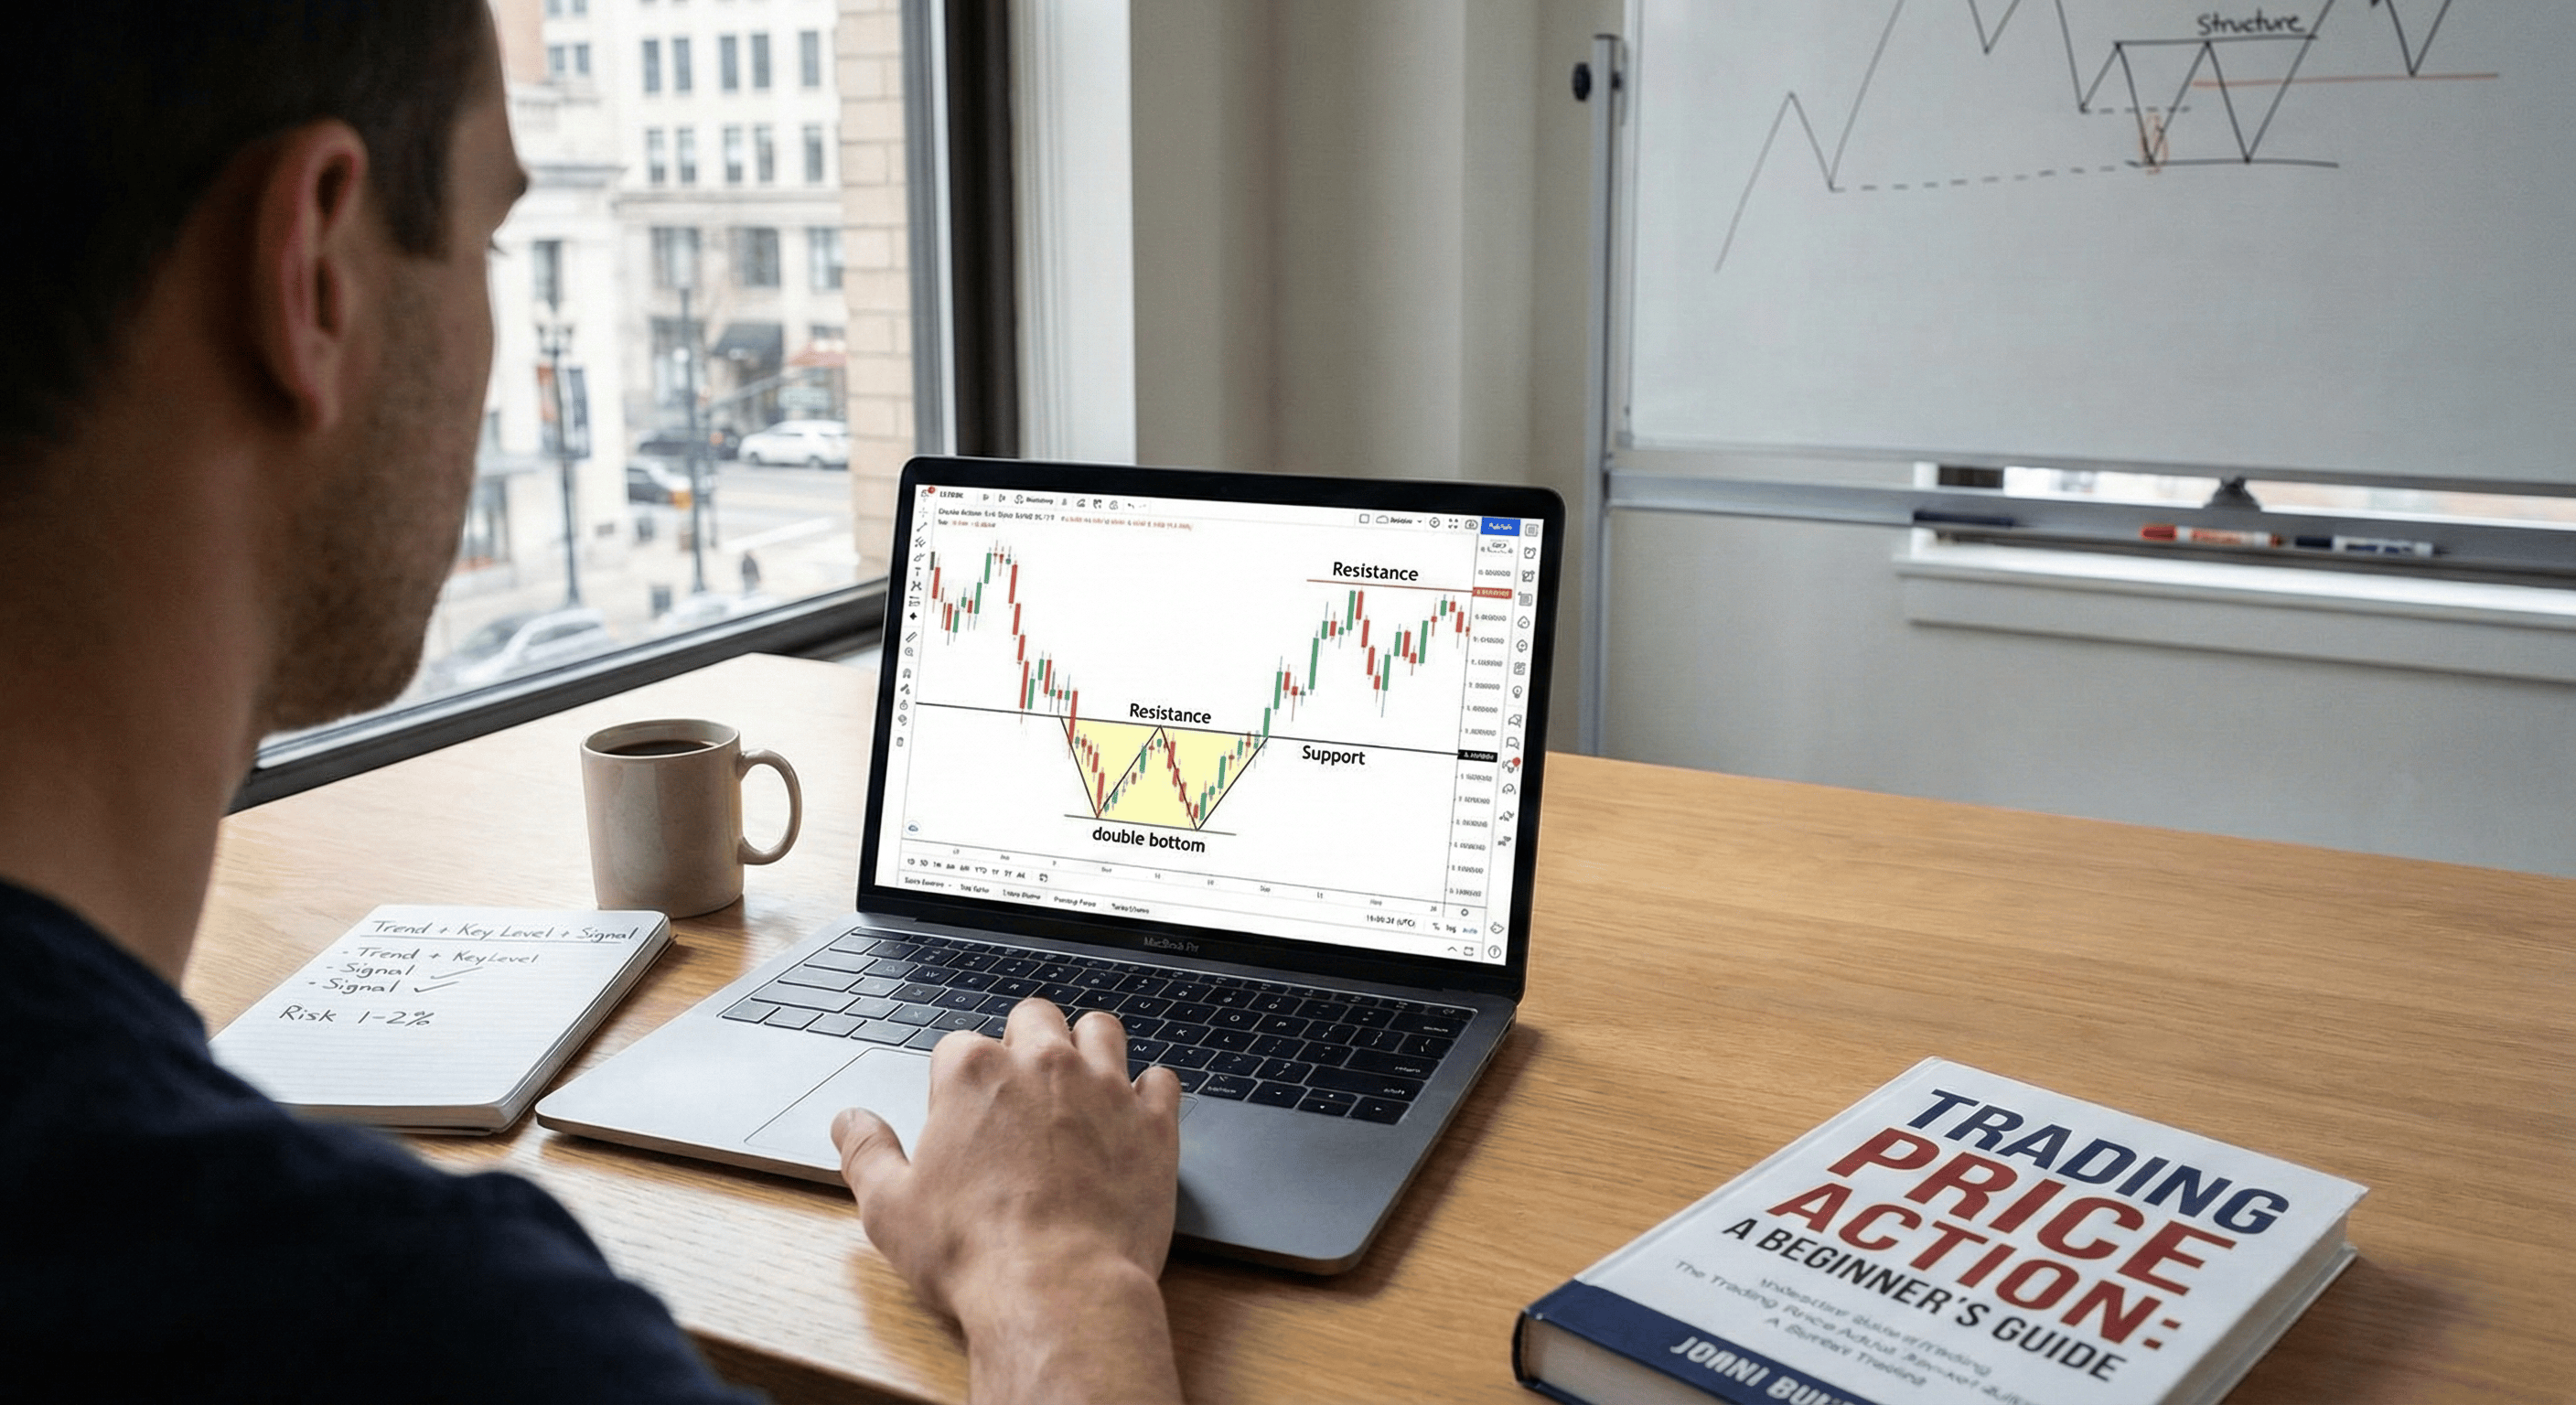
Double bottom: Price reaches a low, bounces, then returns to test the same low but fails to break below it. This suggests buying pressure at that level.
:::example Imagine EUR/USD rallies to 1.2000, then falls to 1.1900, then rallies back to 1.2000 but can't break above it. This double top at 1.2000 suggests that sellers are active at this level and price might decline. :::
How to Analyze Market Structure
Analyzing market structure is crucial for understanding the bigger picture and making informed trading decisions. Here's a step-by-step approach:
Step 1: Identify the Overall Trend
Start by zooming out and looking at the bigger picture:
- Are you seeing higher highs and higher lows (uptrend)?
- Lower highs and lower lows (downtrend)?
- Or sideways movement between levels (range)?
Step 2: Mark Key Levels
Identify and mark important support and resistance levels:
- Previous swing highs and lows
- Levels where price has bounced multiple times
- Psychological round numbers
- Trend lines connecting significant points
Step 3: Look for Structure Breaks
Watch for breaks in market structure:
- In an uptrend, watch for a break below a previous higher low
- In a downtrend, watch for a break above a previous lower high
- These breaks often signal trend changes
Step 4: Analyze Momentum
Look at how price moves between levels:
- Strong, impulsive moves suggest momentum in that direction
- Slow, choppy moves suggest weak momentum
- The speed of price movement can tell you about market sentiment
:::tip Use multiple timeframes to get a complete picture. Look at a higher timeframe for the overall trend and structure, then zoom in to a lower timeframe for precise entry and exit points. :::
Putting It All Together: A Trading Approach
Here's a simple but effective approach to price action trading that beginners can start using immediately:
The Setup Checklist
Before taking any trade, make sure you can answer "yes" to these questions:
1. Is there a clear trend or range? You need context for your trade 2. Are you trading at a significant level? Support, resistance, or structure level 3. Is there a clear price action signal? Pin bar, engulfing pattern, or structure break 4. Do you have a logical stop loss level? Where would you be wrong about the trade? 5. Is the reward worth the risk? Aim for at least 1:2 risk-to-reward ratio
Entry Rules
For trend continuation trades:
- Wait for a pullback to a key level in a trending market
- Look for price action confirmation (pin bar, inside bar breakout)
- Enter when price resumes in the trend direction
For reversal trades:
- Look for signs of trend weakness (structure break, momentum divergence)
- Wait for price action confirmation at a key level
- Enter when price shows clear rejection of the level
Exit Rules
Stop Loss:
- Place stops beyond key levels, not at arbitrary points
- For pin bars, place stops beyond the tail
- For breakouts, place stops back inside the pattern
Take Profit:
- Target the next significant support or resistance level
- Consider taking partial profits at intermediate levels
- Let some profits run if momentum is strong
:::example Let's say you identify an uptrend in EUR/USD. Price pulls back to a key support level at 1.1800 and forms a bullish pin bar. You could enter long above the pin bar high, set your stop below the pin bar low, and target the next resistance level at 1.1900. :::
Common Beginner Mistakes to Avoid
Learning price action takes time and practice. Here are the most common mistakes beginners make and how to avoid them:
1. Trading Every Pattern You See
Mistake: Taking every pin bar or inside bar without considering context Solution: Only trade patterns at significant levels with clear market structure
2. Ignoring the Bigger Picture
Mistake: Focusing only on short-term patterns without understanding the overall trend Solution: Always check higher timeframes for context before trading
3. Poor Risk Management
Mistake: Risking too much per trade or not having a clear stop loss plan Solution: Never risk more than 1-2% of your account per trade and always know where your stop loss will be before entering
4. Forcing Trades
Mistake: Trying to trade when there are no clear setups Solution: Wait for high-probability setups that meet all your criteria. Sometimes the best trade is no trade
5. Not Keeping Records
Mistake: Not tracking trades or learning from mistakes Solution: Keep a trading journal with screenshots, reasons for entry/exit, and lessons learned
:::warning Price action trading requires patience and discipline. Don't expect to master it overnight. Focus on learning one pattern or concept at a time, and practice identifying it on charts before moving to the next concept. :::
Building Your Skills
To become proficient at price action trading:
1. Start with demo trading - Practice identifying patterns and taking trades without risking real money 2. Focus on one market initially - Master price action in one market before expanding to others 3. Use higher timeframes - Daily and 4-hour charts are less noisy and better for beginners 4. Study historical charts - Look at past price movements to see how patterns played out 5. Be patient - Good price action setups don't come every day
Developing Your Trading Plan
A successful price action trader needs a clear trading plan that includes:
- Market selection - Which markets you'll trade and why
- Timeframe selection - Your primary analysis timeframe and entry timeframe
- Setup criteria - Exactly what conditions must be met before you'll consider a trade
- Risk management rules - How much you'll risk per trade and total exposure limits
- Trade management - How you'll handle winning and losing trades
Conclusion
Price action trading is both an art and a science. While the concepts are simple to understand, mastering them takes time, practice, and patience. The key is to start with the basics - understanding support and resistance, market structure, and simple candlestick patterns - and gradually build your knowledge and experience.
Remember that price action is not about predicting the future with certainty. It's about reading market behavior and positioning yourself with favorable odds. Even the best price action traders are wrong sometimes, but they manage their risk carefully and let their winners run.
The beauty of price action trading is that once you learn these skills, they'll serve you throughout your trading career. Unlike indicators that can become obsolete or strategies that stop working, price action principles are timeless because they're based on human psychology and market behavior that doesn't change.
Start practicing today by opening up your charting platform and identifying support and resistance levels, trends, and simple patterns like pin bars. The more you practice reading price action, the more natural it will become. With time and dedication, you'll develop the ability to read the story that price tells and make more informed trading decisions.
:::tip Ready to start your price action journey? Begin by analyzing just one market on daily charts. Spend time identifying key levels, market structure, and simple patterns. Practice makes perfect, and every chart you analyze will improve your price action reading skills. :::