# Price Action vs. Indicators: Which Trading Approach Should You Master?
Every trader faces a fundamental question when developing their trading strategy: should they rely on pure price action or use technical indicators? This decision shapes everything from chart setup to trade execution. Understanding the difference between price action vs indicators isn't just academic—it's crucial for developing a consistent, profitable trading approach.
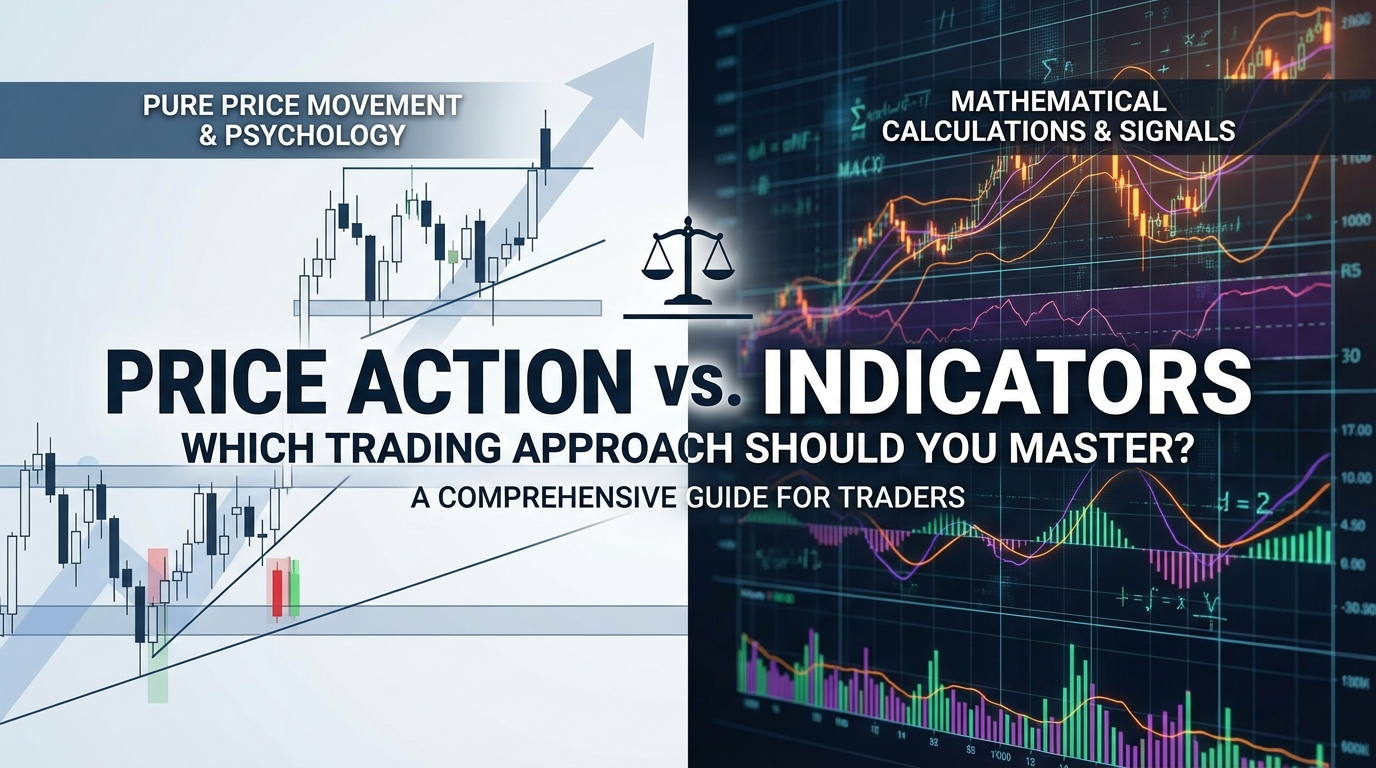
Price action traders read the story told by candlesticks, support and resistance levels, and market structure. Indicator-based traders rely on mathematical calculations and oscillators to identify trends and momentum. Both approaches have passionate advocates, but which one is right for you?
Table of Contents
- [Understanding Price Action Trading](#understanding-price-action-trading)
- [The World of Technical Indicators](#the-world-of-technical-indicators)
- [Price Action vs Indicators: Key Differences](#price-action-vs-indicators-key-differences)
- [Advantages and Disadvantages of Each Approach](#advantages-and-disadvantages-of-each-approach)
- [Combining Price Action and Indicators](#combining-price-action-and-indicators)
- [Choosing the Right Approach for Your Trading Style](#choosing-the-right-approach-for-your-trading-style)
Understanding Price Action Trading
Price action trading focuses on analyzing raw price movements without the use of lagging indicators. This approach treats the price chart as a battlefield between buyers and sellers, where every candlestick tells a story about market sentiment and future direction.
Core Elements of Price Action
Candlestick Patterns: The foundation of price action analysis lies in understanding what individual candles and patterns reveal about market psychology. A long-bodied bullish candle shows strong buying pressure, while a doji suggests indecision.
Support and Resistance Levels: These horizontal and diagonal lines represent areas where price has historically struggled to break through. Price action traders use these levels to identify potential entry and exit points.
Market Structure: Understanding how markets move in trends, ranging phases, and breakouts helps traders identify the current market condition and adapt their strategy accordingly.
:::key-concept Price action is based on the principle that all market information is already reflected in the price. Everything you need to know about supply, demand, and market sentiment is visible on the chart. :::
Popular Price Action Strategies
1. Pin Bar Reversals: Long-tailed candles that show rejection at key levels 2. Inside Bar Breakouts: Consolidation patterns followed by directional moves 3. Engulfing Patterns: Strong reversal signals at significant levels 4. Break and Retest: Momentum moves followed by pullbacks to broken levels
:::example Consider a EUR/USD chart showing price approaching a major resistance level at 1.2000. A price action trader notices a long upper wick (pin bar) forming right at this level, indicating strong selling pressure. They enter a short position with a stop loss above the pin bar high and target the next support level. :::
The World of Technical Indicators
Technical indicators are mathematical calculations based on price, volume, or open interest data. These tools attempt to predict future price movements by analyzing historical patterns and relationships.
Categories of Technical Indicators
Trend Indicators: Moving averages, MACD, and ADX help identify trend direction and strength. These indicators smooth out price data to reveal the underlying trend.
Momentum Oscillators: RSI, Stochastic, and Williams %R measure the speed and magnitude of price movements, helping identify overbought and oversold conditions.
Volume Indicators: On-Balance Volume (OBV) and Volume Price Trend (VPT) incorporate volume data to confirm price movements and identify potential reversals.
Volatility Indicators: Bollinger Bands and Average True Range (ATR) measure market volatility and help traders adjust position sizes and stop losses accordingly.
:::tip The key to successful indicator trading is understanding what each indicator measures and how it behaves in different market conditions. No single indicator works in all situations. :::
How Indicators Generate Signals
Indicators typically generate trading signals through:
- Crossovers: When two moving averages cross or when price crosses an indicator line
- Extremes: When oscillators reach overbought or oversold levels
- Divergences: When price and indicator move in opposite directions
- Breakouts: When indicators break above or below significant levels
Price Action vs Indicators: Key Differences
Understanding the fundamental differences between price action vs indicators helps traders make informed decisions about their approach.
Response Time and Timing
Price Action: Provides immediate, real-time information about market sentiment. Every new candle offers fresh insight into the ongoing battle between buyers and sellers.
Indicators: Most indicators lag behind price action because they're calculated using historical data. This lag can result in late entry and exit signals.
Complexity and Learning Curve
Price Action: Requires deep understanding of market psychology and pattern recognition. The learning curve is steep but leads to intuitive trading decisions.
Indicators: Often appear more straightforward with clear buy/sell signals. However, understanding when and how to use different indicators effectively requires significant experience.
Chart Clarity
Price Action: Results in clean charts that focus attention on what matters most—price movement. This clarity can improve decision-making and reduce analysis paralysis.
Indicators: Can clutter charts with multiple lines, oscillators, and signals, potentially leading to conflicting information and confusion.
:::warning Beware of indicator overload! Too many indicators can create conflicting signals and lead to analysis paralysis. Many successful traders use just 2-3 carefully selected indicators. :::
Adaptability to Market Conditions
Price Action: Naturally adapts to changing market conditions because it reflects current supply and demand dynamics. Works equally well in trending and ranging markets with proper interpretation.
Indicators: May perform differently in various market conditions. Trend-following indicators struggle in choppy markets, while oscillators may give false signals in strong trends.
Advantages and Disadvantages of Each Approach
Price Action Trading
Advantages:
- Immediate, real-time market information
- Clean, uncluttered charts promote clarity
- Universal application across all timeframes and markets
- Develops deep understanding of market psychology
- No lagging signals
- Works well in all market conditions once mastered
Disadvantages:
- Steep learning curve requiring significant experience
- Subjective interpretation can lead to inconsistent results
- Requires strong emotional control and discipline
- May miss some quantified opportunities that indicators reveal
- Can be overwhelming for beginners
Indicator-Based Trading
Advantages:
- Provides objective, quantified signals
- Easier for beginners to understand initially
- Can identify mathematical relationships not obvious in raw price
- Systematic approach reduces emotional decision-making
- Backtesting is more straightforward
- Can automate trading strategies
Disadvantages:
- Lagging signals can result in poor entry/exit timing
- False signals are common, especially in choppy markets
- Over-reliance can lead to ignoring obvious price action signals
- Chart clutter can cause analysis paralysis
- May not adapt quickly to changing market conditions
:::key-concept Neither approach is inherently superior. The best choice depends on your personality, trading style, available time, and market understanding. Many successful traders combine elements of both approaches. :::
Combining Price Action and Indicators
Rather than choosing between price action vs indicators, many experienced traders find success in combining both approaches. This hybrid method leverages the strengths of each while minimizing their weaknesses.
Effective Combination Strategies
Indicators for Context, Price Action for Entry: Use trend indicators like moving averages to identify overall market direction, then use price action patterns for precise entry and exit timing.
Price Action for Structure, Indicators for Confirmation: Identify key support/resistance levels and chart patterns using price action, then use momentum oscillators to confirm the strength of potential moves.
Multi-Timeframe Analysis: Use indicators on higher timeframes to determine trend direction and price action on lower timeframes for entry signals.
:::example A trader identifies an uptrend using the 20 and 50-period moving averages on the daily chart. They then switch to the 4-hour chart and wait for price to pull back to a key support level. When a bullish pin bar forms at this support with RSI showing oversold conditions, they enter a long position. :::
Best Practices for Combining Approaches
1. Keep it Simple: Limit yourself to 2-3 indicators maximum to avoid conflicting signals 2. Understand Each Tool: Know exactly what each indicator measures and when it works best 3. Price Action Takes Priority: When price action and indicators conflict, give more weight to what price is actually doing 4. Test Your System: Backtest and forward-test your combined approach before risking real money 5. Stay Consistent: Stick to your predetermined rules regardless of emotions
Common Pitfalls to Avoid
- Using too many indicators creating analysis paralysis
- Ignoring clear price action signals because indicators suggest otherwise
- Changing indicators frequently instead of mastering a few
- Over-optimizing based on past performance
- Failing to adapt the approach to different market conditions
Choosing the Right Approach for Your Trading Style
The decision between price action vs indicators isn't just about market analysis—it's about aligning your trading approach with your personality, schedule, and goals.
Consider Your Trading Personality
Analytical Types often gravitate toward indicators because they provide quantifiable, objective data. If you enjoy mathematical analysis and systematic approaches, indicator-based trading might suit you better.
Intuitive Types may prefer price action trading because it requires reading market sentiment and psychology. If you're comfortable making decisions based on experience and pattern recognition, price action could be your strength.
Time Availability Factors
Limited Time: If you can only check charts occasionally, indicator-based systems with clear signals might work better. Many indicators can generate alerts when conditions are met.
Flexible Schedule: Price action trading often requires more active chart monitoring to catch the subtle nuances of market behavior, making it suitable for traders with more time.
Market Experience Level
Beginners might find indicator-based approaches initially easier to understand, though they should also learn basic price action concepts to develop market intuition.
Experienced Traders often migrate toward price action or hybrid approaches as they develop better market understanding and want to reduce reliance on lagging indicators.
:::tip Start with basic price action concepts regardless of which approach you choose. Understanding support/resistance, trend structure, and basic candlestick patterns provides a foundation that benefits all traders. :::
Recommended Learning Path
1. Foundation: Learn basic price action concepts (support/resistance, trend lines, candlesticks) 2. Indicators: Understand how major indicators work (moving averages, RSI, MACD) 3. Integration: Practice combining both approaches on demo accounts 4. Specialization: Focus on the approach that best matches your personality and results 5. Mastery: Continuously refine your chosen method through practice and review
Testing Your Chosen Approach
Before committing to either pure price action, indicator-based trading, or a hybrid approach:
- Demo Trade: Spend at least 3-6 months testing your approach on a demo account
- Keep Records: Document every trade with screenshots and reasoning
- Analyze Results: Review both winning and losing trades to identify patterns
- Adjust Gradually: Make small improvements rather than wholesale changes
- Paper Trade: Test new concepts on paper before implementing them with real money
Conclusion
The debate between price action vs indicators doesn't have a universal answer because trading success depends on finding an approach that matches your personality, schedule, and goals. Price action trading offers immediate, unfiltered market information and works well for traders who enjoy reading market psychology. Indicator-based trading provides objective, quantified signals that can be easier to systematize and automate.
Many successful traders find that the most effective approach combines elements of both methods—using indicators for market context and trend direction while relying on price action for precise timing and execution. The key is to start with a solid foundation in both concepts, then gradually develop expertise in the approach that resonates most with your trading style.
Remember that consistency and discipline matter more than the specific method you choose. Whether you become a pure price action trader, an indicator enthusiast, or adopt a hybrid approach, focus on mastering your chosen method rather than constantly switching between different techniques.
Ready to discover which approach works best for you? Start by analyzing charts using both pure price action and simple indicators like moving averages or RSI. Practice identifying the same trading opportunities using both methods, and notice which approach gives you more confidence and better results. Your trading journey begins with this first step toward mastery.