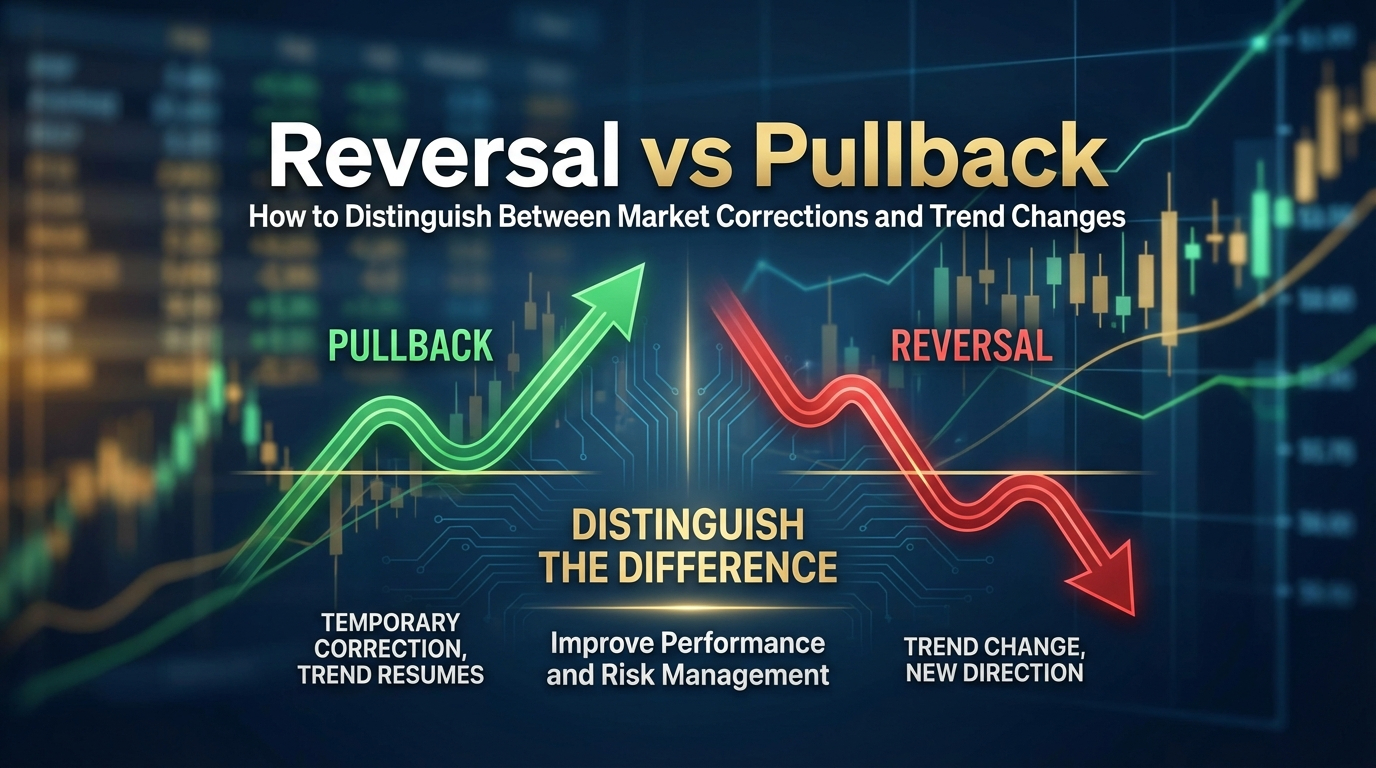
# Reversal vs Pullback: How to Distinguish Between Market Corrections and Trend Changes
One of the most challenging aspects of trading is determining whether a price movement represents a temporary pullback or a genuine trend reversal. This distinction can make the difference between profit and loss, as misreading these signals often leads to premature exits from profitable positions or holding onto losing trades too long.
Understanding the reversal vs pullback dynamic is essential for traders across all timeframes and markets. Whether you're day trading forex pairs, swing trading stocks, or analyzing cryptocurrency charts, the ability to differentiate between these two scenarios will significantly improve your trading performance and risk management.
Table of Contents
- [Understanding Market Movements: The Foundation](#understanding-market-movements-the-foundation)
- [Defining Pullbacks: Temporary Corrections in Trends](#defining-pullbacks-temporary-corrections-in-trends)
- [Identifying True Reversals: When Trends Change Direction](#identifying-true-reversals-when-trends-change-direction)
- [Key Indicators That Distinguish Reversals from Pullbacks](#key-indicators-that-distinguish-reversals-from-pullbacks)
- [Practical Trading Applications and Risk Management](#practical-trading-applications-and-risk-management)
- [Advanced Techniques for Market Analysis](#advanced-techniques-for-market-analysis)
Understanding Market Movements: The Foundation
Before diving into the specifics of the reversal vs pullback debate, it's crucial to understand that markets move in waves rather than straight lines. These wave-like movements create opportunities for traders but also present challenges in interpretation.
:::key-concept Markets exhibit fractal behavior, meaning similar patterns occur across different timeframes. A pullback on a daily chart might appear as a reversal on a 15-minute chart, emphasizing the importance of multi-timeframe analysis. :::
Price movements in financial markets follow predictable patterns based on supply and demand dynamics, market psychology, and institutional behavior. When prices trend upward, they don't move in a straight line but rather in a series of higher highs and higher lows, with periodic corrections along the way.
These corrections serve several purposes:
- Profit-taking by early participants: Traders who entered positions early in the trend may take profits, causing temporary selling pressure
- New participant entry: Corrections provide entry opportunities for traders who missed the initial move
- Market rebalancing: Temporary corrections help markets find fair value before continuing in the primary direction
- Testing support levels: Pullbacks test whether key support levels hold, confirming trend strength
The Psychology Behind Market Movements
The emotional component of trading plays a significant role in creating both pullbacks and reversals. Fear and greed drive market participants to make decisions that create these price patterns.
During pullbacks, fear temporarily overcomes greed as some traders exit positions, but the underlying trend sentiment remains intact. In reversals, fundamental shifts in market perception cause a more permanent change in supply and demand dynamics.
Defining Pullbacks: Temporary Corrections in Trends
A pullback represents a temporary price movement against the prevailing trend that typically retraces between 23.6% and 61.8% of the previous price movement using Fibonacci analysis. These corrections are considered healthy and normal parts of trending markets.
:::example Consider a stock trending upward from $100 to $120. A pullback might see the price decline to $115 or $110 before resuming the upward movement. This temporary correction allows the market to "catch its breath" before continuing higher. :::
Characteristics of Pullbacks
Pullbacks exhibit several distinguishing characteristics:
Duration and Depth:
- Usually last 3-10 trading sessions in trending markets
- Retrace 25-50% of the previous move in most cases
- Volume often decreases during the pullback phase
- Price action remains above key support levels
Market Structure:
- The overall trend structure remains intact
- Higher lows in uptrends (or lower highs in downtrends) are maintained
- Key moving averages continue to provide support/resistance
- Momentum indicators show oversold conditions but don't break key levels
Institutional Behavior:
- Smart money often uses pullbacks as entry opportunities
- Volume expansion typically occurs when the trend resumes
- Options flow and institutional positioning remain aligned with the trend
:::tip The "three-push rule" can help identify pullbacks: if price makes three consecutive pushes against the trend without breaking key levels, it's likely a pullback rather than a reversal. :::
Common Pullback Patterns
Several chart patterns commonly indicate pullbacks rather than reversals:
1. Flag Patterns: Brief consolidations that slope against the trend 2. Pennant Patterns: Triangular consolidations after strong moves 3. Wedge Corrections: Narrowing price ranges that resolve in the trend direction 4. ABC Corrections: Three-wave counter-trend movements
Identifying True Reversals: When Trends Change Direction
A reversal represents a fundamental change in market sentiment that results in a sustained move in the opposite direction of the previous trend. Unlike pullbacks, reversals involve deeper retracements and longer time periods to develop.
The reversal vs pullback distinction becomes crucial when reversals typically retrace 61.8% or more of the previous move and often lead to new trends in the opposite direction.
:::warning Reversals are less common than pullbacks, occurring roughly 20-30% of the time when markets appear to be changing direction. This statistical reality means traders should generally assume pullbacks until proven otherwise. :::
Key Reversal Characteristics
Structural Changes:
- Breaking of key support/resistance levels with conviction
- Failure to maintain trend structure (higher lows in uptrends)
- Moving average crossovers on multiple timeframes
- Momentum divergences preceding the reversal
Volume and Participation:
- Increased volume on moves against the trend
- Breadth indicators showing broad participation in the reversal
- Options positioning shifting to favor the new direction
- Institutional selling/buying pressure evident
Time and Magnitude:
- Reversals often take longer to develop (weeks to months)
- Deeper price retracements (typically >61.8%)
- Multiple timeframe confirmation
- Failed attempts to resume the previous trend
Classic Reversal Patterns
Several well-established patterns signal potential reversals:
1. Double Tops/Bottoms: Two similar highs/lows with a significant valley/peak between them 2. Head and Shoulders: Three peaks/troughs with the middle one being highest/lowest 3. Rising/Falling Wedges: Narrowing patterns that break against the wedge direction 4. Triple Tops/Bottoms: Three similar extremes showing exhaustion 5. Diamond Tops/Bottoms: Complex patterns combining triangles and head-and-shoulders
Key Indicators That Distinguish Reversals from Pullbacks
Successfully distinguishing between reversals and pullbacks requires analyzing multiple indicators simultaneously. No single indicator provides foolproof signals, but combining several approaches increases accuracy significantly.
Volume Analysis
Volume provides crucial insights into the strength and sustainability of price movements:
Pullback Volume Characteristics:
- Decreasing volume on moves against the trend
- Higher volume when the trend resumes
- Volume often remains below recent averages during corrections
Reversal Volume Characteristics:
- Increasing volume on moves against the previous trend
- Volume climaxes often occur at reversal points
- Sustained high volume during the new trend development
:::example If a stock in an uptrend drops 8% on light volume over three days, then rallies 5% on heavy volume in one day, this suggests a pullback rather than a reversal. The volume pattern indicates institutions are buying the dip. :::
Momentum Indicators
Momentum indicators help identify the underlying strength of price movements:
RSI (Relative Strength Index):
- Pullbacks often show RSI bouncing from oversold/overbought levels
- Reversals frequently exhibit momentum divergences
- RSI trend lines breaking can signal reversal beginnings
MACD (Moving Average Convergence Divergence):
- Pullbacks typically show MACD remaining above/below zero line
- Reversals often coincide with MACD zero line crossovers
- Signal line crossovers provide early reversal warnings
Stochastic Oscillators:
- Quick reversals from extreme levels suggest pullbacks
- Sustained periods in overbought/oversold zones may indicate reversals
Support and Resistance Analysis
The behavior of price around key levels provides valuable clues:
Pullback Behavior:
- Price respects major support/resistance levels
- Previous resistance becomes support (or vice versa)
- Moving averages provide dynamic support/resistance
Reversal Behavior:
- Clean breaks through major levels with volume
- Failed tests of previous support/resistance
- Multiple timeframe level breaks
:::key-concept The "50% rule" suggests that pullbacks rarely exceed 50% of the previous move, while reversals typically retrace more than 50%. This simple guideline helps frame expectations. :::
Time-Based Analysis
The duration of price movements offers important context:
Pullback Timing:
- Quick corrections (3-10 periods)
- Swift resumption of the primary trend
- Time symmetry with previous corrections
Reversal Timing:
- Extended consolidation periods
- Multiple failed attempts to continue the previous trend
- Time taken often equals the magnitude of the reversal
Practical Trading Applications and Risk Management
Understanding the reversal vs pullback distinction directly impacts trading decisions, position sizing, and risk management strategies. Successful traders adjust their approach based on which scenario they believe is unfolding.
Trading Pullbacks
When identifying a potential pullback:
Entry Strategies:
- Wait for price to reach key support levels
- Look for bullish reversal patterns at support
- Use tight stop losses below support
- Size positions larger due to better risk/reward ratios
Management Techniques:
- Trail stops behind key levels as trend resumes
- Take profits at previous highs or resistance levels
- Add to positions on trend continuation signals
- Maintain positions through minor fluctuations
:::tip The "buying the dip" strategy works best when multiple timeframes confirm the pullback scenario. Always verify that higher timeframe trends remain intact before entering positions. :::
Trading Reversals
When a reversal appears to be developing:
Entry Approaches:
- Wait for confirmation before entering
- Use wider stop losses to account for volatility
- Start with smaller position sizes
- Look for multiple timeframe confirmation
Risk Management:
- Expect higher volatility and choppy price action
- Use multiple exits rather than single target approach
- Monitor for false breakouts and failed reversals
- Adjust position sizes based on uncertainty levels
Position Sizing Considerations
The reversal vs pullback assessment should influence position sizing:
Pullback Scenarios:
- Can justify larger positions due to clearer risk parameters
- Stop losses can be placed closer to entry points
- Higher probability setups warrant increased allocation
Reversal Scenarios:
- Require smaller initial positions due to uncertainty
- Wider stops necessitate reduced position sizes
- Scale into positions as confirmation develops
Advanced Techniques for Market Analysis
Multi-Timeframe Analysis
The most effective way to distinguish reversals from pullbacks involves analyzing multiple timeframes simultaneously:
Timeframe Hierarchy: 1. Primary timeframe: Your main trading timeframe 2. Higher timeframe: 4-5x longer for trend context 3. Lower timeframe: 4-5x shorter for precise entries
Analysis Process:
- Start with higher timeframes to identify the major trend
- Use primary timeframe for pullback/reversal analysis
- Drop to lower timeframes for entry and exit timing
- Ensure all timeframes align before taking positions
:::example A day trader using 15-minute charts should analyze 1-hour charts for trend context and 3-minute charts for precise entries. If the 1-hour shows a strong uptrend and the 15-minute shows a potential pullback, look for buying opportunities on the 3-minute chart. :::
Advanced Pattern Recognition
Wyckoff Analysis:
- Accumulation/distribution phases help identify reversals
- Spring and upthrust patterns signal trend changes
- Volume spread analysis confirms price movements
Elliott Wave Theory:
- Wave counting helps distinguish corrective from impulsive moves
- Pullbacks typically represent waves 2 or 4
- Reversals often begin after wave 5 completions
Smart Money Concepts:
- Order blocks indicate institutional interest levels
- Fair value gaps show areas of price inefficiency
- Liquidity sweeps often precede true directional moves
Technology and Tools
Algorithmic Analysis:
- Use screening tools to identify potential setups
- Backtest strategies on historical data
- Monitor real-time alerts for key level breaks
Market Profile Analysis:
- Value area analysis shows institutional acceptance
- Point of control levels provide key reference points
- Profile shapes indicate market structure changes
Sentiment Indicators:
- Options put/call ratios
- VIX levels and term structure
- Insider buying/selling activity
- Analyst recommendation changes
Creating a Decision Framework
Develop a systematic approach to the reversal vs pullback analysis:
Checklist Approach: 1. ✓ Identify the primary trend direction 2. ✓ Measure the retracement percentage 3. ✓ Analyze volume characteristics 4. ✓ Check momentum indicator signals 5. ✓ Evaluate support/resistance behavior 6. ✓ Consider time factors 7. ✓ Review multiple timeframes 8. ✓ Assess risk/reward scenarios
Scoring System:
- Assign points for pullback vs. reversal indicators
- Weight factors based on historical reliability
- Require minimum scores before taking positions
- Regularly review and adjust the system
Conclusion
Mastering the distinction between reversals and pullbacks is fundamental to trading success. The reversal vs pullback analysis requires patience, discipline, and a systematic approach that considers multiple factors simultaneously.
Key takeaways for traders:
- Pullbacks are more common than reversals, occurring roughly 70-80% of the time when trends appear to be changing
- Volume analysis provides crucial confirmation for both scenarios
- Multiple timeframe analysis significantly improves accuracy
- Risk management must adapt based on the scenario assessment
- No single indicator provides perfect signals; combine multiple approaches
The ability to correctly identify whether a market movement represents a temporary correction or a genuine trend change will improve your entry timing, exit strategies, and overall profitability. Remember that even experienced traders sometimes misread these signals, which is why proper risk management and position sizing remain essential.
Start applying these concepts to your chart analysis today. Practice identifying pullbacks and reversals on historical charts across different markets and timeframes. The more you develop this skill, the more confident and profitable your trading decisions will become.