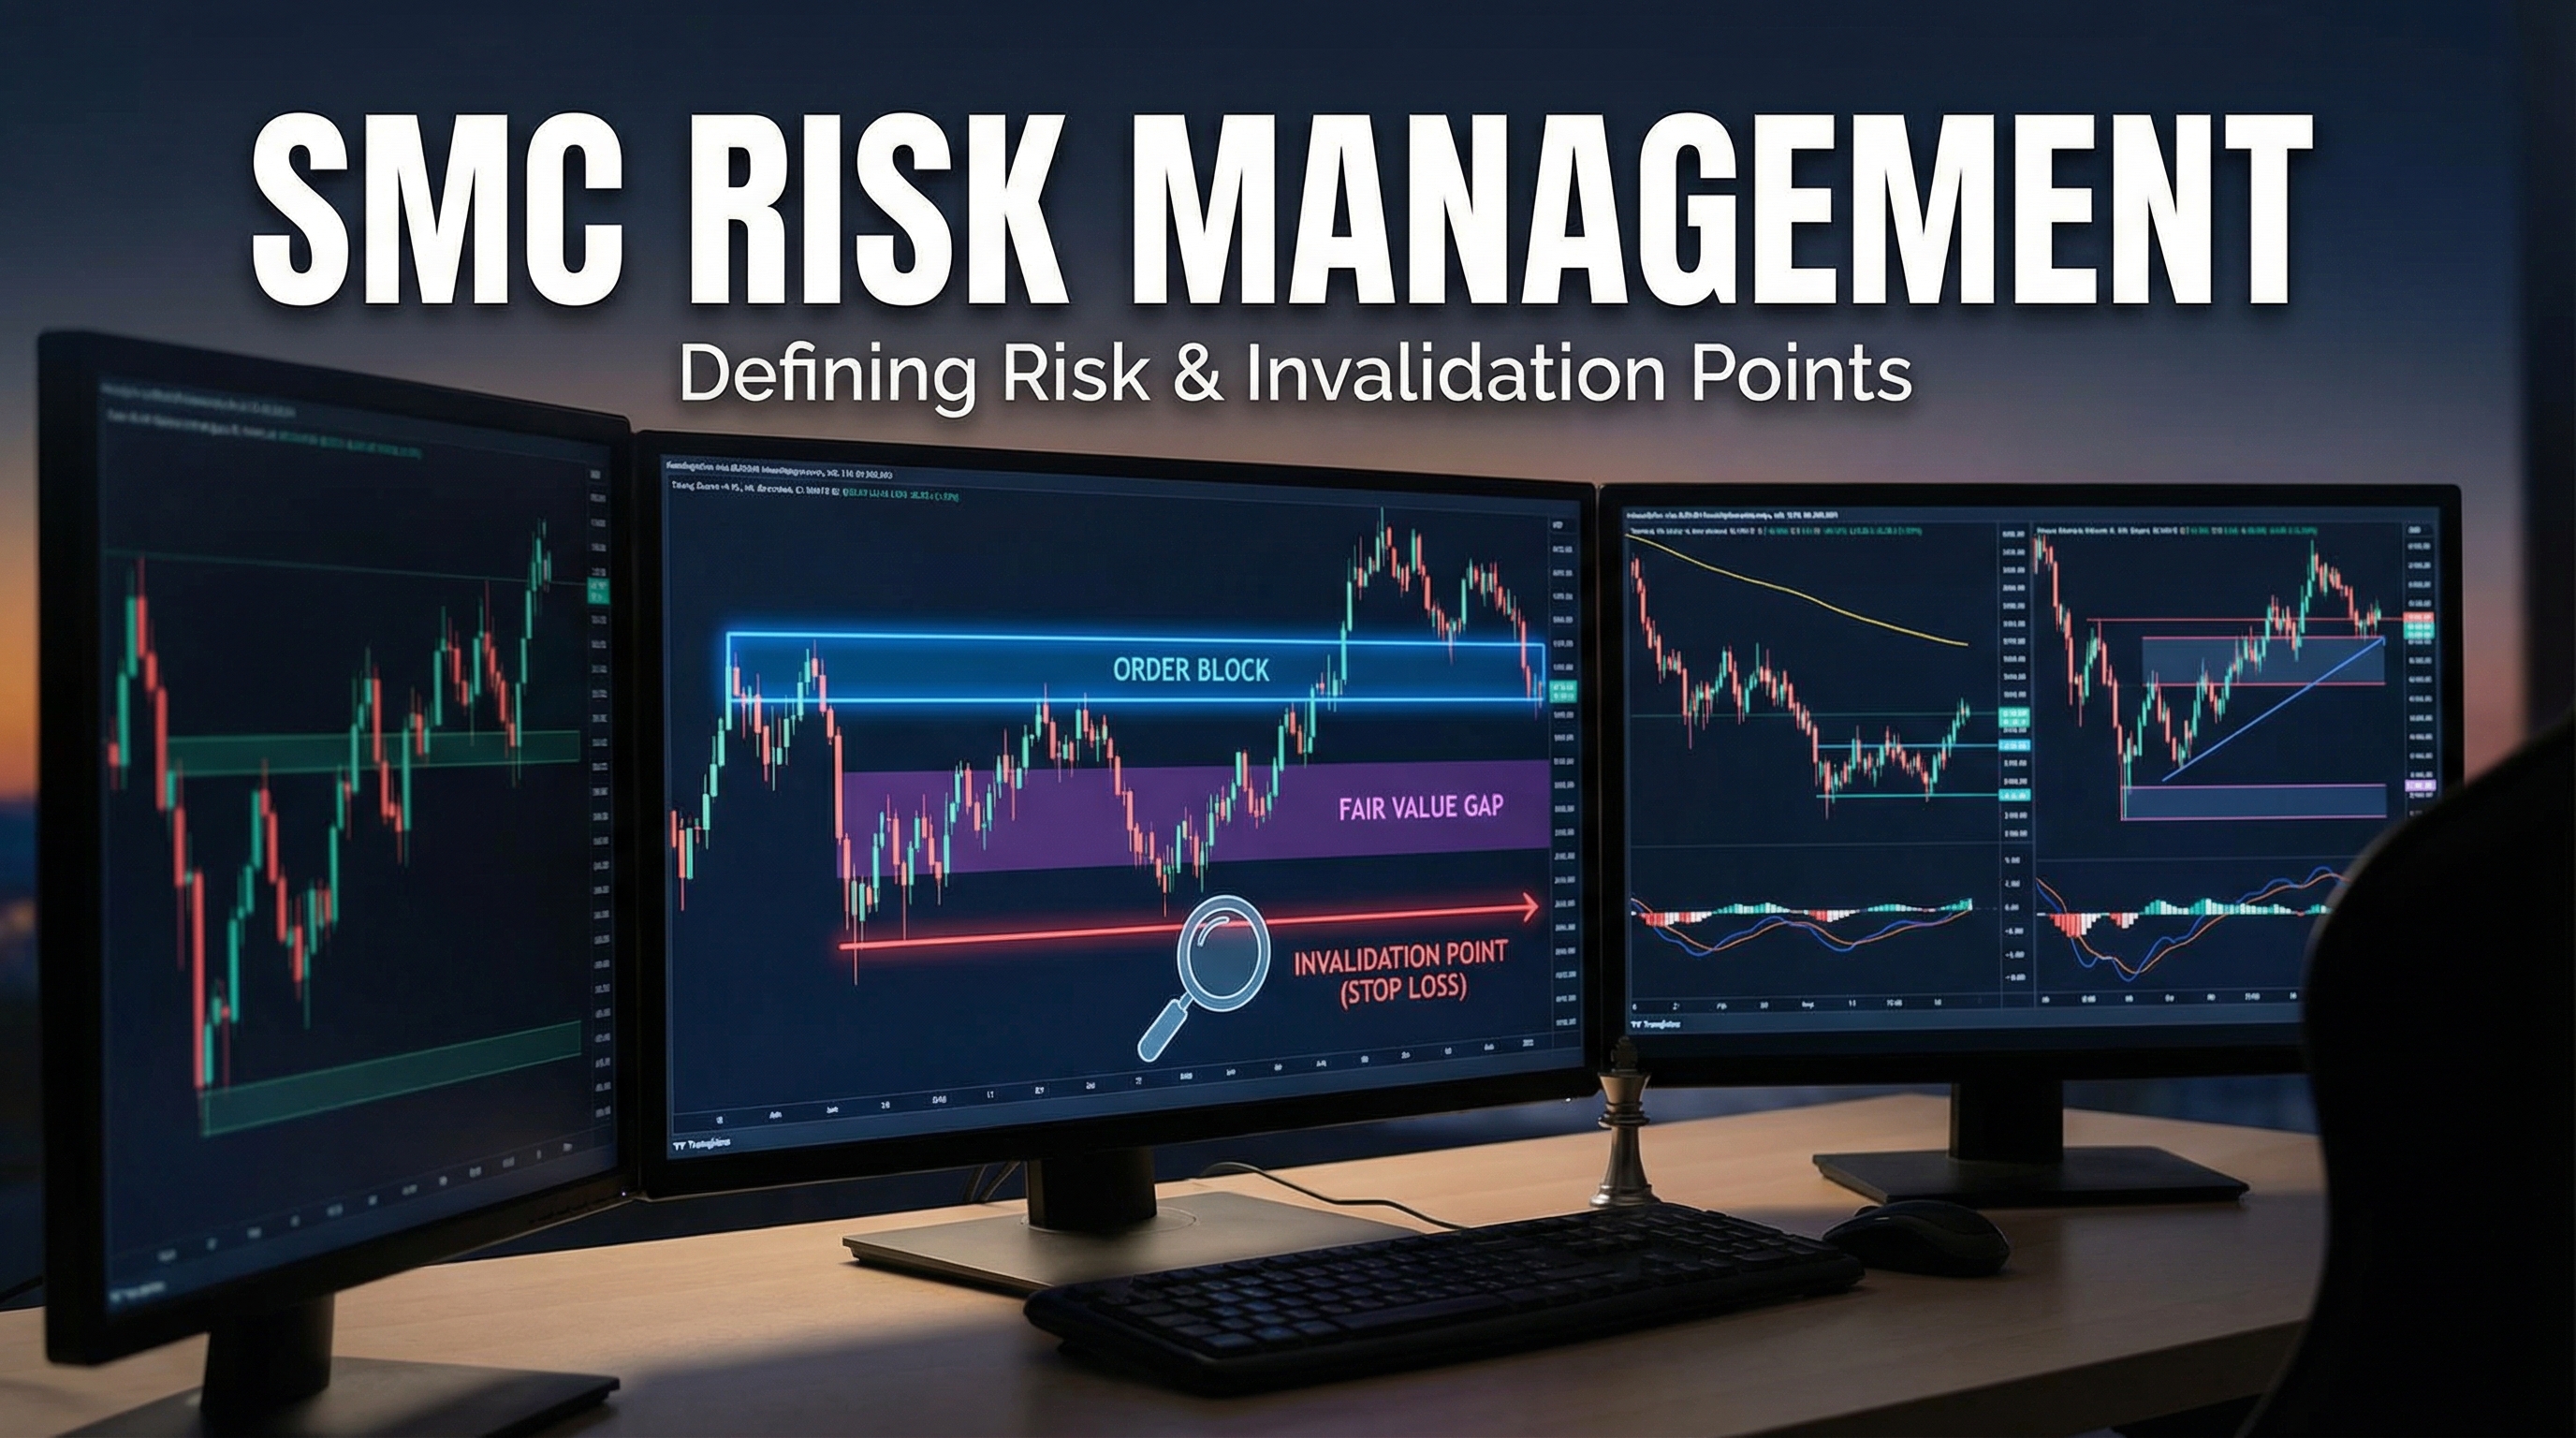
# SMC Risk Management: Using Smart Money Concepts to Define Risk and Invalidation Points
Smart Money Concepts (SMC) have revolutionized how modern traders approach the markets, offering a sophisticated framework for understanding institutional trading behavior. While many traders focus on SMC for entry signals, the methodology's true power lies in its ability to precisely define risk parameters and invalidation points. Effective SMC risk management transforms trading from guesswork into a systematic approach with clearly defined boundaries.
Unlike traditional technical analysis that relies on arbitrary support and resistance levels, SMC provides concrete reference points based on institutional order flow. This approach allows traders to set stop losses and define trade invalidation with surgical precision, significantly improving risk-reward ratios and overall trading performance.
:::key-concept SMC risk management focuses on institutional decision points rather than retail trader emotions, providing more reliable reference points for managing trades. :::
Table of Contents
- [Understanding SMC Risk Framework](#understanding-smc-risk-framework)
- [Order Blocks as Risk Reference Points](#order-blocks-as-risk-reference-points)
- [Fair Value Gaps and Invalidation Levels](#fair-value-gaps-and-invalidation-levels)
- [Market Structure Breaks and Risk Management](#market-structure-breaks-and-risk-management)
- [Implementing SMC Risk Management in Practice](#implementing-smc-risk-management-in-practice)
Understanding SMC Risk Framework
The foundation of SMC risk management rests on understanding how smart money operates in the markets. Institutional traders leave specific footprints that create predictable patterns, and these patterns serve as excellent risk reference points for retail traders.
Smart money moves markets through large orders that must be executed strategically to avoid slippage. This creates distinct price action signatures that SMC traders learn to identify and use for risk management purposes.
Key SMC Risk Elements
Order Blocks represent areas where institutions placed significant orders, creating imbalances that often lead to future reactions. These zones provide natural stop loss placement areas.
Fair Value Gaps (FVG) indicate inefficient price delivery where institutions will likely return to fill imbalances. Unfilled gaps serve as magnetic price targets and invalidation levels.
Market Structure shifts signal changes in institutional sentiment, providing clear invalidation points for directional bias.
Liquidity Zones mark areas where stop losses cluster, indicating where smart money will likely hunt before continuing their intended direction.
:::tip Always align your risk management with the current market structure. A bullish bias requires different risk parameters than a bearish one. :::
Traditional vs SMC Risk Management
Traditional risk management often relies on percentage-based stops or arbitrary technical levels. SMC risk management, however, uses institutionally relevant price levels that represent actual decision points for large market participants.
This approach typically results in tighter stops placed at more logical levels, improving risk-reward ratios while maintaining similar success rates. The key difference lies in understanding why a level should hold rather than simply placing stops based on distance or percentage.
Order Blocks as Risk Reference Points
Order blocks form when institutional traders execute large orders, creating imbalances that often lead to future price reactions. These zones serve as excellent reference points for SMC risk management because they represent areas where smart money has demonstrated interest.
Identifying Valid Order Blocks
A valid order block consists of three components:
1. The Setup Candle: The candle where institutions placed their orders 2. The Displacement: Rapid price movement away from the order block 3. The Reaction: Price returning to the order block and respecting it
For risk management purposes, focus on order blocks that show clear institutional involvement through significant volume and decisive price action.
:::example Consider a bullish scenario where price rapidly moves up from a specific candle, creating a fair value gap. The high of that candle represents a bullish order block. If taking a long position on the return to this level, your stop loss would go just below the order block's low, as a break would invalidate the institutional interest. :::
Order Block Risk Placement
For Long Positions: Place stops 1-3 pips below the order block's low. This allows for minor wicks while maintaining the structural integrity of the setup.
For Short Positions: Place stops 1-3 pips above the order block's high, following the same principle in reverse.
Buffer Zones: Always include small buffers to account for spread and minor stop hunting, but avoid excessive buffers that compromise risk-reward ratios.
Multiple Order Block Scenarios
When multiple order blocks exist in a range, use the most recent valid block for primary risk management. Older blocks can serve as secondary invalidation levels for partial position management.
:::warning Never ignore order block violations. When price breaks through an order block decisively, it signals that institutional sentiment has shifted, requiring immediate risk reassessment. :::
Fair Value Gaps and Invalidation Levels
Fair Value Gaps represent inefficient price delivery where buying and selling orders didn't overlap, creating obvious imbalances in the market. These gaps serve as powerful SMC risk management tools because they indicate areas where institutions will likely return to establish fair value.
Types of FVG for Risk Management
Bullish FVG: Forms when the high of candle 1 is lower than the low of candle 3, with candle 2 creating the gap. These gaps often act as support on retests.
Bearish FVG: Forms when the low of candle 1 is higher than the high of candle 3. These typically provide resistance on retests.
Rejection FVG: Gaps that immediately get tested and hold, providing strong invalidation levels for opposite-direction trades.
Using FVG for Stop Loss Placement
When trading from fair value gaps, your risk management becomes straightforward:
- Long trades from bullish FVG: Stop loss below the gap's low
- Short trades from bearish FVG: Stop loss above the gap's high
- Gap closure: Complete gap fill often invalidates the setup
:::key-concept Partial gap fills are normal and expected. Focus on complete gap closures as true invalidation signals for SMC risk management purposes. :::
Gap Hierarchy and Risk Priority
Not all gaps carry equal weight for risk management:
1. Daily gaps carry more significance than intraday gaps 2. Gaps with volume confirmation provide stronger invalidation levels 3. Gaps aligned with market structure offer more reliable risk reference points 4. Multiple timeframe gap confluence creates high-probability invalidation zones
Managing Multiple Gaps
When multiple FVGs exist, create a hierarchy:
- Use the nearest gap for immediate stop loss placement
- Employ distant gaps for partial profit taking or position scaling
- Monitor gap interactions for shifting market dynamics
Market Structure Breaks and Risk Management
Market structure in SMC refers to the sequence of higher highs/higher lows (uptrend) or lower highs/lower lows (downtrend). Structure breaks signal potential shifts in institutional sentiment and provide crucial invalidation points for SMC risk management.
Identifying Structure Breaks
A bullish market structure break occurs when price creates a higher high and higher low sequence, breaking above a previous significant high. Conversely, a bearish break happens when price creates lower highs and lower lows, breaking below a significant low.
These breaks don't just signal new trends—they provide exact invalidation levels for existing positions and new trade setups.
Structure-Based Stop Loss Placement
In Uptrends: Place stops below the most recent higher low. A break of this level indicates the bullish structure is compromised.
In Downtrends: Place stops above the most recent lower high, as breaks signal potential trend reversal.
During Consolidation: Use range boundaries as invalidation levels until a clear structure emerges.
:::example If you're long in a bullish market structure and price creates a new higher high followed by a higher low, move your stop to just below this new higher low. This ensures you're protected if the structure breaks while allowing the trend to continue. :::
Multi-Timeframe Structure Analysis
Effective SMC risk management requires analyzing structure across multiple timeframes:
- Higher timeframe: Provides overall directional bias and major invalidation levels
- Entry timeframe: Offers precise entry triggers and immediate risk levels
- Lower timeframe: Shows execution details and micro-structure changes
Align your risk management with the highest timeframe structure while using lower timeframes for precision.
Structure Break Confirmation
Not every break is valid. Look for:
- Volume confirmation on the break
- Follow-through with continued momentum
- Retest behavior of broken levels
- Time element - breaks should happen with conviction, not slowly
:::warning False breaks are common in SMC trading. Always wait for confirmation before adjusting risk parameters based on structure breaks. :::
Implementing SMC Risk Management in Practice
Successful implementation of SMC risk management requires systematic application of these concepts in real trading scenarios. This section provides practical frameworks for applying SMC principles to actual trades.
Pre-Trade Risk Assessment
Before entering any SMC-based trade, complete this risk assessment:
1. Identify current market structure on multiple timeframes 2. Locate relevant order blocks and fair value gaps that align with your bias 3. Determine primary invalidation levels based on structure and key zones 4. Calculate position size based on distance to invalidation point 5. Plan partial exit points using intermediate SMC levels
Position Sizing with SMC Levels
SMC risk management often results in tighter stops, allowing for larger position sizes while maintaining the same dollar risk. However, avoid the temptation to over-leverage just because stops are closer.
Use this formula:
- Risk per trade = Account balance × risk percentage
- Distance to stop = Entry price to invalidation level
- Position size = Risk per trade ÷ distance to stop
:::tip SMC typically provides better risk-reward ratios, but maintain consistent risk per trade regardless of stop distance. :::
Dynamic Risk Management
SMC risk management isn't static. Adjust your risk parameters as market conditions evolve:
Trail stops using new order blocks or structure levels as they form
Scale out positions at key SMC levels like fair value gap fills or structure targets
Adjust invalidation points when new higher-timeframe structure emerges
Monitor correlation between related markets for additional confirmation
Common SMC Risk Management Mistakes
Ignoring Higher Timeframe Structure: Always respect major timeframe bias in your risk decisions.
Over-Optimizing Stop Placement: While SMC provides precise levels, don't place stops so tight that normal market noise stops you out.
Neglecting Volume Confirmation: SMC levels work best when supported by volume analysis.
Static Risk Management: Markets evolve, and your risk management should adapt accordingly.
Building Your SMC Risk System
Develop a systematic approach:
1. Define your universe: Which markets and timeframes will you trade? 2. Create checklists: Standardize your SMC analysis process 3. Backtest your approach: Verify that your risk management improves outcomes 4. Document everything: Track which SMC levels work best for your style 5. Regular review: Continuously refine your approach based on results
:::example A complete SMC risk management checklist might include: Market structure confirmed on daily/4H/1H, valid order block identified, FVG alignment checked, invalidation level set, position sized appropriately, partial exit plan established. :::
Conclusion
Mastering SMC risk management transforms trading from emotional decision-making to systematic risk control. By using order blocks, fair value gaps, and market structure breaks as reference points, traders can set precise invalidation levels that align with institutional behavior rather than arbitrary technical levels.
The key to successful SMC risk management lies in understanding that these levels represent real institutional decision points, not just lines on a chart. When institutions change their mind about market direction, these levels will be violated, providing clear signals to exit positions and reassess market bias.
Remember that SMC risk management requires patience and discipline. Not every setup will provide textbook levels, and market conditions constantly evolve. Focus on high-probability scenarios where multiple SMC elements align, and always respect the invalidation levels your analysis identifies.
Effective SMC risk management improves trading performance not by increasing win rates, but by optimizing risk-reward ratios and providing systematic frameworks for decision-making. This approach reduces emotional trading while increasing confidence in your risk management decisions.
Ready to implement SMC risk management in your trading? Start by analyzing your recent trades through an SMC lens, identifying where traditional stops failed but SMC levels would have provided better risk management. Practice identifying order blocks, fair value gaps, and structure breaks on historical charts before applying these concepts to live trading.
Advanced SMC Risk Techniques
Multi-Timeframe Risk Alignment
Sophisticated SMC traders use multiple timeframes to create layered risk management strategies. This approach provides both macro and micro invalidation levels:
Higher Timeframe Context: Use daily or weekly SMC levels for ultimate invalidation points. These represent major institutional bias changes.
Lower Timeframe Precision: Use 1H or 15-minute SMC levels for tighter risk management and earlier warning signals.
:::example A daily order block provides the ultimate stop level at 1.2050, while a 1H fair value gap offers an earlier warning at 1.2080. This creates a two-tier risk system: partial exit at 1.2080, full exit at 1.2050. :::
Dynamic Risk Adjustment
SMC levels aren't static—they evolve as new institutional activity emerges:
Level Updates: When new order blocks form closer to price, consider tightening stops to these fresh levels.
Structure Evolution: If market structure breaks on lower timeframes but holds on higher ones, adjust position size rather than exit entirely.
Volume Validation: Increase position size when SMC levels align with high-volume nodes, as these represent stronger institutional interest.
Advanced Order Block Analysis
Not all order blocks provide equal risk management value:
Fresh vs. Tested Blocks: Untested order blocks typically provide stronger support/resistance than previously touched levels.
Block Thickness: Wider order blocks (spanning more price) often provide more reliable risk levels than thin, single-candle blocks.
Institutional Signatures: Order blocks formed during low-liquidity periods (Asian session) may be less reliable than those created during high-volume sessions.
:::tip Use order block "strength scoring" based on timeframe, volume, freshness, and thickness to prioritize which levels deserve tighter risk management. :::
Common SMC Risk Pitfalls
Over-Optimization Trap
Many traders become obsessed with finding perfect SMC levels, leading to analysis paralysis:
Solution: Develop minimum criteria for trade entry rather than seeking perfect setups. Good enough is often good enough.
Ignoring Market Regime Changes
SMC levels work differently in trending vs. ranging markets:
Trending Markets: Order blocks often provide brief pauses before trend continuation Ranging Markets: SMC levels may act as stronger turning points
Adjust your risk management expectations based on current market regime.
Time-Based Invalidation
SMC levels can lose relevance over time, even without price violation:
Fresh Levels: Most effective within 24-48 hours of formation Aging Levels: Consider reducing position size as SMC levels age without interaction
:::warning Don't hold losing positions simply because SMC levels haven't been violated. Time decay reduces the relevance of these institutional reference points. :::
Building Your Personal SMC Framework
Risk Assessment Matrix
Create a systematic approach to evaluating SMC setups:
Level Confluence: How many SMC elements align at your risk level? Market Context: Does current structure support your directional bias? Time Sensitivity: How fresh are your key SMC levels? Volume Profile: Do volume characteristics support your SMC analysis?
Position Sizing Integration
Incorporate SMC analysis into position sizing decisions:
High Confluence: Larger position sizes when multiple SMC elements align Single Level: Smaller positions when relying on individual order blocks or FVGs Aging Setups: Reduced size for older SMC levels
Performance Tracking
Monitor which SMC approaches work best for your trading:
Level Type Analysis: Track success rates for order blocks vs. FVGs vs. structure breaks Timeframe Effectiveness: Identify which timeframe combinations optimize your results Market Condition Performance: Understand how your SMC approach performs in different market environments
:::key-concept Your SMC risk management system should be a living framework that evolves based on performance data and changing market conditions, not a rigid set of rules. :::
Integration with Traditional Risk Management
Combining SMC with R-Multiple Systems
SMC levels provide precise invalidation points, but traditional risk management rules still apply:
Maximum Risk per Trade: Never risk more than your predetermined percentage per trade Portfolio Heat: Consider total exposure across all positions using SMC levels Correlation Awareness: SMC levels in correlated markets may fail simultaneously
Money Management Excellence
Use SMC precision to optimize traditional money management:
Tighter Stops: More precise invalidation levels allow for larger position sizes with same dollar risk Better R:R Ratios: SMC targets combined with precise stops improve risk-reward calculations Reduced Slippage: Institutional levels often provide better fill prices than arbitrary technical levels
Final Implementation Strategy
Start implementing SMC risk management gradually:
1. Paper Trade First: Practice identifying SMC levels without real money at risk 2. Single Market Focus: Master SMC concepts in one market before expanding 3. Small Position Sizes: Use reduced size while developing confidence in SMC levels 4. Detailed Journaling: Document what works and what doesn't in your specific trading context 5. Gradual Scaling: Increase position sizes only after consistent SMC success
:::tip The most successful SMC traders combine institutional-level analysis with disciplined personal risk management. Master both aspects for optimal results. :::
Conclusion
Smart Money Concepts provide a sophisticated framework for risk management that aligns trader decisions with institutional behavior. By using order blocks, fair value gaps, and market structure breaks as invalidation points, traders can move beyond arbitrary stop placement to systematic, logic-based risk control.
The power of SMC risk management lies not in its complexity, but in its foundation: understanding where and why institutional money changes direction. These levels represent real decision points by the largest market participants, making them more reliable than traditional technical indicators.
Success with SMC risk management requires consistent application, continuous learning, and honest performance evaluation. Start with the basic concepts, develop your analytical skills through chart study, and gradually incorporate more sophisticated techniques as your understanding deepens.
Remember that even the best SMC analysis cannot eliminate trading losses—it can only optimize how you manage them. Focus on improving your risk-reward ratios and decision-making consistency rather than seeking perfect trade entries.
Ready to elevate your risk management with SMC? Begin by analyzing 20 historical charts in your preferred market, identifying key SMC levels and noting where traditional stops would have failed but SMC invalidation points would have provided better risk management. This practice will build the pattern recognition skills essential for live trading success.
Advanced SMC Risk Management Techniques
Once you've mastered the fundamentals, these advanced techniques can further refine your risk management approach:
Multi-Timeframe Risk Alignment
Coordinate your risk levels across different timeframes for maximum effectiveness:
Higher Timeframe Structure: Use weekly/daily invalidation points for overall trade direction Lower Timeframe Precision: Use 1H/4H levels for exact entry and stop placement Confluence Zones: Look for areas where multiple timeframe SMC levels converge
:::example On EURUSD, the daily chart shows a bearish order block at 1.0850. The 4-hour chart reveals a fair value gap at 1.0825. Place your stop above the daily level (1.0855) but use the 4H FVG for entry timing. This provides both precision and structural validity. :::
Dynamic Risk Adjustment
SMC levels aren't static—adjust your risk management as market structure evolves:
Structure Updates: Move stops to breakeven when price creates new favorable structure Partial Profit Taking: Scale out at intermediate SMC levels while holding core position Trail with Structure: Use subsequent order blocks or swing points to trail stops
Volume-Weighted SMC Analysis
Incorporate volume analysis to validate SMC levels:
High Volume Rejection: SMC levels with strong volume reactions are more reliable for stops Low Volume Breaks: Be cautious of structure breaks on thin volume—may be false signals Institution Footprints: Look for large block trades near key SMC levels
:::warning Volume data quality varies significantly between brokers and instruments. Ensure your data source provides reliable volume information before incorporating it into your SMC analysis. :::
Common SMC Risk Management Mistakes
Avoid these pitfalls that trap many SMC practitioners:
Over-Optimization
Problem: Constantly adjusting stops based on minor SMC level variations Solution: Stick to your original SMC analysis unless major structure changes occur
Timeframe Confusion
Problem: Mixing invalidation levels from incompatible timeframes Solution: Maintain clear timeframe hierarchy and stick to your trading plan timeframe
Ignoring Market Context
Problem: Applying SMC stops during major news events or illiquid sessions Solution: Adjust position sizes or avoid trading during high-impact news releases
:::key-concept SMC risk management works best in normal market conditions. During extreme volatility or major news events, institutional behavior can temporarily override technical structure. :::
Building Your SMC Risk Management System
Create a systematic approach that you can replicate across all trades:
Pre-Trade Checklist
- [ ] Identify relevant order blocks on multiple timeframes
- [ ] Mark all fair value gaps in the direction of your trade
- [ ] Determine market structure break levels
- [ ] Calculate position size based on SMC invalidation point
- [ ] Verify risk-reward ratio meets your minimum requirements
Trade Management Rules
1. Entry: Only enter at favorable SMC levels (order blocks, FVGs, or structure retests) 2. Stop Placement: Use SMC invalidation points, not arbitrary percentages 3. Profit Targets: Target opposing SMC levels or structure extremes 4. Trade Updates: Review SMC structure after every major session close
Performance Tracking
Monitor these SMC-specific metrics:
SMC Stop Accuracy: Percentage of trades where SMC stops weren't triggered inappropriately Structure Alignment: How often your trades aligned with the overall market structure Level Precision: Distance between your SMC levels and actual reversal points
Technology and Tools for SMC Risk Management
Leverage technology to improve your SMC analysis:
Custom Indicators: Develop or find indicators that automatically mark order blocks and FVGs Alert Systems: Set alerts when price approaches key SMC invalidation levels Backtesting Software: Test SMC strategies across historical data for validation Trade Management Apps: Use mobile apps to adjust SMC-based stops while away from charts
:::tip Many professional SMC traders use TradingView's Pine Script to create custom indicators that automatically identify order blocks and fair value gaps. This removes emotion and ensures consistency in level identification. :::
Integration with Other Risk Management Approaches
SMC doesn't exist in isolation—integrate it with other risk management methods:
Position Sizing Models: Use Kelly Criterion or fixed-fractional models with SMC invalidation levels Portfolio Risk: Consider SMC correlation across multiple positions Fundamental Analysis: Adjust SMC stop distances before major economic releases Sentiment Analysis: Use market sentiment to validate SMC level strength
The Psychology of SMC Risk Management
Managing risk with SMC requires specific psychological preparation:
Patience for Proper Levels: Don't force trades when clear SMC levels aren't present Confidence in Analysis: Trust your SMC levels even when they seem "too far" from entry Emotional Discipline: Accept that SMC stops may seem unconventional to traditional traders
:::warning New SMC traders often struggle with stop distances that feel "too wide" compared to traditional technical analysis. Remember that institutional levels often require more room than retail-focused indicators suggest. :::
Conclusion and Next Steps
Smart Money Concepts revolutionizes risk management by aligning your stops with institutional decision-making levels. This approach moves beyond arbitrary technical levels to focus on where the largest market participants actually change their market stance.
The key advantages of SMC risk management include:
- Logical Stop Placement: Based on institutional behavior rather than random percentages
- Improved Risk-Reward: More precise entry and exit levels lead to better trade mathematics
- Reduced False Signals: Institutional levels are less prone to random market noise
- Scalable Framework: Works across all markets and timeframes
Success with SMC risk management demands patience, practice, and disciplined execution. Start with basic order block and fair value gap identification, then gradually incorporate more sophisticated multi-timeframe analysis and dynamic risk adjustment techniques.
Your SMC Journey Starts Now: Begin by analyzing 50 completed trades in your preferred market using SMC principles. Identify where traditional stops would have failed, but SMC invalidation points would have provided superior risk management. Document patterns you discover—this hands-on practice will accelerate your transition to institutional-level thinking and dramatically improve your risk management effectiveness.
Master SMC risk management, and you'll trade with the confidence that comes from understanding how smart money really moves markets.