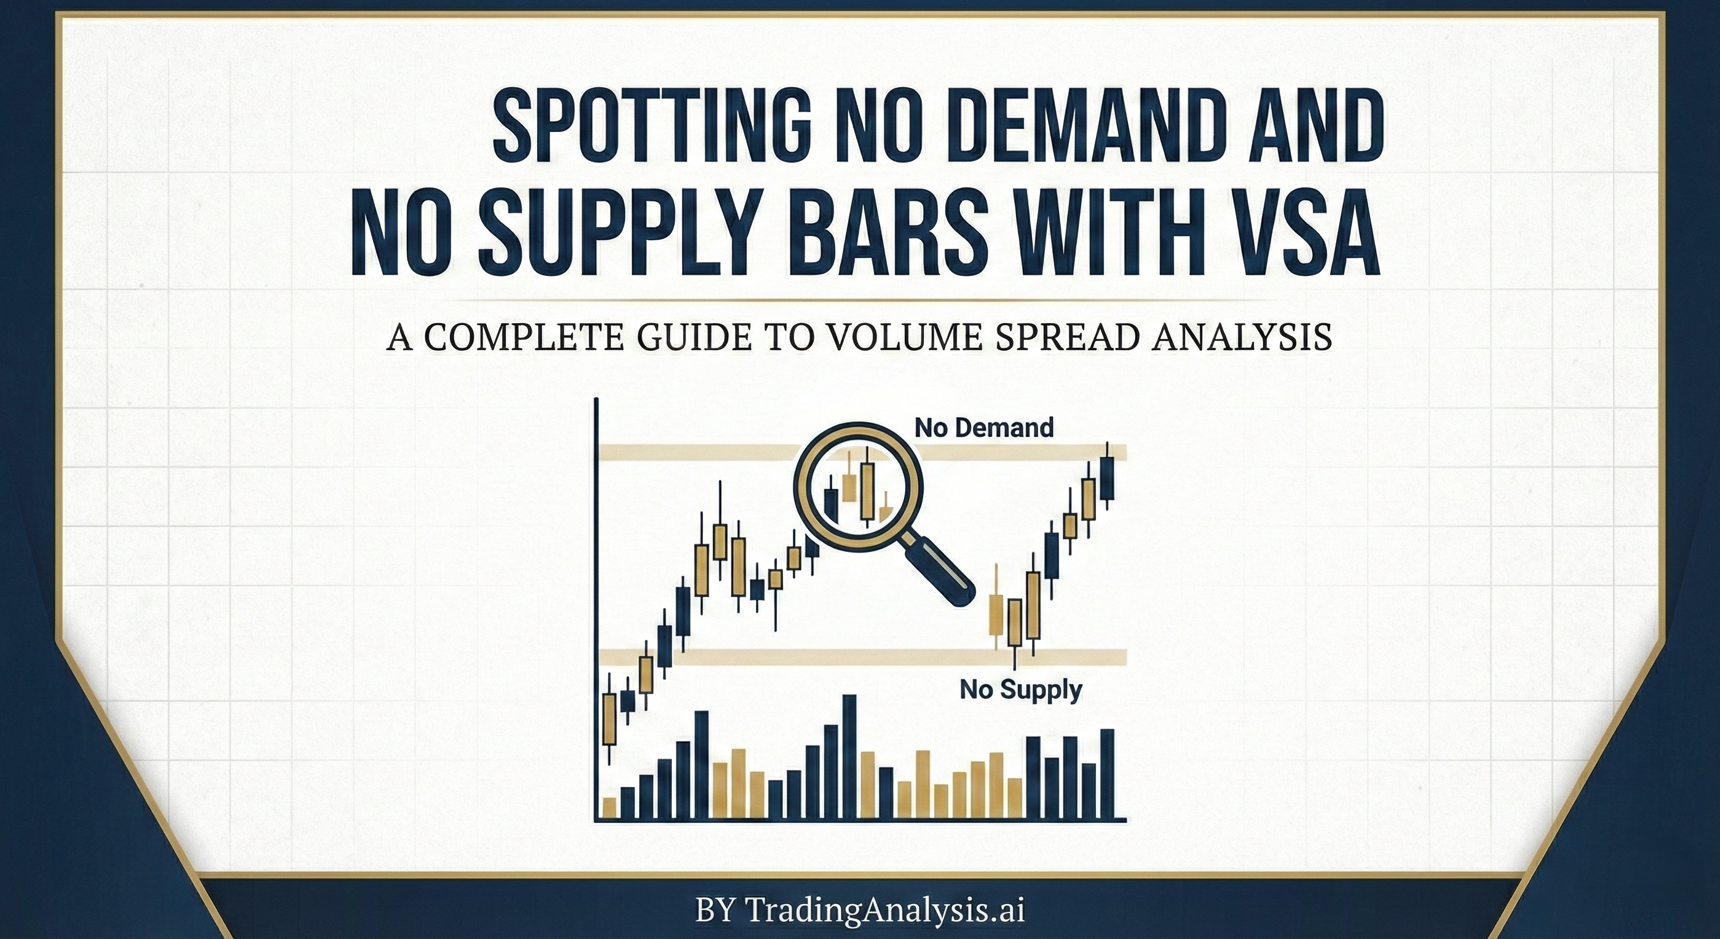
# Spotting No Demand and No Supply Bars with VSA: A Complete Guide to Volume Spread Analysis
Volume Spread Analysis (VSA) provides traders with powerful insights into market behavior by examining the relationship between price, volume, and spread. Among the most important concepts in VSA are no demand no supply bars, which reveal critical information about market strength and weakness. Understanding these bars can significantly improve your ability to identify optimal entry and exit points in any market.
Table of Contents
- [What Are No Demand and No Supply Bars?](#what-are-no-demand-and-no-supply-bars)
- [Identifying No Demand Bars](#identifying-no-demand-bars)
- [Recognizing No Supply Bars](#recognizing-no-supply-bars)
- [Trading Strategies with No Demand No Supply VSA](#trading-strategies-with-no-demand-no-supply-vsa)
- [Common Mistakes and How to Avoid Them](#common-mistakes-and-how-to-avoid-them)
- [Conclusion](#conclusion)
What Are No Demand and No Supply Bars?
:::key-concept No demand and no supply bars are specific candlestick formations in VSA that indicate the absence of professional money interest at particular price levels. These bars help identify potential reversal points and continuation patterns. :::
In Volume Spread Analysis, every bar tells a story about the battle between supply and demand. No demand no supply VSA concepts focus on identifying moments when professional traders are either absent or showing limited interest in the market. This absence of professional activity often precedes significant market moves.
No Demand Bars appear during uptrends when buying pressure diminishes, while No Supply Bars occur during downtrends when selling pressure weakens. Both scenarios suggest potential changes in market direction or momentum.
The key to successful VSA trading lies in understanding that markets move based on the actions of professional traders - those with enough capital to influence price movements. When these professionals step aside, retail traders are left to drive the market, often creating unsustainable price movements that eventually reverse.
The VSA Foundation
Volume Spread Analysis was developed based on the principle that volume drives price movement. The three essential elements analyzed are:
- Volume: The number of shares or contracts traded
- Spread: The range between high and low prices
- Closing Price: Where the bar closes within its range
By examining these three elements together, traders can determine whether professional money is supporting or opposing the current price movement.
Identifying No Demand Bars
No demand bars typically appear during uptrends and signal potential weakness in buying pressure. These formations suggest that professional buyers are losing interest or beginning to distribute their holdings.
:::example Picture a stock that has been rising steadily. Suddenly, you notice a bar with a narrow spread, low volume, and a close in the lower half of the range. Despite the ongoing uptrend, this bar shows no demand - professional buyers are stepping aside. :::
Characteristics of No Demand Bars
Classic No Demand Bar Features:
- Narrow spread (small range from high to low)
- Low volume relative to recent bars
- Close in the lower portion of the bar's range
- Appears during an uptrend or after a rally
- Often follows high-volume buying or test bars
Volume Analysis for No Demand:
- Volume should be noticeably lower than the previous few bars
- Compare volume to the average of the last 10-20 bars
- Look for volume that's 30-50% below recent averages
Price Action Confirmation:
- The bar should not make new highs with conviction
- Price struggles to move higher despite the uptrend
- May show a small upper shadow or wick
:::warning Not every low-volume bar in an uptrend is a no demand bar. The context of the overall trend, recent professional activity, and subsequent price action must all be considered. :::
Types of No Demand Bars
1. Classic No Demand The most common type appears as a narrow-range bar with low volume closing in the lower half. This suggests professional buyers have finished their accumulation or are beginning to distribute.
2. No Demand at Resistance When price approaches a previous high or resistance level with low volume and narrow spread, it indicates professionals are not supporting the move higher.
3. No Demand After Climax Following a buying climax (high volume, wide spread up-bar), a subsequent low-volume narrow bar often represents no demand as professionals step aside.
Recognizing No Supply Bars
No supply bars appear during downtrends and indicate diminishing selling pressure. These bars suggest that professional sellers have finished their distribution or that smart money is beginning to accumulate.
:::key-concept No supply bars are the opposite of no demand bars. They appear in downtrends when professional selling pressure decreases, often marking potential reversal points or areas of support. :::
Characteristics of No Supply Bars
Essential No Supply Features:
- Narrow spread during a downtrend
- Low volume compared to recent selling
- Close in the upper portion of the bar's range
- Appears after significant selling pressure
- Often occurs near support levels
Volume Considerations:
- Volume significantly lower than recent down bars
- Lack of follow-through selling despite the downtrend
- Professional sellers appear absent
Price Action Signals:
- Price holds above recent lows despite the downtrend
- Bar closes near its high
- May show a small lower shadow
:::example Consider a currency pair in a strong downtrend. After several wide-range, high-volume down bars, you notice a narrow-range bar with low volume that closes near its high. This no supply bar suggests selling pressure is diminishing and smart money may be stepping in to buy. :::
No Supply Bar Variations
1. Standard No Supply A narrow-range, low-volume bar closing high during a downtrend, indicating reduced selling pressure.
2. No Supply at Support Occurs when price tests a support level with low volume and holds above the low, suggesting professional support.
3. No Supply After Selling Climax Follows high-volume selling with a low-volume bar that closes well off its lows, indicating selling exhaustion.
Trading Strategies with No Demand No Supply VSA
Successful implementation of no demand no supply VSA requires combining these signals with other technical analysis tools and proper risk management.
Strategy 1: Trend Reversal Trading
No Demand Reversal Setup: 1. Identify a clear uptrend 2. Wait for a no demand bar to appear 3. Look for confirmation with subsequent weakness 4. Enter short on the break of the no demand bar's low 5. Place stop loss above the recent high 6. Target previous support levels
No Supply Reversal Setup: 1. Identify a clear downtrend 2. Spot a no supply bar formation 3. Wait for confirmation with buying interest 4. Enter long on the break above the no supply bar's high 5. Place stop loss below recent lows 6. Target previous resistance levels
:::tip Always wait for confirmation after identifying no demand or no supply bars. A single bar, regardless of how perfect it looks, should not be the sole basis for a trade. :::
Strategy 2: Continuation Pattern Recognition
Sometimes no demand and no supply bars appear as temporary pauses in strong trends rather than reversal signals.
Trend Continuation Approach:
- Use no demand bars as potential re-entry points in downtrends
- Utilize no supply bars as buying opportunities in uptrends
- Combine with momentum indicators for confirmation
- Look for volume expansion in the direction of the primary trend
Strategy 3: Support and Resistance Trading
At Key Levels:
- No supply bars at support suggest the level will hold
- No demand bars at resistance indicate potential rejection
- Combine with horizontal support/resistance lines
- Use multiple timeframe analysis for confirmation
:::warning Never trade no demand or no supply bars in isolation. Always consider the broader market context, trend direction, and other technical factors before making trading decisions. :::
Risk Management for VSA Trading
Position Sizing:
- Risk no more than 1-2% of your account per trade
- Adjust position size based on stop loss distance
- Consider market volatility when sizing positions
Stop Loss Placement:
- For no demand trades: Place stops above recent highs
- For no supply trades: Place stops below recent lows
- Allow for normal market fluctuations
- Use ATR (Average True Range) for dynamic stop placement
Take Profit Targets:
- Target previous significant support/resistance levels
- Use measured moves based on recent ranges
- Consider taking partial profits at key levels
- Trail stops as the trade moves favorably
Common Mistakes and How to Avoid Them
Even experienced traders can fall into traps when applying VSA principles. Understanding common mistakes helps improve trading performance.
Mistake 1: Ignoring Market Context
The Problem: Trading every no demand or no supply bar without considering the broader market environment.
The Solution:
- Always analyze the overall trend direction
- Consider market phase (accumulation, markup, distribution, markdown)
- Factor in major support and resistance levels
- Use multiple timeframe analysis
Mistake 2: Volume Misinterpretation
The Problem: Misreading volume data or using inappropriate volume comparisons.
The Solution:
- Compare volume to recent averages, not just the previous bar
- Consider the time of day for intraday trading
- Account for holidays and market conditions that affect volume
- Use volume moving averages for better perspective
Mistake 3: Lack of Confirmation
The Problem: Entering trades immediately after identifying no demand or no supply bars.
The Solution:
- Wait for price confirmation in the expected direction
- Look for follow-through in subsequent bars
- Combine with other technical indicators
- Consider fundamental factors that might override technical signals
:::tip Develop a systematic approach to VSA analysis. Create a checklist that includes trend direction, volume analysis, price action confirmation, and risk management parameters before executing any trade. :::
Mistake 4: Overtrading VSA Signals
The Problem: Trying to trade every potential no demand or no supply formation.
The Solution:
- Focus on high-probability setups only
- Wait for signals that align with the broader trend
- Avoid trading in choppy, sideways markets
- Be patient and selective with trade entries
Mistake 5: Poor Risk Management
The Problem: Risking too much capital or placing stops inappropriately.
The Solution:
- Never risk more than you can afford to lose
- Use proper position sizing based on account size
- Place stops at logical technical levels
- Have a clear exit strategy before entering the trade
Conclusion
Mastering no demand no supply VSA concepts provides traders with a powerful edge in understanding market dynamics. These formations reveal moments when professional traders step aside, often preceding significant price movements. By learning to identify these bars accurately and combining them with proper risk management, traders can improve their market timing and overall trading performance.
The key to successful VSA implementation lies in understanding that no single bar tells the complete story. Context is everything - consider the overall trend, recent professional activity, volume patterns, and key support/resistance levels when analyzing potential trading opportunities.
Remember that no demand and no supply bars are just one piece of the trading puzzle. Combine these insights with other technical analysis tools, maintain strict risk management protocols, and always wait for confirmation before executing trades.
:::tip Start practicing VSA analysis on historical charts before risking real money. Spend time studying how no demand and no supply bars behaved in different market conditions to build your pattern recognition skills. :::
As you develop your VSA skills, focus on quality over quantity. It's better to identify a few high-probability setups per week than to overtrade marginal signals. With patience, practice, and proper application of these concepts, you'll develop the ability to read market sentiment more accurately and make better-informed trading decisions.
Take the next step in your trading education by analyzing charts from your preferred markets. Look for examples of no demand and no supply bars, study the context in which they appeared, and observe how price reacted in the following sessions. This hands-on practice will accelerate your understanding and help you become a more confident VSA trader.