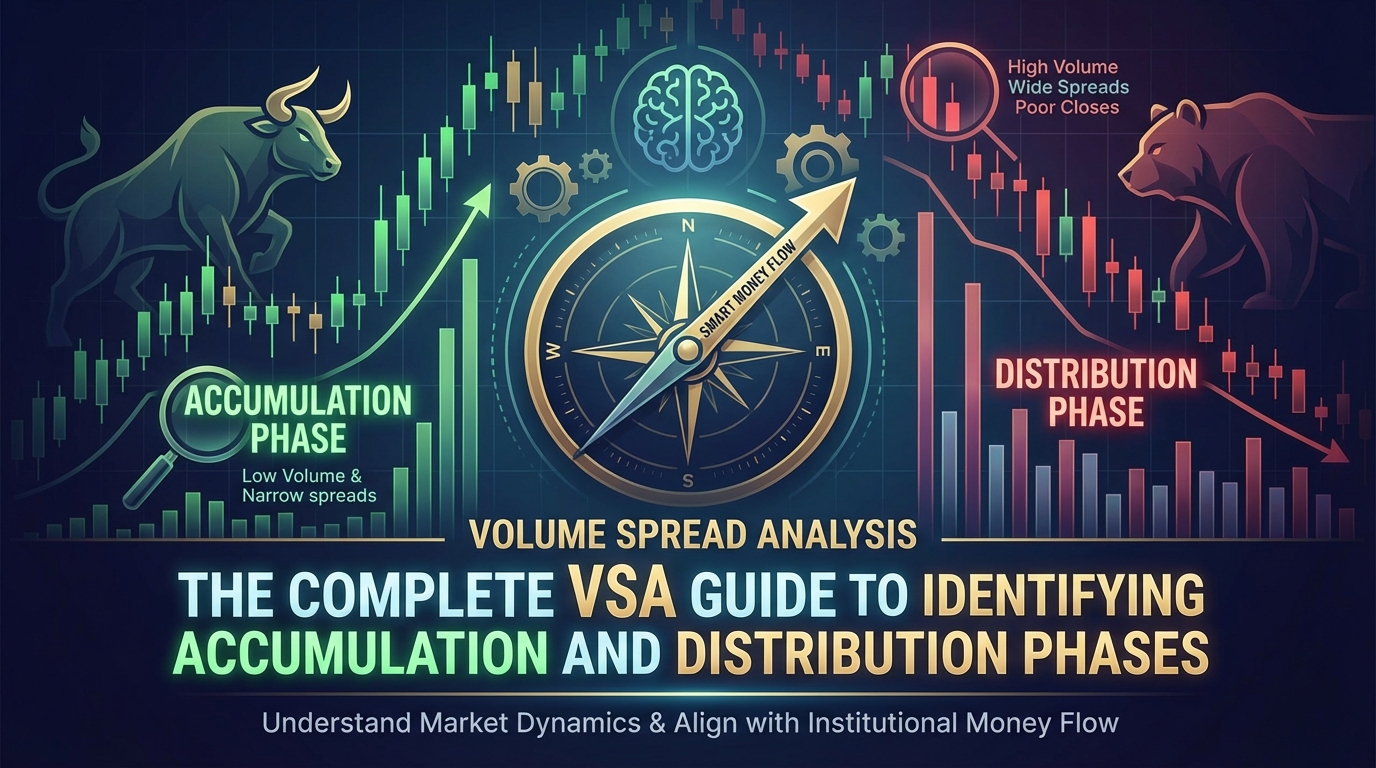
# The Complete VSA Guide to Identifying Accumulation and Distribution Phases
Volume Spread Analysis (VSA) is one of the most powerful methodologies for understanding market dynamics and identifying when smart money is either accumulating positions (buying) or distributing them (selling). Understanding vsa accumulation distribution patterns is crucial for traders who want to align themselves with institutional money flow rather than fight against it.
This comprehensive guide will teach you how to recognize these critical phases using VSA principles, enabling you to make more informed trading decisions and improve your market timing.
Table of Contents
- [Understanding VSA Fundamentals](#understanding-vsa-fundamentals)
- [Identifying Accumulation Phases](#identifying-accumulation-phases)
- [Recognizing Distribution Phases](#recognizing-distribution-phases)
- [Advanced VSA Accumulation Distribution Patterns](#advanced-vsa-accumulation-distribution-patterns)
- [Practical Application and Trading Strategies](#practical-application-and-trading-strategies)
- [Common Mistakes and How to Avoid Them](#common-mistakes-and-how-to-avoid-them)
- [Conclusion](#conclusion)
Understanding VSA Fundamentals
:::key-concept VSA is based on the principle that smart money (institutions, market makers) leaves footprints in the market through volume and price spread relationships. By analyzing these relationships, we can determine whether professionals are accumulating or distributing positions. :::
Volume Spread Analysis examines three critical elements:
- Volume: The number of shares or contracts traded
- Price Spread: The difference between high and low prices in a given period
- Closing Price: Where the price closes within the spread
These elements work together to reveal the underlying supply and demand dynamics. When smart money operates, they cannot hide their activities completely - large volume transactions will always leave traces that VSA helps us identify.
The Theory Behind VSA Accumulation Distribution
Smart money operates differently from retail traders. Institutions must carefully manage their large positions to avoid moving the market against themselves. This creates distinct patterns:
During Accumulation:
- Professionals quietly buy without pushing prices higher
- Volume increases while price ranges remain relatively narrow
- Any selling pressure is absorbed by institutional buying
During Distribution:
- Professionals sell into strength while maintaining price levels
- High volume occurs as institutions offload positions to eager retail buyers
- Price support eventually fails as supply overwhelms demand
Identifying Accumulation Phases
Accumulation occurs when smart money is building positions at favorable prices. Recognizing these phases early allows traders to position themselves alongside institutional money before significant price moves occur.
Key Characteristics of Accumulation
Volume and Price Relationship:
- High volume with narrow price spreads
- Price closes in the middle to upper portion of the spread
- Multiple bars showing absorption of selling pressure
Market Behavior Patterns:
- Prices hold above key support levels despite selling attempts
- Downward price movements are met with increased buying volume
- Overall sideways price action with increasing volume
:::example Imagine a stock trading between $48-$52 for several weeks. You notice:
- Volume spikes whenever price approaches $48 support
- These high-volume bars show narrow spreads and close near their highs
- Each test of $48 support shows less selling pressure
This suggests smart money is accumulating shares at these lower levels, absorbing all available supply. :::
Specific VSA Accumulation Signals
1. No Demand Bars Low volume with narrow spreads and down closes, indicating lack of selling pressure:
- Occurs after period of decline
- Shows sellers are exhausted
- Often precedes accumulation phase
2. Stopping Volume High volume with narrow spreads after decline:
- Large volume arrests the downward movement
- Spread remains narrow despite high activity
- Indicates professional buying absorbing supply
3. Inverse Relationship Volume increases while volatility decreases:
- Higher volume with tighter price ranges
- Shows controlled buying by professionals
- Accumulation occurring without pushing prices higher
Recognizing Distribution Phases
Distribution phases occur when smart money begins selling their accumulated positions. Identifying vsa accumulation distribution transitions is crucial for avoiding major declines and protecting profits.
Key Characteristics of Distribution
Volume and Price Dynamics:
- High volume with wide spreads but poor closes
- Prices struggle to make new highs despite increased activity
- Volume spikes on up moves but price gains are limited
Market Structure Changes:
- Support levels begin failing
- Bounces become weaker and shorter-lived
- Overall price action becomes more volatile
:::warning Distribution can be subtle initially. Smart money doesn't dump positions all at once - they carefully distribute over time to maintain favorable prices for their selling. :::
Specific VSA Distribution Signals
1. No Supply Bars Low volume with narrow up spreads:
- Indicates lack of buying interest
- Occurs during potential topping process
- Shows professionals not supporting the market
2. Distribution Bars High volume with wide spreads but closes in lower half:
- Large volume fails to produce proportional price gains
- Indicates selling pressure from professionals
- Often occurs at or near price highs
3. Selling Climax Very high volume with wide down spreads:
- Panic selling by retail traders
- Often marks end of distribution phase
- May indicate selling exhaustion and potential reversal
Advanced VSA Accumulation Distribution Patterns
Understanding complex vsa accumulation distribution patterns requires recognizing how these phases evolve and transition into each other.
The Complete Cycle
Phase 1: Accumulation
- Smart money builds positions quietly
- Volume increases, spreads narrow
- Price consolidates in range
Phase 2: Markup
- Institutional buying becomes more aggressive
- Price breaks out of accumulation range
- Volume confirms the move
Phase 3: Distribution
- Professionals begin selling to retail buyers
- High volume with poor price progress
- Market shows signs of weakness
Phase 4: Markdown
- Selling pressure overwhelms buying
- Price declines accelerate
- Volume patterns confirm weakness
Composite Man Concept
VSA uses the "Composite Man" concept - imagining all professional activity as one entity:
:::tip Think of the Composite Man as a large operator who must: 1. Accumulate shares without pushing price up 2. Create demand to sell into (distribution) 3. Manage positions to maximize profits 4. Cover short positions during weakness :::
Identifying Transitions
The most profitable opportunities occur during phase transitions:
Accumulation to Markup:
- Breakout from trading range on increased volume
- VSA confirms institutional support
- Entry opportunity for long positions
Distribution to Markdown:
- Break of key support levels
- Volume patterns confirm selling pressure
- Exit opportunity for long positions
Practical Application and Trading Strategies
Applying VSA accumulation distribution analysis requires systematic approach and proper risk management.
Step-by-Step Analysis Process
1. Identify the Current Phase
- Analyze recent volume and price patterns
- Determine if market is accumulating, distributing, or trending
- Look for confirmation across multiple timeframes
2. Confirm with Multiple Signals
- Never rely on single VSA signal
- Look for confluence of multiple indicators
- Check background conditions and market context
3. Plan Entry and Exit Points
- Enter during accumulation phases
- Exit during distribution phases
- Use appropriate position sizing
:::example Trading Setup Example:
A forex pair shows:
- Three weeks of sideways action
- Volume spikes on every dip to support
- High volume bars with narrow spreads and mid-to-high closes
Strategy: 1. Wait for breakout above resistance 2. Enter long position on pullback to breakout level 3. Place stop loss below accumulation range 4. Monitor for distribution signals to exit :::
Risk Management Considerations
Position Sizing:
- Larger positions during clear accumulation
- Smaller positions during uncertain phases
- Adjust size based on signal strength
Stop Loss Placement:
- Below accumulation zones for long positions
- Above distribution zones for short positions
- Account for normal price fluctuations
Profit Taking:
- Partial profits during strong trends
- Complete exits when distribution begins
- Trail stops during markup phases
Common Mistakes and How to Avoid Them
Even experienced traders make errors when applying vsa accumulation distribution analysis. Understanding these pitfalls helps improve accuracy and results.
Mistake 1: Ignoring Market Context
The Error: Analyzing VSA signals in isolation without considering broader market conditions.
The Solution:
- Always consider overall market trend
- Check major indices and sector performance
- Account for fundamental factors affecting the asset
Mistake 2: Premature Entry
The Error: Entering positions based on early accumulation signs without proper confirmation.
The Solution:
- Wait for multiple confirming signals
- Look for volume expansion on breakouts
- Ensure proper risk-reward ratio before entry
Mistake 3: Holding Too Long
The Error: Failing to recognize distribution phases and holding positions too long.
The Solution:
- Regularly monitor for distribution signals
- Set clear exit criteria before entering trades
- Don't let profits turn into losses
:::warning Remember that VSA is an art as much as a science. It requires practice and experience to interpret signals accurately. Start with paper trading to develop your skills before risking real capital. :::
Mistake 4: Overlooking Timeframe Analysis
The Error: Focusing only on one timeframe without checking higher and lower periods.
The Solution:
- Use multiple timeframe analysis
- Ensure signals align across timeframes
- Use higher timeframes for context, lower for timing
Mistake 5: Misinterpreting Volume
The Error: Assuming all high volume is bullish or all low volume is bearish.
The Solution:
- Always analyze volume in context of price spread and close
- Consider the phase of the market cycle
- Look for unusual volume relative to recent activity
Conclusion
Mastering VSA accumulation distribution analysis provides traders with a significant edge in understanding market dynamics and timing entries and exits. By recognizing when smart money is accumulating or distributing positions, you can align your trading decisions with institutional activity rather than fighting against it.
Key takeaways for successful VSA application:
- Focus on the relationship between volume, spread, and closing price rather than individual elements
- Identify market phases systematically using established VSA principles
- Confirm signals across multiple timeframes before making trading decisions
- Manage risk appropriately based on signal strength and market conditions
- Practice regularly to develop intuition for reading VSA patterns
Remember that vsa accumulation distribution analysis is most effective when combined with proper risk management and realistic expectations. No single methodology works 100% of the time, but VSA provides valuable insights into market structure that can significantly improve your trading results.
Start practicing these concepts on your charts today. Begin with paper trading to develop your pattern recognition skills, then gradually implement VSA analysis into your live trading strategy. With consistent application and continuous learning, you'll develop the ability to spot smart money activity and position yourself for more profitable trades.
Ready to enhance your chart analysis skills? Begin implementing these VSA accumulation distribution techniques on your favorite trading instruments and track your improvement over time. The market always provides new learning opportunities for those willing to study its language of volume and price.