# The Head and Shoulders Pattern Trading Guide: Master This Powerful Reversal Signal
The head and shoulders pattern is one of the most reliable and widely recognized chart formations in technical analysis. This classic reversal pattern has been helping traders identify trend changes and profit opportunities across all financial markets for decades. Whether you're trading forex, stocks, cryptocurrencies, or commodities, understanding how to spot and trade the head and shoulders pattern trading setups can significantly improve your trading results.
This comprehensive guide will teach you everything you need to know about this powerful pattern, from basic recognition to advanced trading strategies. We'll explore both the traditional head and shoulders top and its inverse counterpart, provide real-world examples, and share proven techniques for maximizing your trading success.
Table of Contents
- [What is the Head and Shoulders Pattern?](#what-is-the-head-and-shoulders-pattern)
- [Anatomy of the Head and Shoulders Formation](#anatomy-of-the-head-and-shoulders-formation)
- [Types of Head and Shoulders Patterns](#types-of-head-and-shoulders-patterns)
- [How to Trade Head and Shoulders Patterns](#how-to-trade-head-and-shoulders-patterns)
- [Advanced Trading Strategies and Tips](#advanced-trading-strategies-and-tips)
- [Common Mistakes and How to Avoid Them](#common-mistakes-and-how-to-avoid-them)
- [Conclusion](#conclusion)
What is the Head and Shoulders Pattern?
The head and shoulders pattern is a chart formation that signals a potential reversal in the current trend. It consists of three peaks, where the middle peak (the "head") is higher than the other two peaks (the "shoulders"). This pattern typically appears at the end of an uptrend and suggests that the bullish momentum is weakening, potentially leading to a bearish reversal.
:::key-concept The head and shoulders pattern is considered one of the most reliable reversal patterns in technical analysis, with historical accuracy rates often exceeding 70% when properly identified and traded. :::
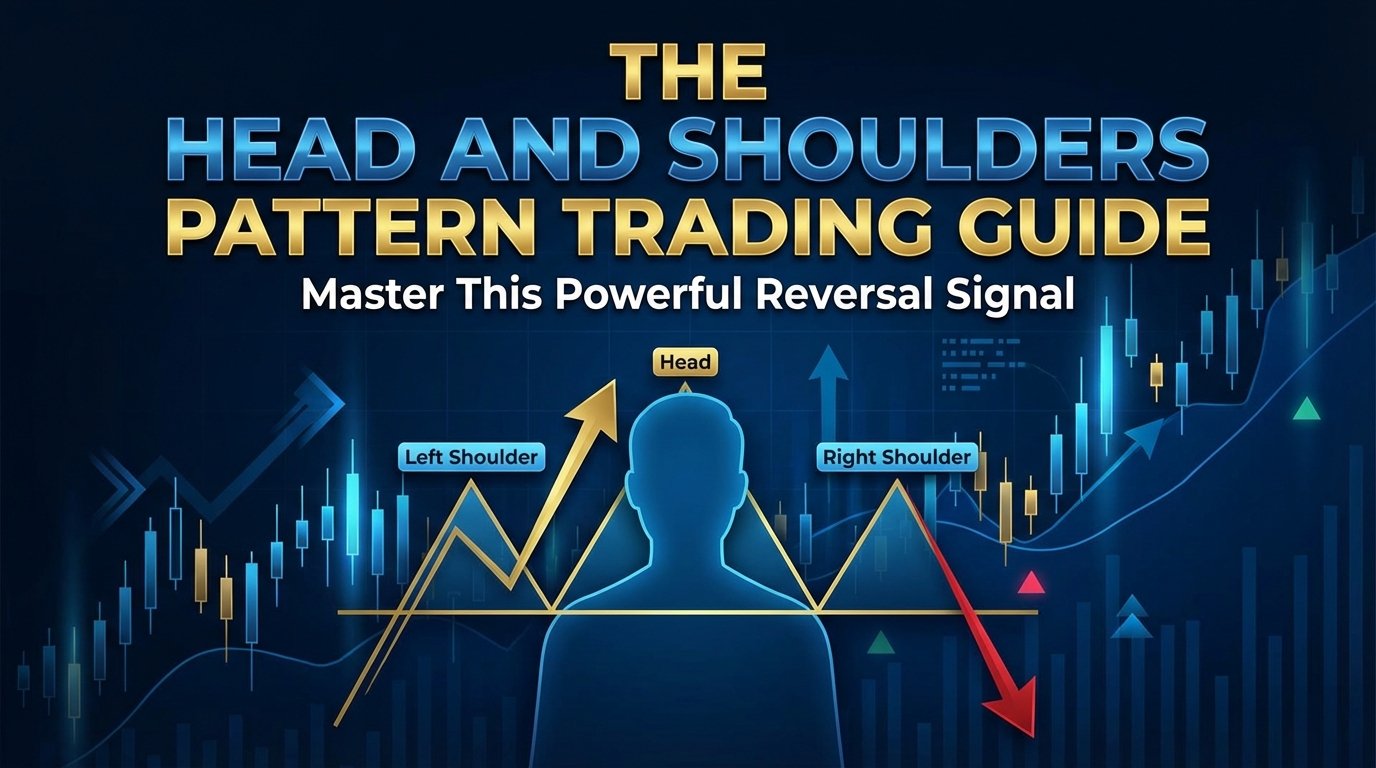
The pattern gets its name from its visual resemblance to a human silhouette - a left shoulder, a head in the middle, and a right shoulder. What makes this formation particularly powerful is that it represents a clear shift in market psychology from bullish to bearish sentiment.
Why This Pattern Works
The effectiveness of the head and shoulders pattern trading strategy stems from the underlying market dynamics it represents:
- Weakening buying pressure: Each successive peak shows diminishing bullish momentum
- Increased selling interest: Lower highs indicate growing bearish sentiment
- Support level breakdown: The neckline break confirms the trend reversal
- Volume confirmation: Typically, volume decreases during the head formation and increases on the breakdown
Anatomy of the Head and Shoulders Formation
To successfully trade head and shoulders patterns, you must understand each component and its significance:
The Left Shoulder
The left shoulder forms during the existing uptrend and represents:
- A normal pullback in an ongoing bull market
- Usually accompanied by healthy trading volume
- Price reaches a new high before declining to create the first "shoulder"
The Head
The head is the highest point of the pattern and shows:
- One final push higher, often on decreasing volume
- The last gasp of bullish momentum
- A peak that exceeds the left shoulder high
- Often characterized by reduced participation from buyers
The Right Shoulder
The right shoulder completes the pattern and demonstrates:
- Failure to reach the head's high, showing weakening bulls
- Similar height to the left shoulder (though slight variations are acceptable)
- Often formed on lower volume than previous peaks
- Sets up the final breakdown below the neckline
The Neckline
The neckline is perhaps the most critical component:
- Drawn by connecting the lows between the shoulders and head
- Acts as a key support level during pattern formation
- Its break triggers the bearish reversal signal
- Can be horizontal, upward sloping, or downward sloping
:::warning Never trade a head and shoulders pattern before the neckline is broken. Many patterns fail to complete, and premature entry can lead to significant losses. :::
Types of Head and Shoulders Patterns
Classic Head and Shoulders Top
This is the traditional bearish reversal pattern that appears after an uptrend. Key characteristics include:
- Forms at market tops
- Signals potential downtrend
- Requires neckline break for confirmation
- Volume should increase on breakdown
:::example Imagine a stock that has been rising for months. It reaches $100 (left shoulder), pulls back to $95, rallies to $105 (head), declines to $95 again, then rallies only to $100 (right shoulder) before breaking below the $95 neckline. This completed head and shoulders pattern trading setup suggests further downside. :::
Inverse Head and Shoulders (Head and Shoulders Bottom)
This bullish reversal pattern appears after downtrends and mirrors the top formation:
- Forms at market bottoms
- Signals potential uptrend reversal
- The "head" is the lowest point
- Volume typically increases on the neckline break upward
Complex Head and Shoulders Patterns
Sometimes, you'll encounter variations that still maintain the pattern's essence:
- Multiple shoulders: Additional smaller peaks on either side
- Irregular shoulders: Shoulders of different heights
- Extended patterns: Longer timeframes with more complex structures
How to Trade Head and Shoulders Patterns
Entry Strategies
Successful head and shoulders pattern trading requires precise entry timing:
Strategy 1: Neckline Break Entry
- Wait for price to close below the neckline
- Enter on the break with confirmation
- Set stop loss above the right shoulder
- Target the pattern's height projected downward
Strategy 2: Retest Entry
- Wait for neckline break and subsequent retest
- Enter when price fails to reclaim neckline support
- Offers better risk-to-reward ratio
- Higher probability setup but may miss some moves
:::tip The retest entry method often provides better risk management, as it confirms the breakdown is genuine rather than a false break. :::
Stop Loss Placement
Proper risk management is crucial when trading head and shoulders patterns:
- Conservative approach: Place stop above the right shoulder high
- Aggressive approach: Use the neckline as stop loss after retest entry
- Trailing stops: Move stops lower as price declines to lock in profits
Profit Targets
Calculating profit targets helps you plan your trades effectively:
1. Measured move: Distance from head to neckline projected downward from the break point 2. Support levels: Previous significant support areas 3. Fibonacci extensions: Use retracement levels for additional targets 4. Risk-reward ratio: Aim for minimum 1:2 risk-to-reward ratio
Volume Analysis
Volume plays a crucial role in confirming head and shoulders patterns:
- Volume should decrease during head formation
- Increase in volume on neckline break confirms the pattern
- Low volume on any retest of neckline resistance strengthens bearish bias
Advanced Trading Strategies and Tips
Multi-Timeframe Analysis
Enhance your head and shoulders pattern trading by using multiple timeframes:
- Higher timeframes: Identify major pattern formations
- Lower timeframes: Fine-tune entry and exit points
- Confluence: Look for patterns aligning across different timeframes
:::key-concept A head and shoulders pattern on a daily chart carries more weight than one on a 15-minute chart. Always consider the pattern's timeframe when assessing its significance. :::
Combining with Other Indicators
Strengthen your analysis by incorporating complementary tools:
RSI Divergence
- Look for bearish divergence during head formation
- RSI making lower highs while price makes higher highs
- Confirms weakening momentum
Moving Averages
- Use key moving averages as additional confirmation
- Head formation often coincides with resistance at major MAs
- Break of important moving averages supports bearish thesis
Support and Resistance Levels
- Identify where neckline aligns with significant support/resistance
- Stronger patterns form at major psychological levels
- Previous support becoming resistance after break
Market Context Considerations
Always evaluate head and shoulders patterns within broader market context:
- Market environment: Patterns work better in trending markets
- News and events: Be aware of fundamental catalysts
- Sector analysis: Consider sector-wide trends and patterns
- Economic cycles: Some patterns perform better in certain market phases
Common Mistakes and How to Avoid Them
Mistake 1: Trading Before Confirmation
Many traders jump the gun and enter positions before the neckline breaks:
Solution: Wait for clear close below neckline with volume confirmation
Mistake 2: Ignoring Volume
Volume is critical for pattern validation:
Solution: Always check volume patterns - increasing volume on breakdown strengthens the signal
Mistake 3: Poor Risk Management
Not setting proper stop losses or position sizes:
Solution: Define risk before entering, use appropriate position sizing based on stop loss distance
Mistake 4: Forcing Patterns
Seeing head and shoulders patterns where they don't exist:
Solution: Be selective and patient - quality over quantity
:::warning Remember that not every three-peak formation is a valid head and shoulders pattern. The pattern must meet specific criteria including proper proportions, volume characteristics, and trend context. :::
Mistake 5: Neglecting Market Context
Trading patterns in isolation without considering broader market conditions:
Solution: Always evaluate patterns within the context of overall market trends and fundamental factors
Pattern Failures
Understand that no pattern works 100% of the time:
- Failed patterns can lead to strong moves in the opposite direction
- Always have an exit strategy if the pattern doesn't develop as expected
- False breaks are common - wait for confirmation
Conclusion
The head and shoulders pattern remains one of the most powerful and reliable formations in technical analysis. When properly identified and traded, these patterns can provide excellent risk-to-reward opportunities across all financial markets. The key to successful head and shoulders pattern trading lies in patience, proper confirmation, and disciplined risk management.
Remember these crucial points:
- Wait for neckline break confirmation before entering trades
- Use volume to validate the pattern's strength
- Implement proper risk management with appropriate stop losses
- Consider market context and use multiple timeframe analysis
- Don't force patterns - quality setups are worth waiting for
As with any trading strategy, practice and experience will improve your ability to identify and trade head and shoulders patterns effectively. Start by analyzing historical charts to familiarize yourself with various pattern formations, then gradually incorporate this knowledge into your live trading approach.
Mastering the head and shoulders pattern trading strategy requires dedication and continuous learning, but the potential rewards make it a valuable addition to any trader's technical analysis toolkit. Combined with proper risk management and market awareness, this classic pattern can significantly enhance your trading performance and help you identify high-probability reversal opportunities in any market condition.
Ready to put your knowledge into practice? Start by analyzing charts in your preferred markets and identifying potential head and shoulders formations. Remember to focus on quality over quantity, and always prioritize risk management in your trading decisions.