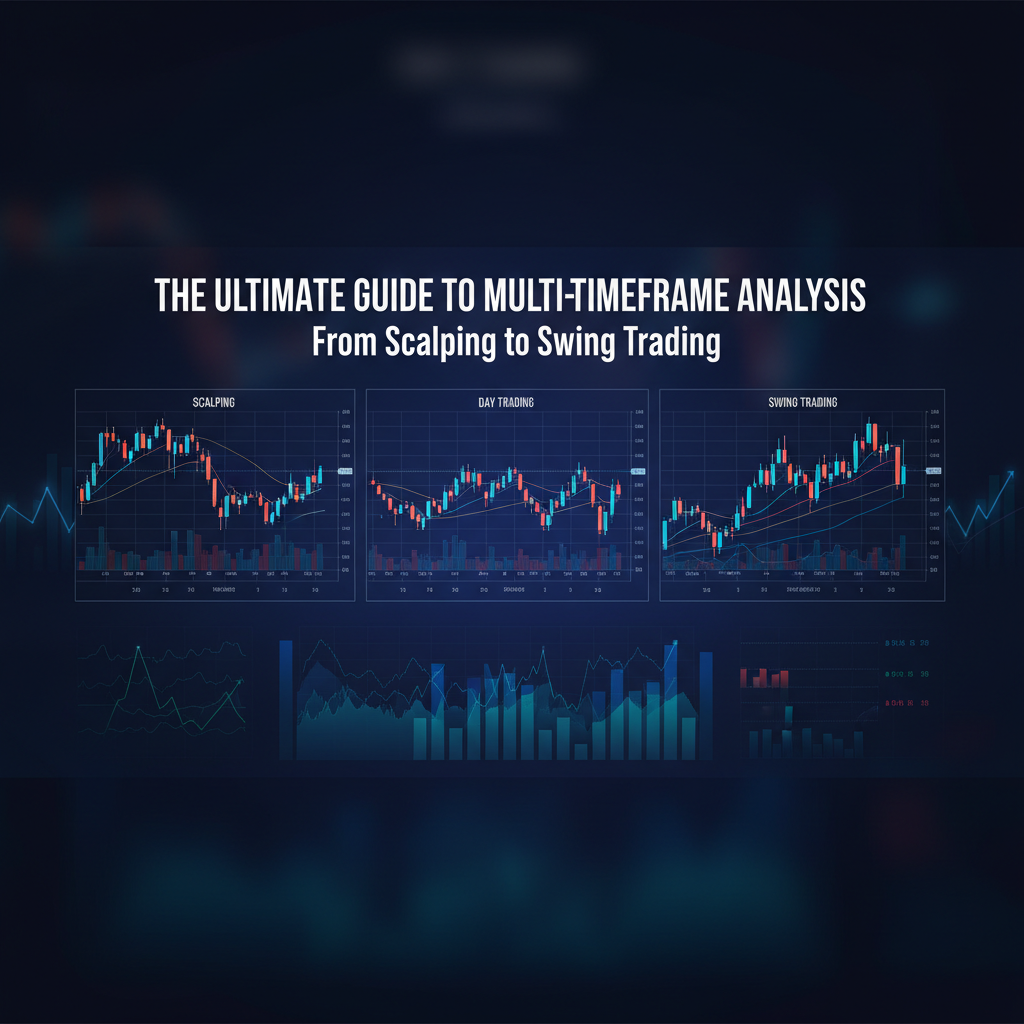
# The Ultimate Guide to Multi-Timeframe Analysis: From Scalping to Swing Trading
Trading the financial markets can feel like an intricate dance, with prices constantly shifting and trends emerging and dissolving. Many traders focus on a single timeframe, often missing the larger context or micro-details that can dramatically impact their success. This is where Multi-Timeframe Analysis (MTFA) becomes an indispensable tool. It's not just a technique; it's a framework for understanding market dynamics comprehensively, allowing you to align your trades with the prevailing forces.
Imagine trying to navigate a dense forest by only looking at the trees immediately around you. You might miss the winding path, the approaching storm, or the distant landmark that guides your journey. Similarly, trading on a single timeframe is like navigating without a broader perspective. MTFA empowers you to see both the forest and the trees, giving you a distinct edge in identifying high-probability setups, optimizing entry and exit points, and managing risk effectively.
This ultimate guide will demystify multi-timeframe analysis, breaking down its core principles, demonstrating its application across various trading styles (scalping, day trading, and swing trading), and providing actionable strategies you can implement immediately. Whether you're a beginner looking to understand market structure better or an experienced trader aiming to refine your edge, MTFA offers a powerful lens through which to view the markets.
Ready to elevate your trading game? Let's dive in.
Table of Contents
- [What is Multi-Timeframe Analysis?](#what-is-multi-timeframe-analysis)
- [The "Top-Down" Approach to Market Analysis](#the-top-down-approach-to-market-analysis)
- [Choosing the Right Timeframe Combination for Your Trading Style](#choosing-the-right-timeframe-combination-for-your-trading-style)
- [Implementing Multi-Timeframe Analysis: Practical Strategies](#implementing-multi-timeframe-analysis-practical-strategies)
- [Strategy 1: Trend Confirmation – Aligning Higher and Lower Timeframes](#strategy-1-trend-confirmation-aligning-higher-and-lower-timeframes)
- [Strategy 2: Precision Entries – Using Lower Timeframes for Sniper Trades](#strategy-2-precision-entries-using-lower-timeframes-for-sniper-trades)
- [Strategy 3: Exit Management and Stop Loss Placement](#strategy-3-exit-management-and-stop-loss-placement)
- [Common Pitfalls and How to Avoid Them](#common-pitfalls-and-how-to-avoid-them)
- [Conclusion: Master the Market's Rhythm](#conclusion-master-the-markets-rhythm)
---
What is Multi-Timeframe Analysis?
Multi-Timeframe Analysis (MTFA) is a technique where traders examine a financial instrument across different timeframes simultaneously to gain a comprehensive understanding of price action. Instead of relying on just one chart, traders combine insights from several horizons—from long-term weekly or daily charts to short-term hourly or minute charts.
:::key-concept Definition of Multi-Timeframe Analysis: The systematic review of price action on multiple timeframes to identify overarching trends, critical support/resistance levels, and precise entry/exit points. :::
The core idea behind MTFA is that each timeframe tells a part of the market's story. A long-term chart reveals the dominant trend, reflecting the "big picture" sentiment. A medium-term chart provides context for recent price movements and potential counter-trends. A short-term chart, on the other hand, offers granular detail, highlighting specific entry and exit opportunities.
For example, a stock might be in a strong uptrend on the weekly chart, but on the daily chart, it could be undergoing a technical retracement. Zooming down to the hourly chart, you might find specific candlestick patterns forming at a key support level, signaling a potential bounce in line with the higher-timeframe uptrend. Without MTFA, a trader might only see the daily retracement and miss the underlying bullish strength, or conversely, only see the long-term trend and enter prematurely during a strong pullback.
:::tip Think of timeframes as different lenses: a wide-angle lens for the overall landscape, a standard lens for specific areas, and a macro lens for fine details. MTFA encourages you to use all three in conjunction. :::
Why is MTFA So Powerful?
1. Confirms Trends: It helps confirm the strength and direction of a trend by seeing if it aligns across multiple timeframes. 2. Identifies Critical Levels: Key support and resistance levels become more significant when they are respected across different timeframes. 3. Pinpoints Entries: Lower timeframes can be used to fine-tune entry points, reducing risk and improving reward-to-risk ratios. 4. Improves Exit Strategy: Understanding how price reacts on different timeframes aids in objective take-profit and stop-loss placement. 5. Filters Out Noise: Focusing solely on a short timeframe can lead to overtrading due to market "noise." MTFA helps distinguish significant moves from minor fluctuations. 6. Reduces False Signals: Signals that appear strong on one timeframe might be contradicted by another, helping you avoid low-probability trades.
By integrating MTFA into your trading routine, you move beyond scattered observations to a cohesive, well-informed decision-making process.
The "Top-Down" Approach to Market Analysis
The "Top-Down" approach is the most common and effective method for applying multi-timeframe analysis. It involves starting with the longest timeframe relevant to your trading style and progressively moving down to shorter timeframes. This ensures that your trading decisions are always aligned with the dominant market forces.
Here's a typical breakdown of the top-down methodology:
1. Start with the Highest Timeframe (Macro View):
- Purpose: Identify the primary trend direction, significant long-term support and resistance zones, and major chart patterns.
- Example: For a swing trader, this might be the weekly or daily chart. For a day trader, it could be the 4-hour or daily chart. This timeframe establishes your directional bias.
- Action: Determine if the market is trending up, down, or ranging. Mark major highs and lows, and key S/R levels.
2. Move to the Intermediate Timeframe (Contextual View):
- Purpose: Observe the recent price action within the context of the higher timeframe. Look for pullbacks, consolidations, and the formation of smaller trends.
- Often used for: Identifying smaller trends that might be counter to the main trend but offer trading opportunities, or confirming the higher timeframe's trend with recent momentum.
- Example: If your highest timeframe is weekly, your intermediate might be daily. If your highest is daily, your intermediate might be 4-hour or 1-hour.
- Action: Refine your S/R levels, identify emerging patterns, and gauge the strength of the current movement.
3. Descend to the Lowest Timeframe (Execution View):
- Purpose: Pinpoint precise entry and exit points. Look for confirmation signals in line with the higher timeframe's direction.
- This timeframe is where: You identify specific candlestick patterns, indicator crossovers, or break/retest setups to trigger your trade.
- Example: For a swing trader, this might be the 1-hour or 30-minute chart. For a day trader, it could be the 5-minute or 15-minute chart. For a scalper, anything from 1-minute to 5-minute.
- Action: Wait for your specific entry trigger, manage your trade, and scale out or exit at predefined targets.
:::example Top-Down for a Swing Trader (EUR/USD, Long Bias):
1. Weekly Chart: Identifies a strong, established uptrend. Price is consistently making higher highs and higher lows. No major resistance ahead for a significant distance. 2. Daily Chart: Shows a temporary pullback within the weekly uptrend. Price has retraced to a previous support level that also aligns with a 50-period moving average. Bullish divergence on an oscillator is forming. 3. 4-Hour Chart: After reaching the daily support, price forms a bullish engulfing candle on the 4-hour chart, breaks a short-term downtrend line, and retests it. This provides the ideal entry point, confirming the resume of the higher timeframe uptrend. :::
:::warning Never trade against the highest timeframe trend unless you have a very specific, high-probability counter-trend strategy and a clear understanding of its risks. Counter-trend trading is generally more advanced and best avoided by newer traders. :::
Understanding and consistently applying the top-down approach ensures that you're always trading with the current of the market, significantly increasing your probability of success.
Choosing the Right Timeframe Combination for Your Trading Style
The optimal timeframe combination is not universal; it depends heavily on your personal trading style, your available time, and your risk tolerance. There's no "one size fits all" answer, but some general guidelines can help you select the most effective setup.
:::key-concept The 1:4 to 1:6 Ratio Rule of Thumb: A common guideline suggests selecting timeframes that are roughly 4 to 6 times apart. For example, if your execution timeframe is 15 minutes, your intermediate could be 1 hour (15 x 4), and your higher timeframe could be 4 hours (15 x 16 or 1 x 4). :::
This ratio helps ensure that the higher timeframe provides enough context without being so far removed that it becomes irrelevant to your shorter-term actions. Here are common combinations for different trading styles:
1. Scalping
- Goal: Profit from small price movements, often within minutes or even seconds.
- Highest Timeframe (Context): 15-Minute or 5-Minute Chart. Used for identifying immediate price direction, support/resistance, and overall volatility.
- Intermediate Timeframe (Confirmation): 3-Minute or 1-Minute Chart. Used to confirm immediate trends or breakouts.
- Lowest Timeframe (Execution): 1-Minute or Tick Chart. Used for precise entries and quick exits.
:::example Scalping Combination:
:::
- 15-Minute: Identifies a strong downtrend, price approaching a minor support.
- 5-Minute: Price breaks below the minor support and retests it as resistance.
- 1-Minute: A bearish candle forms at the retest, signaling a short entry for a quick scalp downwards.
2. Day Trading
- Goal: Open and close trades within the same trading day, avoiding overnight risk.
- Highest Timeframe (Context): Daily or 4-Hour Chart. Establishes the daily directional bias, major S/R, and overall market structure.
- Intermediate Timeframe (Confirmation): 1-Hour or 30-Minute Chart. Used to plan trade setups, identify pullbacks within the daily trend, and monitor momentum.
- Lowest Timeframe (Execution): 15-Minute or 5-Minute Chart. Used for precise entries, stop-loss placement, and managing trades.
:::example Day Trading Combination:
:::
- Daily: Strong uptrend established, price holding above major moving averages.
- 1-Hour: Price is pulling back to a significant hourly support level that aligns with a fresh demand zone.
- 5-Minute: A double bottom pattern forms on the 5-minute chart at the hourly support, followed by a break of a short-term trendline, signaling a long entry.
3. Swing Trading
- Goal: Capture larger price swings over several days to weeks.
- Highest Timeframe (Context): Weekly or Daily Chart. Determines the primary trend, major support/resistance, and long-term market cycles.
- Intermediate Timeframe (Confirmation): 4-Hour or 8-Hour Chart. Used to identify pullbacks, potential trend continuations, and medium-term S/R.
- Lowest Timeframe (Execution): 1-Hour or 30-Minute Chart. Pinpoints precise entries during pullbacks or breakouts, and manages trade positions.
:::example Swing Trading Combination:
:::
- Weekly: Stock is in a multi-week uptrend, strong bullish momentum.
- Daily: Price is forming a bull flag consolidation pattern within the weekly uptrend, holding near a key Fibonacci retracement level.
- 4-Hour: Price breaks out of the daily bull flag pattern, with increased volume and a strong bullish candle, providing a confirmed entry for a swing long.
When choosing your timeframes, consider:
- Your Personality: Are you patient or do you prefer fast-paced action?
- Time Commitment: How much time can you realistically dedicate to monitoring charts?
- Risk Tolerance: Shorter timeframes generally imply more frequent trades and potentially smaller profits/losses per trade, but higher overall transaction costs.
Experiment with different combinations to find what resonates best with your individual trading style and schedule.
Implementing Multi-Timeframe Analysis: Practical Strategies
Now that you understand the "why" and "how" of selecting timeframes, let's explore practical strategies to apply MTFA to your trades. These strategies will help you integrate the top-down approach into a concrete trading plan.
Strategy 1: Trend Confirmation – Aligning Higher and Lower Timeframes
One of the most fundamental uses of MTFA is to confirm the trend. Trading in the direction of the dominant trend, as seen on the higher timeframe, significantly increases your probability of success.
Steps:
1. Identify the Higher Timeframe Trend: Start with your highest chosen timeframe (e.g., Daily for day trading or Weekly for swing trading). Determine if the market is in an uptrend (higher highs, higher lows), downtrend (lower highs, lower lows), or range-bound. :::tip Use moving averages (e.g., 50-period and 200-period EMAs) on the higher timeframe to quickly identify the trend. If the shorter-period MA is above the longer-period MA, the trend is generally bullish, and vice-versa. ::: 2. Look for Alignment on the Intermediate Timeframe: Move to your intermediate timeframe. Confirm that the price action on this chart is either in the same direction as the higher timeframe trend or is showing a temporary pullback that respects key levels. 3. Seek Entry Signals on the Lower Timeframe: Only when the higher and intermediate timeframes are aligned in direction (or the intermediate is showing a clear pullback to a strong higher-timeframe S/R level) should you look for entry signals on your execution timeframe.
:::example Trend Confirmation Strategy in Action (USD/JPY Long Setup):
:::
- Daily Chart (Higher Timeframe): USD/JPY exhibiting a strong uptrend, with price consistently above the 200-period EMA, making higher highs and higher lows. We establish a bullish bias.
- 4-Hour Chart (Intermediate Timeframe): Price is pulling back towards a significant daily support zone and the 50-period EMA on the 4-hour chart, forming a bull flag. This offers a potential area for continuation of the daily uptrend.
- 1-Hour Chart (Execution Timeframe): As price enters the daily support zone on the 4-hour, the 1-hour chart shows a bullish engulfing candlestick pattern forming at a horizontal support level within the bull flag, coupled with a breakout of the flag's upper trendline. This is the confirmed entry signal.
By following this layered approach, you ensure that your trade entries are not isolated events but rather part of a larger, established market movement.
Strategy 2: Precision Entries – Using Lower Timeframes for Sniper Trades
Once you have identified the predominant higher-timeframe trend and potential areas of interest (like support/resistance or supply/demand zones), the lower timeframes become invaluable for pinpointing precise entries. This helps to minimize your stop loss and maximize your reward-to-risk ratio.
Steps:
1. Identify Key Zones on Higher Timeframes: On your highest and intermediate timeframes, mark out significant support/resistance levels, trendlines, or supply/demand zones where you expect a price reaction. 2. Wait for Price to Approach the Zone: Be patient. Allow price to move into your predefined area of interest. 3. Zoom Down for Confirmation: Once price reaches the zone, switch to your lowest (execution) timeframe. Look for specific reversal or continuation patterns that confirm the higher-timeframe direction.
:::example Precision Entry for a Reversal Trade (Gold Short Setup):
:::
- Daily Chart (Higher Timeframe): Gold has been in a strong downtrend. Price has retraced back to a previous resistance level that also coincides with a 61.8% Fibonacci retracement of the previous swing down.
- 4-Hour Chart (Intermediate Timeframe): At this daily resistance, the 4-hour chart shows price consolidating, forming a double top pattern. The Relative Strength Index (RSI) is showing bearish divergence.
- 15-Minute Chart (Execution Timeframe): Price breaks below the neckline of the 4-hour double top on the 15-minute chart, retesting the broken neckline as new resistance. A strong bearish candle forms at this retest, providing a precise short entry. Your stop loss can be placed just above the high of the double top.
:::tip Look for confluence! The more elements (e.g., support/resistance, trendline, moving average, candlestick pattern) that align on a specific timeframe, the stronger the signal. When these elements converge across multiple timeframes, the signal becomes exceptionally strong. :::
Strategy 3: Exit Management and Stop Loss Placement
Multi-timeframe analysis isn't just for entries; it's equally crucial for managing your trades. Higher timeframes help in identifying logical take-profit levels, while lower timeframes can assist in dynamic stop-loss adjustments.
Stop Loss Placement:
- Higher Timeframe for Initial Stop: Place your initial stop loss based on a significant higher-timeframe level (e.g., below a previous swing low for a long trade, or above a previous swing high for a short trade) that, if broken, would invalidate your multi-timeframe bias.
- Lower Timeframe for Tightening: As the trade moves in your favor, use lower timeframe structure (e.g., new swing lows/highs on the 1-hour or 15-minute chart) to trail your stop loss and protect profits.
Take Profit Targets:
- Higher Timeframe for Major Targets: Identify major resistance levels (for long trades) or support levels (for short trades) on your highest or intermediate timeframes. These represent logical price objectives where sellers/buyers are likely to step in aggressively.
- Intermediate Timeframe for Partial Take Profits: Consider taking partial profits at intermediate S/R levels on your intermediate timeframe, especially if price shows signs of consolidation or weakening momentum.
:::example Exit Management Scenario (Stock Long Trade):
:::
- Daily Chart: You entered a long trade based on a daily uptrend signal. The next major resistance is at $150 according to the daily historical chart. This is your primary take-profit target.
- 4-Hour Chart: As price moves towards $150, the 4-hour chart shows a minor resistance at $145. You decide to take 50% of your position off at $145, locking in some profit, and then let the rest run to $150.
- 1-Hour Chart: After gaining significant profit, you notice the 1-hour chart has formed a clear series of higher lows. You move your stop loss under the most recent 1-hour swing low, effectively trailing your stop.
By leveraging MTFA for exit management, you ensure that your profit targets are realistic and significant, while your stop loss is intelligently managed to protect your capital and realized gains.
Common Pitfalls and How to Avoid Them
While highly effective, multi-timeframe analysis is not without its challenges. Being aware of common pitfalls can help you navigate them and improve your overall success.
1. Conflicting Signals (Analysis Paralysis):
- Pitfall: Different timeframes might present conflicting signals, leading to confusion, indecision, or paralysis. For example, the daily chart shows an uptrend, but the 1-hour chart is in a strong downtrend.
- Solution: Stick rigidly to the top-down approach. The highest timeframe dictates your primary bias. Lower timeframes are for confirmation or precision entries in the direction of the higher timeframe. If the lower timeframe is strongly counter-trend, it's likely a pullback; wait for it to run its course and show signs of reversal back in the higher-timeframe direction.
2. Over-Analysis and "Zooming In Too Much":
- Pitfall: Constantly switching between too many timeframes or going down to excessively low timeframes (e.g., tick charts for swing trading) can lead to over-analysis, noise, and missed opportunities.
- Solution: Establish your core 2-3 timeframes and stick to them. Only zoom down to the execution timeframe when price is at your predefined area of interest on the higher charts. Avoid getting lost in the "noise" of ultra-short timeframes if it doesn't align with your trading style.
3. Ignoring the Highest Timeframe:
- Pitfall: Getting caught up in exciting short-term moves on lower timeframes and forgetting the dominant trend of the highest timeframe. This often leads to taking trades against the major trend, which are lower probability.
- Solution: Always have your highest timeframe chart visible or at least review it regularly. Your trading plan should always originate from and be aligned with the highest timeframe's bias. Use the higher timeframe as your "North Star."
4. Inconsistent Application:
- Pitfall: Applying MTFA inconsistently, sometimes using it, sometimes not, leading to erratic results.
- Solution: Integrate MTFA as a core, non-negotiable part of your trading routine. Develop a checklist that clarifies which timeframes you will review and what you are looking for on each before every trade. Consistency is key.
5. Lack of Patience:
- Pitfall: Rushing trades on lower timeframes without waiting for confluence or confirmation from higher timeframes. This is often driven by fear of missing out (FOMO).
- Solution: Patience is a virtue in MTFA. Wait for price to come to your levels, and for the lower timeframes to confirm the higher-timeframe bias. There will always be another trade. Focus on quality over quantity.
:::warning Never blindly follow a signal on a lower timeframe if it contradicts a strong, undeniable trend or major support/resistance on a significantly higher timeframe. :::
By being mindful of these common mistakes and actively working to avoid them, you can harness the full power of multi-timeframe analysis to make more confident and profitable trading decisions.
Conclusion: Master the Market's Rhythm
Multi-timeframe analysis is more than just a technique; it's a disciplined approach to understanding the multifaceted nature of market price action. By viewing the market through multiple lenses—from the overarching currents of the higher timeframes to the granular details of the lower timeframes—you gain a contextual awareness that single-timeframe traders simply cannot achieve.
This guide has walked you through the fundamental principles of MTFA, demonstrated the crucial "top-down" approach, helped you select appropriate timeframe combinations for various trading styles, and provided actionable strategies for trend confirmation, precision entries, and effective exit management. We also highlighted common pitfalls to ensure you navigate this powerful tool effectively.
Key Takeaways:
- Context is King: Always start with the higher timeframes to establish your directional bias and identify major levels.
- Alignment for High Probability: Seek confluence across timeframes. Trade in the direction of the dominant higher-timeframe trend.
- Precision through Zooming In: Use lower timeframes to fine-tune entries and optimize stop-loss placement, enhancing your risk-reward profile.
- Discipline and Patience: MTFA requires a systematic approach and the patience to wait for signals to align across your chosen timeframes.
Incorporating multi-timeframe analysis into your trading strategy will undoubtedly refine your decision-making process, reduce emotional trading, and significantly improve your ability to identify high-probability setups across various market conditions. It allows you to trade with the market's rhythm, rather than fighting against it.
:::tip Don't try to master all timeframes at once. Start with a simple 2-3 timeframe combination that suits your style, practice diligently, and gradually build your expertise. :::
Call to Action: Begin immediately by implementing the top-down approach in your daily chart analysis. Pick an instrument, observe its weekly, daily, and 4-hour charts. Identify the trend, mark key levels, and see how they interact across timeframes. Practice with historical data to build confidence and refine your chosen timeframe combinations. The more you apply MTFA, the more intuitive and powerful it will become in your trading journey.
Happy Trading!