# Trading Double Top Pattern AAPL: Complete Guide to Spotting Reversal Signals
Double top and double bottom patterns are among the most reliable reversal formations in technical analysis, and Apple Inc. (AAPL) provides excellent examples of these patterns due to its high trading volume and institutional interest. Understanding how to identify and trade the double top pattern AAPL formations can significantly enhance your trading success and help you capitalize on major trend reversals.
These chart patterns represent crucial psychological battlegrounds between buyers and sellers, often marking the end of significant trends and the beginning of new market phases. For traders focused on AAPL, mastering these patterns means gaining access to high-probability setups that can deliver substantial profits while maintaining manageable risk.
Table of Contents
- [Understanding Double Top and Double Bottom Patterns](#understanding-double-top-and-double-bottom-patterns)
- [Identifying Double Top Pattern AAPL Formations](#identifying-double-top-pattern-aapl-formations)
- [Trading Strategies for AAPL Reversals](#trading-strategies-for-aapl-reversals)
- [Risk Management and Entry Techniques](#risk-management-and-entry-techniques)
- [Advanced Pattern Recognition Tips](#advanced-pattern-recognition-tips)
- [Conclusion](#conclusion)
Understanding Double Top and Double Bottom Patterns
:::key-concept Double tops and double bottoms are reversal patterns that form when price tests a significant level twice and fails to break through, indicating a potential trend change. :::
Double Top Pattern Characteristics
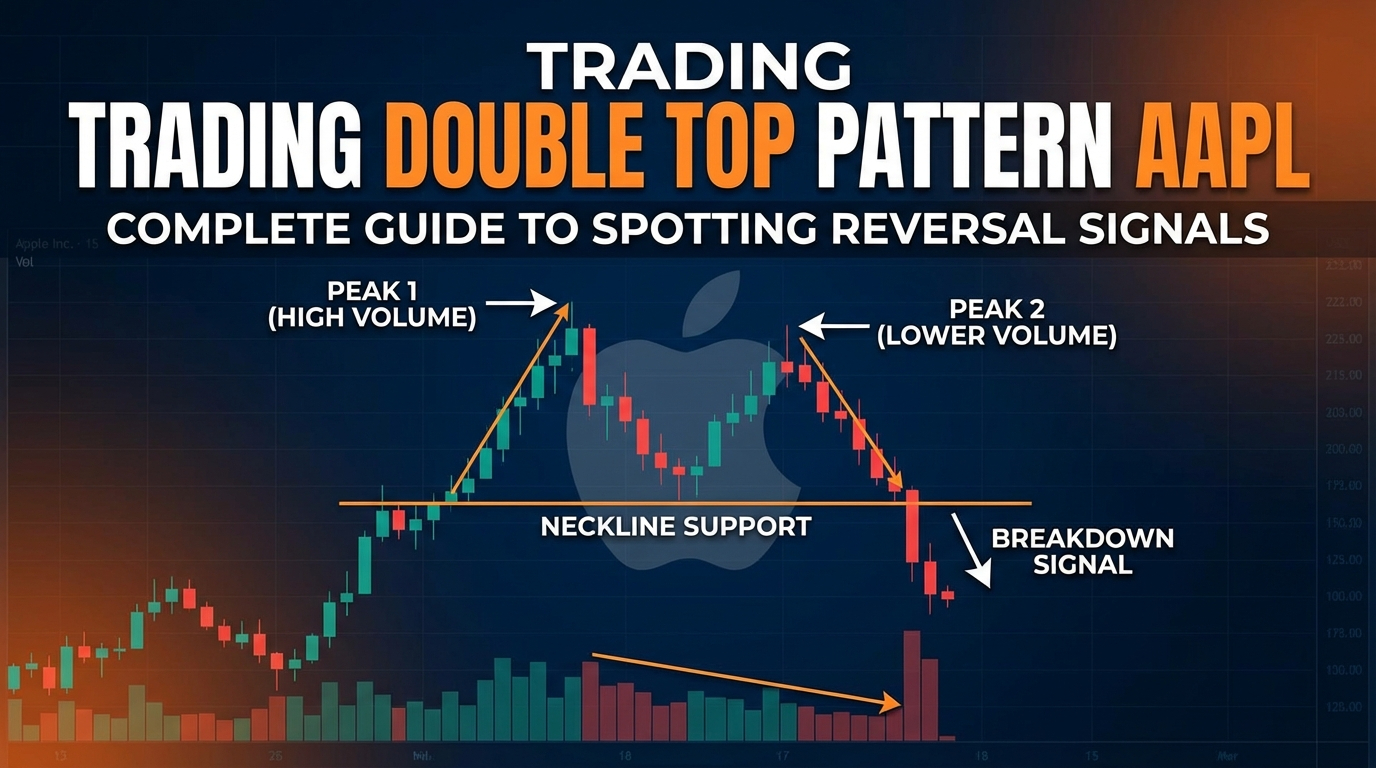
A double top pattern forms during an uptrend and signals potential bearish reversal. The pattern consists of:
- First Peak: Initial test of resistance level with high volume
- Valley: Pullback to support (neckline)
- Second Peak: Retest of resistance with typically lower volume
- Breakdown: Price falls below the neckline support
The double top pattern AAPL traders observe often develops over several weeks or months, making it particularly valuable for swing traders and position traders.
Double Bottom Pattern Structure
Conversely, double bottom patterns form during downtrends and indicate bullish reversals:
- First Trough: Initial test of support with selling pressure
- Peak: Rally to resistance (neckline)
- Second Trough: Retest of support, often with less volume
- Breakout: Price rises above neckline resistance
:::example In AAPL's trading history, double bottom patterns frequently form near major psychological levels like $100, $120, or $150, where institutional buying often emerges to support the stock. :::
Volume Confirmation Signals
Volume plays a critical role in validating these patterns:
- First test: Should show high volume indicating genuine interest
- Second test: Often shows declining volume, suggesting weakening momentum
- Breakout/Breakdown: Requires volume expansion for confirmation
Identifying Double Top Pattern AAPL Formations
Key Identification Criteria
When scanning for double top pattern AAPL setups, focus on these essential elements:
1. Clear Uptrend Preceding the Pattern
- AAPL must be in a defined upward trend
- Multiple higher highs and higher lows established
- Strong momentum leading into the first peak
2. Significant Resistance Level
- Price encounters meaningful resistance
- Level should align with previous highs, psychological numbers, or technical levels
- Multiple timeframe confluence increases reliability
3. Adequate Time Between Peaks
- Minimum 2-3 weeks between peaks for swing trading
- Intraday patterns require 2-3 hours minimum separation
- Longer timeframes generally produce more reliable signals
:::tip Use multiple timeframes when analyzing double top pattern AAPL formations. A pattern visible on both daily and weekly charts carries significantly more weight than one appearing only on shorter timeframes. :::
AAPL-Specific Pattern Characteristics
Apple's stock exhibits unique characteristics that affect pattern formation:
- Earnings Impact: Quarterly earnings often trigger pattern completion
- Product Launches: iPhone releases and other announcements can invalidate patterns
- Market Leadership: AAPL's correlation with broader tech sector affects pattern reliability
- Options Activity: Heavy options volume around key strikes can create artificial support/resistance
False Pattern Recognition
Avoid these common mistakes when identifying patterns:
- Premature Pattern Calls: Waiting for complete formation before acting
- Ignoring Volume: Patterns without volume confirmation often fail
- Wrong Timeframe: Using inappropriate timeframes for your trading style
- Market Context: Failing to consider broader market conditions
Trading Strategies for AAPL Reversals
Double Top Trading Strategy
Setup Requirements:
- Confirmed double top pattern AAPL formation
- Clear neckline support identified
- Volume declining on second peak
Entry Methods:
1. Conservative Approach
- Wait for close below neckline
- Enter short on retest of broken neckline
- Reduces false breakout risk
2. Aggressive Approach
- Enter short at second peak formation
- Tighter stop loss above recent high
- Higher risk but better reward-to-risk ratio
:::warning Never enter trades based on incomplete patterns. Wait for proper confirmation through neckline breaks and volume analysis. :::
Double Bottom Trading Strategy
Entry Techniques:
1. Breakout Method
- Buy when price breaks above neckline resistance
- Volume should expand on breakout
- Target measured move from pattern height
2. Pullback Method
- Wait for retest of broken neckline as support
- Enter long on bounce confirmation
- Lower risk entry with good reward potential
Target Calculation:
- Measure distance from neckline to lowest point
- Project this distance upward from breakout point
- Consider taking partial profits at 50% and 75% of target
Position Sizing Guidelines
For AAPL reversal patterns, implement proper position sizing:
- Account Risk: Never risk more than 1-2% of account per trade
- Pattern Reliability: Larger positions for higher-timeframe patterns
- Market Conditions: Reduce size during volatile market periods
- Correlation Risk: Consider AAPL's correlation with QQQ and SPY
:::tip AAPL's high liquidity makes it ideal for scaling into positions. Consider entering 25-50% position initially and adding on confirmation. :::
Risk Management and Entry Techniques
Stop Loss Placement
For Double Top Shorts:
- Place stop above the highest peak with buffer
- Consider market volatility when setting buffer size
- Use ATR (Average True Range) for dynamic stop placement
- Trail stops as pattern develops favorably
For Double Bottom Longs:
- Set stop below lowest trough
- Allow for normal market fluctuation
- Consider support zones below pattern
Entry Timing Optimization
Maximize your edge by timing entries carefully:
1. Market Hours Consideration
- Best entries often occur during first hour of trading
- Avoid low-volume periods that may produce false signals
- Monitor pre-market action for gap scenarios
2. Economic Calendar Awareness
- Check for AAPL earnings dates
- Monitor Fed announcements and tech sector news
- Avoid entering before major economic releases
3. Technical Confluence
- Look for additional support/resistance levels
- Check for trend line breaks or holds
- Consider moving average positioning
:::example A trader identifies a double top pattern AAPL formation at $180 resistance. The neckline sits at $175. Entry comes on a close below $175 with increased volume, stop loss at $182, and target at $170 (measuring the $5 pattern height downward from the neckline). :::
Multi-Timeframe Analysis
Enhance pattern reliability through timeframe analysis:
Primary Timeframe: Daily charts for swing trades
- Identify overall pattern structure
- Determine neckline levels
- Assess volume characteristics
Confirmation Timeframe: 4-hour charts
- Confirm pattern validity
- Fine-tune entry points
- Monitor momentum indicators
Execution Timeframe: 1-hour charts
- Precise entry timing
- Monitor immediate price action
- Adjust stops based on intraday levels
Advanced Pattern Recognition Tips
Pattern Variations and Adaptations
Real-world patterns rarely match textbook examples perfectly:
Triple Tops/Bottoms
- Extension of double pattern concept
- Third test often provides strongest reversal signal
- Requires patience but offers excellent reward-to-risk
Asymmetric Patterns
- Peaks or troughs at slightly different levels
- Still valid if within 2-3% of each other
- Focus on overall resistance/support zone rather than exact levels
Complex Corrections
- Patterns with multiple waves between peaks
- W or M shaped formations
- Apply same principles with modified measurements
Integration with Other Technical Tools
Combine pattern analysis with additional indicators:
Moving Averages
- 50-day and 200-day moving averages as confluence
- Pattern more reliable when aligned with MA resistance/support
- Consider MA slope and positioning
RSI and MACD Divergence
- Look for divergence between price peaks/troughs and indicators
- Strengthens pattern validity significantly
- Provides early warning signals
Fibonacci Retracements
- Use to identify potential neckline levels
- 38.2% and 61.8% levels often coincide with pattern support/resistance
- Helps determine target areas beyond measured moves
:::warning Never rely solely on double top or bottom patterns. Always seek confirmation from volume, momentum indicators, and broader market context before executing trades. :::
Sector and Market Context
AAPL patterns must be evaluated within broader context:
Technology Sector Analysis
- Monitor QQQ and XLK for sector confirmation
- Check other mega-cap tech stocks for similar patterns
- Consider sector rotation implications
Market Environment Assessment
- Bull markets favor double bottom patterns
- Bear markets favor double top formations
- Sideways markets can produce false patterns
Institutional Activity
- Monitor institutional ownership changes
- Track insider buying/selling activity
- Consider options flow and dark pool activity
Pattern Failure Management
Not all patterns complete successfully. Prepare for failures:
Invalidation Signals
- Strong breakout above double top resistance
- Breakdown below double bottom support
- Significant volume expansion in wrong direction
Adaptive Strategies
- Quick exit when pattern invalidates
- Consider reversal trades if conditions align
- Reassess overall market thesis
:::key-concept Successful pattern trading requires discipline to exit failed setups quickly and preserve capital for higher-probability opportunities. :::
Seasonal Considerations for AAPL
Apple's stock shows seasonal tendencies that affect pattern formation:
Product Cycle Impact
- iPhone launch seasons often create volatility
- Holiday sales periods influence price action
- Supply chain updates affect investor sentiment
Earnings Seasonality
- Quarterly reporting creates natural rhythm
- Guidance changes can override technical patterns
- Options expiration effects around earnings
Technology Integration
Leverage modern tools for pattern identification:
Automated Scanning
- Use pattern recognition software
- Set alerts for potential formations
- Screen multiple timeframes simultaneously
AI-Enhanced Analysis
- Combine traditional patterns with AI insights
- Use machine learning for pattern validation
- Integrate sentiment analysis with technical patterns
Common Trading Mistakes
Avoid these frequent errors:
1. Premature Entry
- Entering before pattern completion
- Ignoring confirmation signals
- Trading on hope rather than evidence
2. Poor Risk Management
- Inadequate stop loss placement
- Position sizes too large
- Failing to adjust for volatility
3. Context Ignorance
- Ignoring broader market trends
- Missing fundamental developments
- Trading against major support/resistance
:::tip Keep a trading journal specifically for pattern trades. Track success rates, common mistakes, and market conditions that favor different pattern types. :::
Conclusion
Mastering the double top pattern AAPL formations requires combining technical pattern recognition with proper risk management and market context awareness. These powerful reversal patterns offer excellent trading opportunities when properly identified and executed, but success depends on patience, discipline, and thorough analysis.
The key to profitable pattern trading lies in waiting for complete formation, seeking volume confirmation, and managing risk appropriately. Remember that not every pattern will complete successfully, and quick exits from failed setups preserve capital for better opportunities.
By focusing on high-quality setups, maintaining strict risk parameters, and considering broader market conditions, traders can effectively capitalize on AAPL's double top and double bottom patterns. The combination of Apple's liquidity, institutional interest, and technical responsiveness makes it an ideal stock for pattern-based trading strategies.
Start by paper trading these patterns to build confidence and refine your identification skills. Once you've demonstrated consistent success in simulated trading, gradually implement these strategies with real capital while maintaining conservative position sizing.
Ready to enhance your pattern recognition skills? Practice identifying double top and double bottom formations on AAPL charts across multiple timeframes, and develop your own systematic approach to trading these powerful reversal patterns.