# Understanding Trend Day vs Ranging Day: A Complete Guide to Market Structure
Every trading day tells a unique story through price action, volume, and market structure. Understanding the fundamental difference between a trend day vs ranging day is crucial for any trader looking to improve their market timing and strategy selection. These two distinct market conditions require completely different approaches, and misreading the day's character can lead to costly mistakes.
In this comprehensive guide, we'll explore the anatomy of both trend days and ranging days, helping you identify each condition early and adapt your trading strategy accordingly. Whether you're a day trader, swing trader, or long-term investor, recognizing these patterns will significantly enhance your trading performance.
Table of Contents
- [What Defines a Trend Day](#what-defines-a-trend-day)
- [Characteristics of a Ranging Day](#characteristics-of-a-ranging-day)
- [Key Differences and Identification Techniques](#key-differences-and-identification-techniques)
- [Trading Strategies for Each Market Condition](#trading-strategies-for-each-market-condition)
- [Volume and Market Structure Analysis](#volume-and-market-structure-analysis)
- [Common Mistakes and How to Avoid Them](#common-mistakes-and-how-to-avoid-them)
- [Conclusion](#conclusion)
What Defines a Trend Day
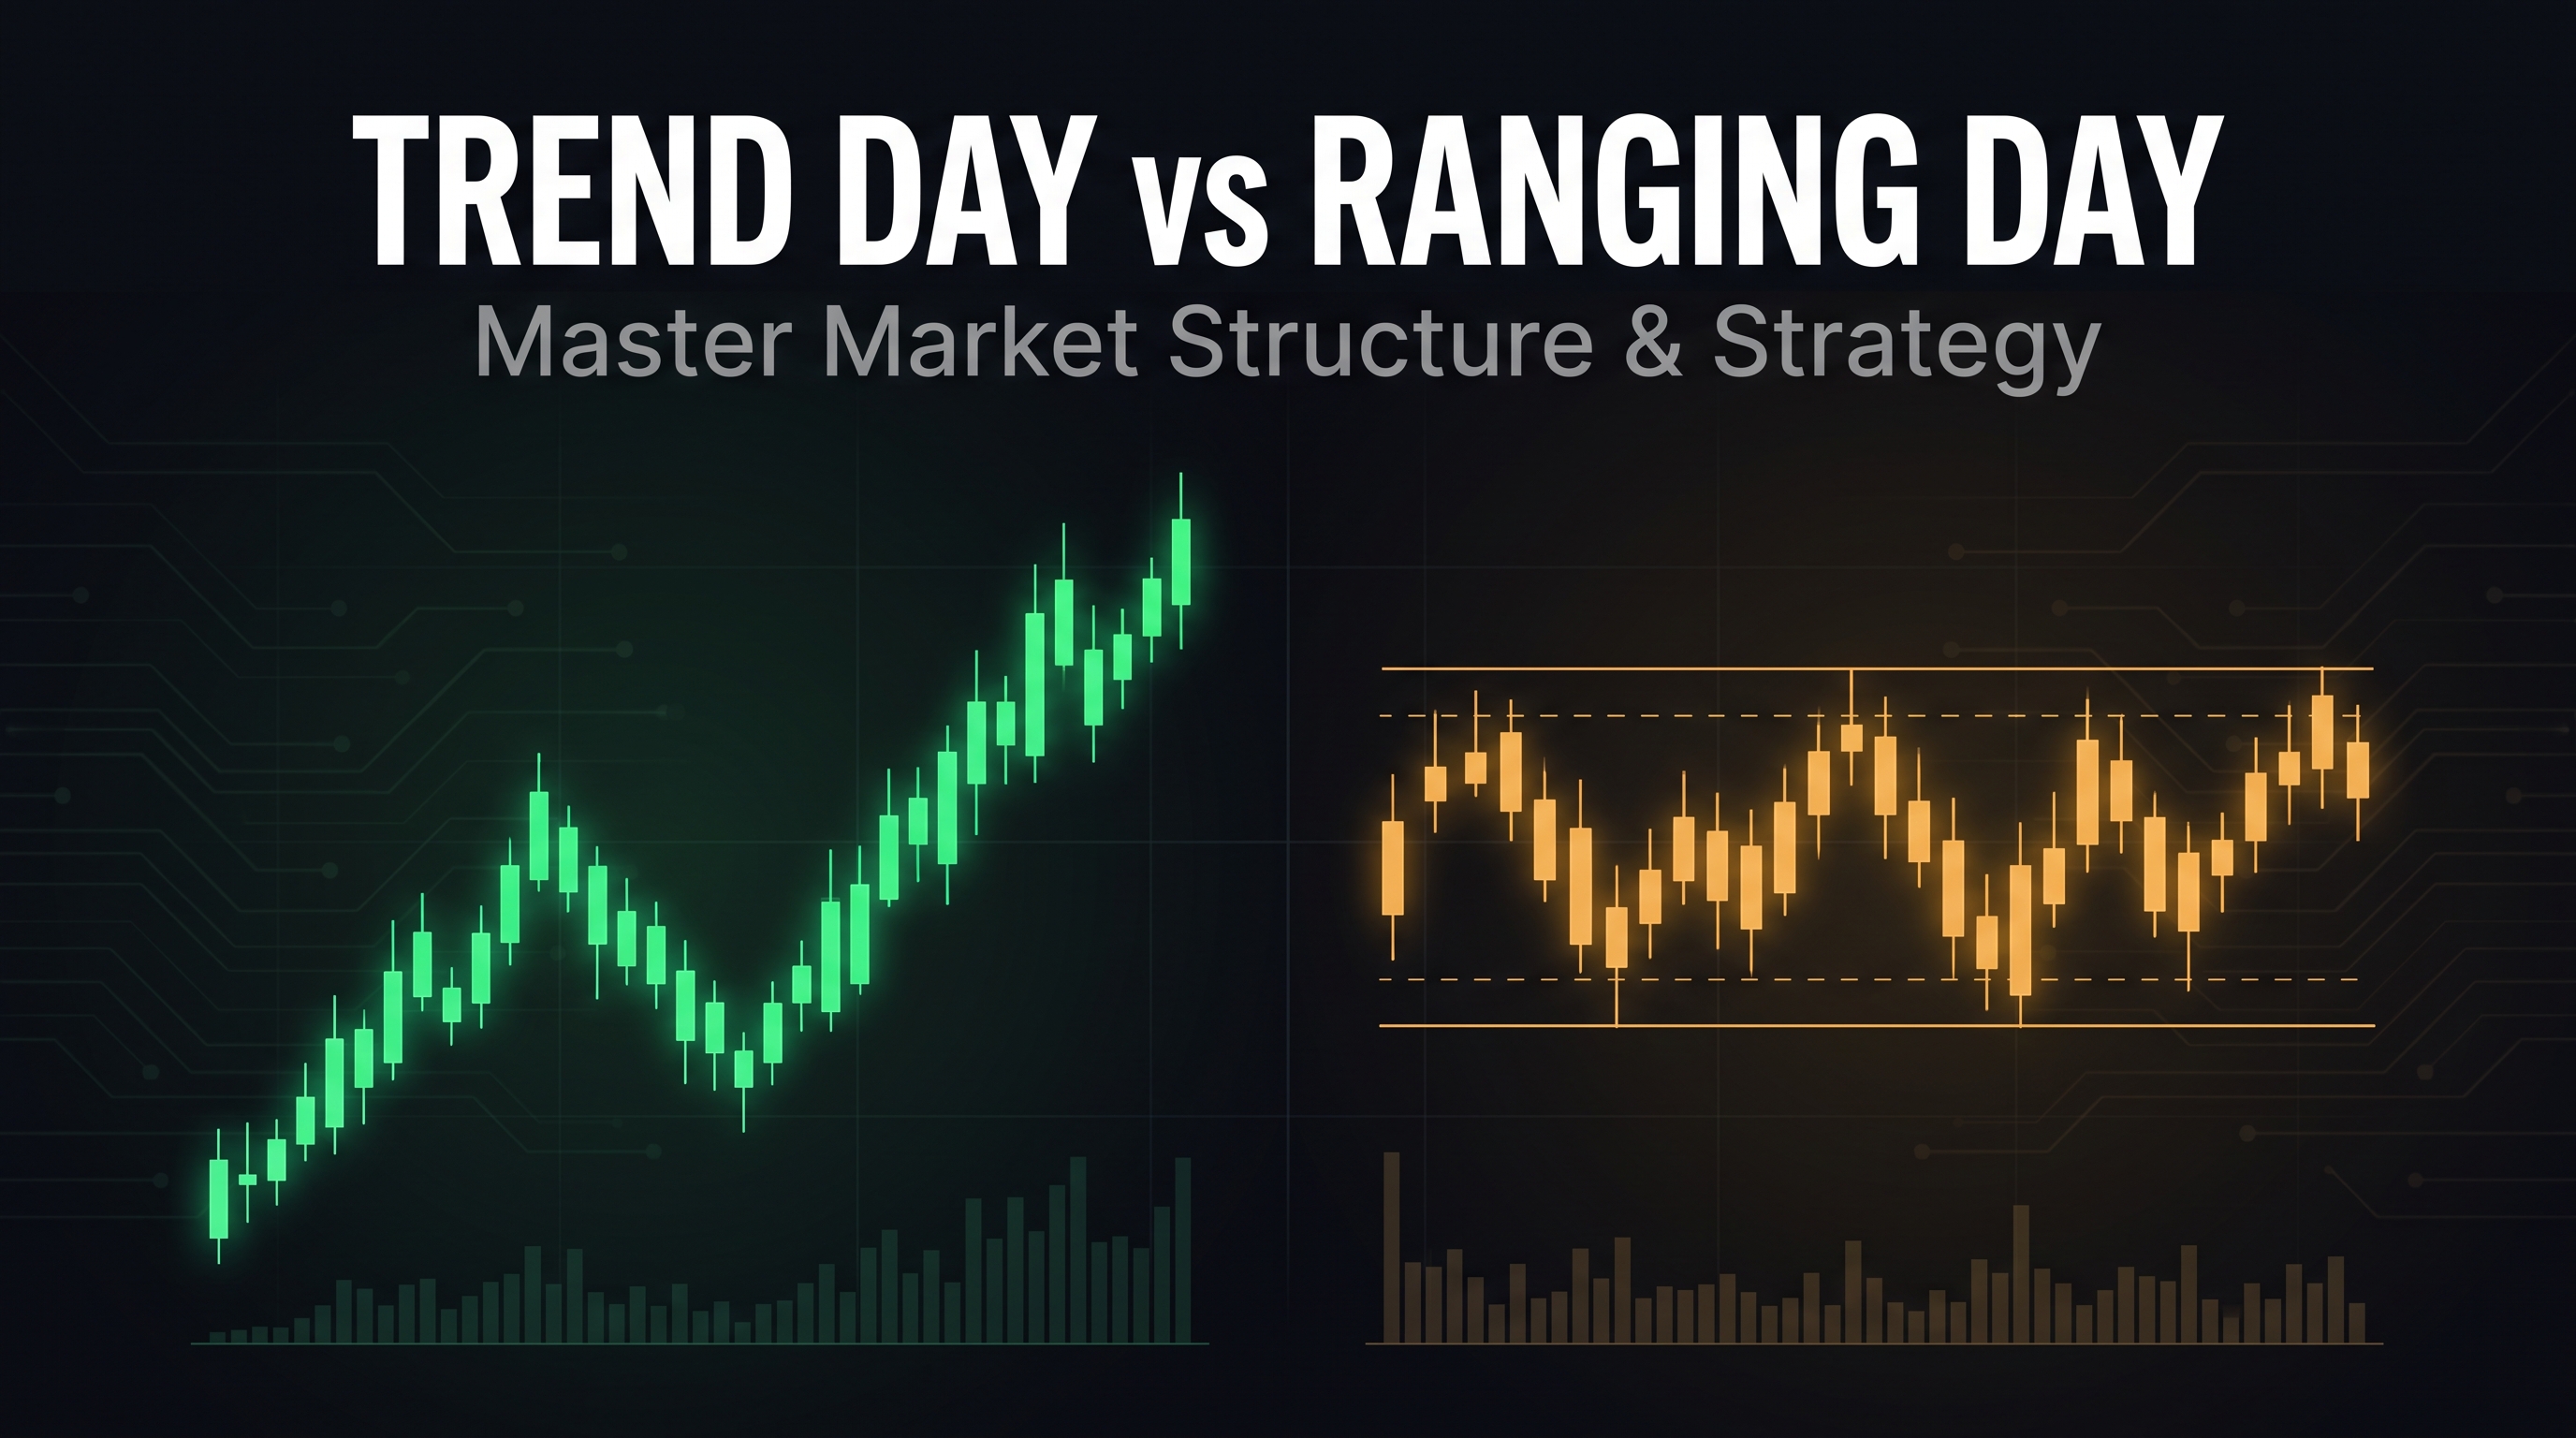
A trend day represents one of the most powerful and profitable market conditions for traders who can identify it early. During a trend day vs ranging day scenario, the trend day stands out for its sustained directional movement with minimal pullbacks.
Core Characteristics of Trend Days
Directional Persistence: The market moves consistently in one direction throughout the trading session, with only minor retracements that typically don't exceed 38.2% of the major move.
Gap Opening: Many trend days begin with a significant gap in the direction of the trend, often accompanied by strong volume and immediate follow-through.
Limited Pullbacks: Unlike ranging days, trend days feature shallow pullbacks that quickly resume the primary direction. These retracements often find support or resistance at key moving averages.
Volume Characteristics: Trend days typically show expanding volume during directional moves and contracting volume during minor pullbacks.
:::key-concept Trend days often develop when the market breaks through significant support or resistance levels, institutional levels, or when major news catalysts drive sustained buying or selling pressure. :::
Types of Trend Days
Strong Trend Days: Feature gaps at the open that never get filled, with price consistently making new highs or lows throughout the session. These are the most profitable but also the rarest.
Weak Trend Days: Show overall directional bias but include more significant pullbacks (up to 50% retracements). While less dramatic, these still offer excellent trading opportunities.
Late Trend Days: Begin as ranging days but transition into trending behavior, often triggered by news events or technical breakouts during the session.
:::example Consider a stock that opens with a 2% gap higher on strong earnings. Throughout the day, it continues climbing with only minor 15-30 minute pullbacks that don't retrace more than one-third of each leg up. Volume expands on each rally and contracts during pullbacks. This represents a classic strong uptrend day. :::
Characteristics of a Ranging Day
Ranging days present a completely different market structure compared to trend days. When comparing trend day vs ranging day patterns, ranging days are characterized by sideways price action within defined boundaries.
Defining Features of Ranging Days
Horizontal Price Action: The market oscillates between established support and resistance levels, creating a trading range or consolidation pattern.
Multiple Reversals: Unlike trend days, ranging days feature numerous direction changes as price bounces between the range boundaries.
Balanced Volume: Volume patterns during ranging days often show similar intensity on both up and down moves, indicating equilibrium between buyers and sellers.
Failed Breakouts: Ranging days frequently feature false breakouts above resistance or below support that quickly reverse back into the range.
Range Types and Patterns
Tight Ranges: Narrow trading ranges typically spanning less than 1% of the asset's price. These often precede significant breakouts.
Wide Ranges: Broader consolidation patterns that may span several percentage points, offering multiple trading opportunities within the range.
Ascending/Descending Ranges: Ranges with a slight upward or downward bias, often forming triangle patterns or wedges.
:::warning Ranging days can be deceptive. What appears to be a breakout from the range may actually be a false signal, leading to whipsaws and losses for traders who don't wait for proper confirmation. :::
Range Identification Techniques
Support and Resistance Levels: Clear horizontal levels where price consistently reverses direction multiple times throughout the session.
Moving Average Compression: During ranging days, multiple moving averages often converge, indicating indecision and consolidation.
Volume Analysis: Look for relatively even volume distribution between up and down moves, unlike the expanding/contracting pattern seen in trend days.
:::tip The best ranging day trades often occur at the extremes of the range. Buy near support and sell near resistance, but always use proper risk management as ranges can break unexpectedly. :::
Key Differences and Identification Techniques
Successfully distinguishing between a trend day vs ranging day requires understanding subtle but critical differences in market behavior. Early identification allows traders to select appropriate strategies and avoid costly mismatches.
Early Warning Signs
Opening Behavior:
- Trend Days: Often open with gaps, immediate follow-through, and sustained directional movement within the first hour
- Ranging Days: Typically open near previous close, show immediate reversals, or gap but quickly fill back to previous levels
Volume Patterns:
- Trend Days: Show expanding volume on moves in the trending direction and contracting volume on pullbacks
- Ranging Days: Display more balanced volume patterns with similar intensity in both directions
Price Structure:
- Trend Days: Create a series of higher highs and higher lows (uptrend) or lower highs and lower lows (downtrend)
- Ranging Days: Form horizontal patterns with similar highs and lows throughout the session
Technical Indicators for Day Type Identification
ADX (Average Directional Index): Values above 25-30 often indicate trending conditions, while values below 20 suggest ranging markets.
Moving Average Relationships: In trend days, price stays consistently above or below key moving averages. In ranging days, price oscillates around moving averages.
Bollinger Bands: Trend days often see price riding the upper or lower band, while ranging days show price bouncing between the bands.
:::key-concept The first two hours of trading often provide the clearest indication of whether the day will trend or range. This "opening drive" period sets the tone for the entire session. :::
Time-Based Analysis
Morning Patterns: Trend days often establish their character within the first 30-90 minutes. Ranging days may show early volatility that settles into horizontal movement.
Lunch Hour Behavior: Trend days may pause during lunch but typically resume their direction. Ranging days often remain choppy throughout the lunch period.
Closing Patterns: Trend days frequently show acceleration into the close, while ranging days may break out of their range in the final hour.
Trading Strategies for Each Market Condition
The key to successful trading lies in matching your strategy to the market condition. What works brilliantly on a trend day can be disastrous on a ranging day, making this distinction crucial for consistent profitability.
Trend Day Trading Strategies
Breakout Trading: Look for breaks above resistance or below support levels, especially when accompanied by increased volume. Enter positions in the direction of the breakout with stops below the breakout level.
Pullback Entries: During trend days, wait for minor pullbacks to key support/resistance levels or moving averages before entering in the trending direction.
Momentum Following: Use momentum indicators like RSI or MACD to identify continuation patterns. On trend days, traditional "overbought" or "oversold" readings often don't result in reversals.
:::example On an uptrend day, wait for price to pull back to the 20-period moving average. If the moving average provides support and volume decreases during the pullback, enter long with a stop below the moving average. Target the previous high or measured move projection. :::
Position Sizing for Trend Days: Consider larger position sizes due to higher probability of success, but always maintain proper risk management. The sustained nature of trend days often allows for wider stops and larger targets.
Ranging Day Trading Strategies
Range Trading: Buy near support and sell near resistance. This classic approach works well but requires discipline to exit if the range breaks.
Fade Strategy: Look for failed breakouts and trade back into the range. This can be highly profitable but requires quick execution and tight stops.
Scalping Approach: Take smaller, quicker profits by trading the oscillations within the range. Use shorter timeframes and tighter profit targets.
:::warning Never try to fade a strong trend day thinking it will become a ranging day. Wait for clear signs of range development before switching strategies. :::
Mean Reversion Techniques: Use oscillators like RSI, Stochastic, or Williams %R to identify overbought/oversold conditions within the range.
Strategy Selection Matrix
| Market Condition | Primary Strategy | Risk Management | Profit Targets | |------------------|------------------|-----------------|----------------| | Strong Trend Day | Breakout/Momentum | Wider stops | Extended targets | | Weak Trend Day | Pullback entries | Medium stops | Measured moves | | Tight Range | Scalping | Very tight stops | Quick profits | | Wide Range | Range trading | Stop outside range | Range extremes |
Volume and Market Structure Analysis
Volume provides crucial confirmation when determining whether you're experiencing a trend day vs ranging day. Understanding volume patterns helps validate your market structure analysis and improve trade timing.
Volume Analysis for Trend Days
Expansion Patterns: True trend days show expanding volume on moves in the trending direction and contracting volume on pullbacks. This pattern indicates institutional participation and validates the trend.
Volume Spikes: Look for volume spikes at key breakout levels or when price moves through significant technical levels. These spikes often mark the beginning of strong trend days.
Cumulative Volume: Monitor cumulative volume throughout the day. On trend days, you'll typically see steady accumulation of volume in the trending direction.
:::tip Use volume-weighted average price (VWAP) as a dynamic support/resistance level on trend days. Institutional traders often use VWAP for their execution decisions. :::
Volume Analysis for Ranging Days
Balanced Distribution: Ranging days typically show relatively balanced volume between up and down moves, indicating equilibrium between buyers and sellers.
Low Volume Breakouts: False breakouts from ranges often occur on low volume, making them easier to identify and fade.
Volume Dry-Up: As ranges mature, volume often decreases, creating coiled spring conditions that may precede significant breakouts.
Market Structure Elements
Order Flow Analysis: On trend days, market orders dominate in the trending direction. On ranging days, limit orders at range extremes create support and resistance.
Bid-Ask Spread Behavior: Trend days often show widening spreads during volatile moves, while ranging days maintain more consistent spreads.
Time and Sales Data: Examine the size and frequency of trades. Trend days often show larger block trades in the trending direction.
:::key-concept Institutional order flow is often the driving force behind trend days. Retail traders can benefit by identifying these patterns and aligning their trades with institutional direction. :::
Common Mistakes and How to Avoid Them
Even experienced traders can struggle with correctly identifying and trading different market conditions. Understanding these common mistakes can save you significant losses and improve your overall performance.
Trend Day Mistakes
Fighting the Trend: The biggest mistake on trend days is trying to fade or counter-trend trade. Many traders see "overbought" indicators and attempt to short an uptrend, often resulting in significant losses.
Solution: Accept that traditional oscillators may remain extended during trend days. Focus on trend-following strategies and wait for clear reversal signals.
Taking Profits Too Early: Trend days can move much further than expected, and many traders exit profitable positions prematurely.
Solution: Use trailing stops or take partial profits while letting runners continue. Scale out of positions rather than exiting entirely.
Ignoring Volume Confirmation: Entering breakouts without volume confirmation often leads to false signals.
Solution: Always wait for volume expansion to confirm breakout validity. No volume, no trade.
:::warning Never assume a trend day will reverse simply because it's moved a certain distance. Trend days can continue much longer and further than logic suggests. :::
Ranging Day Mistakes
Chasing False Breakouts: The most common ranging day mistake is chasing breakouts that quickly reverse back into the range.
Solution: Wait for volume confirmation and follow-through before entering breakout trades. Consider fading early breakouts instead.
Overtrading the Chop: The multiple reversals in ranging days can tempt traders to overtrade, leading to death by a thousand cuts.
Solution: Be selective with entries and exits. Focus on high-probability setups at range extremes.
Using Wide Stops: Applying trend day stop distances to range trading often results in unnecessarily large losses.
Solution: Use tighter stops appropriate for the range size. If the range breaks, accept the small loss and reassess.
Universal Mistakes
Late Day Type Recognition: Failing to identify the day type early often leads to strategy mismatches throughout the session.
Solution: Develop a morning routine to assess market conditions within the first hour. Be prepared to adjust strategies as conditions become clear.
Strategy Stubbornness: Refusing to adapt strategies when market conditions change during the day.
Solution: Stay flexible and be willing to switch approaches if the market character changes. What starts as a ranging day can become a trend day.
:::example A trader enters the day expecting range conditions based on overnight action. However, strong economic news creates a gap and sustained trending behavior. The successful trader recognizes this change and switches to trend-following strategies rather than continuing to fight the new condition. :::
Conclusion
Mastering the distinction between trend day vs ranging day patterns is fundamental to trading success. Each market condition requires specific strategies, risk management approaches, and psychological preparation. Trend days reward patience and trend-following behavior, while ranging days favor nimble traders who can capitalize on oscillations within defined boundaries.
The key insights to remember:
- Early identification is crucial - the first two hours often reveal the day's character
- Volume confirmation helps validate your market structure analysis
- Strategy flexibility allows you to adapt as conditions change
- Risk management must adjust to match the market condition
- Patience prevents overtrading and improves trade selection
Successful traders don't try to impose their preferred strategy on the market. Instead, they read market conditions objectively and select appropriate tactics. Whether facing the sustained directional movement of a trend day or the oscillating nature of a ranging day, your ability to recognize and adapt to these conditions will significantly impact your trading results.
Remember that no market condition lasts forever. Trend days eventually exhaust themselves and transition to ranging conditions, while ranges eventually break out into new trends. By understanding both patterns thoroughly, you'll be prepared for whatever the market presents.
Ready to improve your market structure analysis? Start by reviewing your recent trades and identifying which occurred on trend days versus ranging days. Practice recognizing the early warning signs we've discussed, and gradually build your ability to quickly assess market conditions. With consistent practice and application of these concepts, you'll develop the intuitive feel necessary to trade each market condition profitably.