# Volume Spread Analysis for Beginners: Master VSA Trading Fundamentals
Volume Spread Analysis (VSA) is one of the most powerful yet underutilized trading methodologies that reveals the true intentions of professional traders and market makers. By understanding the relationship between volume, price spread, and closing price, traders can decode market dynamics and make more informed trading decisions.
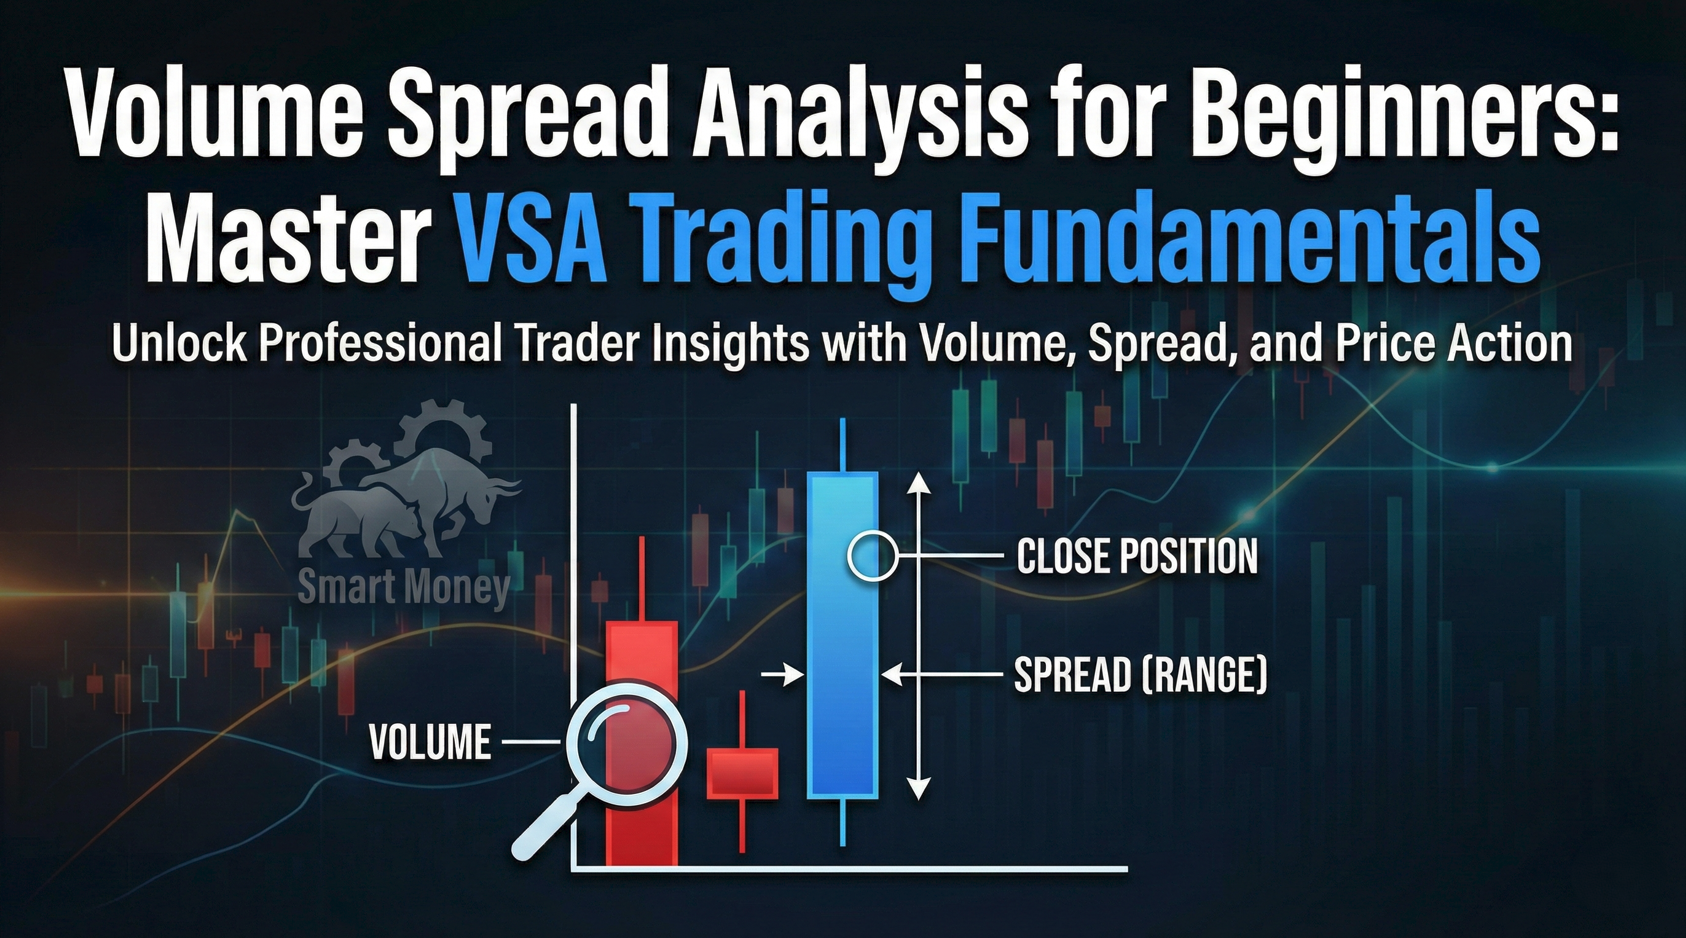
:::key-concept Volume Spread Analysis examines three key elements: the volume of transactions, the spread (range) of the price bar, and where the price closes within that range. This combination reveals whether smart money is buying, selling, or absent from the market. :::
This comprehensive guide will take you through everything you need to know about volume spread analysis for beginners, from basic concepts to practical application strategies.
Table of Contents
- [What is Volume Spread Analysis](#what-is-volume-spread-analysis)
- [The Three Pillars of VSA](#the-three-pillars-of-vsa)
- [Key VSA Principles and Market Laws](#key-vsa-principles-and-market-laws)
- [Essential VSA Patterns Every Beginner Should Know](#essential-vsa-patterns-every-beginner-should-know)
- [How to Apply VSA in Your Trading](#how-to-apply-vsa-in-your-trading)
- [Common VSA Mistakes and How to Avoid Them](#common-vsa-mistakes-and-how-to-avoid-them)
- [Conclusion](#conclusion)
What is Volume Spread Analysis
Volume Spread Analysis was developed by Tom Williams, who studied under Jesse Livermore and learned from professional traders with direct market experience. VSA is based on the premise that all price movements are the result of supply and demand imbalances, and these imbalances are revealed through the analysis of volume and price action.
:::example Imagine you're at an auction house. When a valuable item comes up for bidding, you notice increased activity (volume), wider bidding ranges (spread), and where the final hammer price falls. VSA applies this same logic to financial markets, helping traders understand whether smart money is accumulating or distributing positions. :::
Unlike traditional technical analysis that focuses primarily on price patterns, volume spread analysis for beginners emphasizes the importance of volume as the driving force behind all price movements. This approach helps traders:
- Identify when professional money is active in the market
- Recognize accumulation and distribution phases
- Spot potential turning points before they become obvious
- Avoid false breakouts and breakdowns
- Time entries and exits more effectively
Why VSA Works
The effectiveness of VSA stems from understanding that markets are controlled by professional traders, institutions, and market makers who have significantly more capital than retail traders. These "smart money" participants leave footprints in the form of volume and price action that can be analyzed and interpreted.
The Three Pillars of VSA
Successful volume spread analysis for beginners relies on understanding three fundamental elements that work together to reveal market sentiment:
1. Volume
Volume represents the amount of buying and selling activity during a specific time period. In VSA, volume is classified as:
- High Volume: Significantly above average, indicating professional interest
- Average Volume: Normal trading activity with mixed participation
- Low Volume: Below average, suggesting lack of professional interest
:::tip Use a 10-period moving average of volume as a baseline to determine whether current volume is high, average, or low relative to recent market activity. :::
2. Spread (Range)
The spread refers to the difference between the high and low prices of a bar or candle. Spreads can be:
- Wide Spread: Large difference between high and low, showing significant price movement
- Narrow Spread: Small difference, indicating limited price movement
- Average Spread: Normal range relative to recent market activity
3. Close Position
The closing price's position within the bar's range reveals whether buyers or sellers were in control:
- Close High: Price closes in the upper portion of the range (bullish)
- Close Mid: Price closes near the middle of the range (neutral)
- Close Low: Price closes in the lower portion of the range (bearish)
:::key-concept The combination of these three elements creates the "story" of what happened during that time period. High volume with a wide spread closing high suggests strong buying pressure, while high volume with a narrow spread might indicate absorption of supply or demand. :::
Key VSA Principles and Market Laws
Volume spread analysis for beginners is built on several fundamental principles that govern market behavior:
The Law of Supply and Demand
This is the foundation of all VSA analysis. When demand exceeds supply, prices rise. When supply exceeds demand, prices fall. The key is identifying when this balance is shifting.
The Law of Effort vs. Result
Effort is represented by volume, while result is represented by the price spread. When effort and result are in harmony, the trend is likely to continue. When they diverge, it signals potential weakness.
:::example If you see high volume (high effort) but only a narrow spread (poor result), this suggests that one side is absorbing the other's pressure, often indicating a potential reversal. :::
The Law of Cause and Effect
Before any significant price movement (effect), there must be a period of accumulation or distribution (cause). VSA helps identify these cause phases through volume and price action analysis.
Background vs. Climactic Action
Most market activity is "background" - normal trading without significant professional participation. However, climactic action occurs when professionals are actively involved, creating distinct volume and price signatures.
Essential VSA Patterns Every Beginner Should Know
Now let's explore the most important VSA patterns that form the foundation of volume spread analysis for beginners:
1. Buying Climax
A buying climax occurs after an uptrend when you see:
- Very high volume
- Wide spread
- Close in the middle to low of the range
This pattern suggests that supply has entered the market to meet the demand, often marking a temporary or permanent top.
2. Selling Climax
A selling climax appears after a downtrend with:
- Very high volume
- Wide spread
- Close in the middle to high of the range
This indicates that demand has entered to absorb the supply, potentially marking a bottom.
3. Test for Supply/Demand
After a climax, markets often test to see if supply or demand is still present:
- Lower volume than the climax
- Narrow spread
- Price reaching or slightly exceeding previous levels
A successful test shows that supply/demand has been removed.
:::warning Beware of failed tests where volume increases significantly or the spread widens. This suggests that supply or demand is still present and the market may continue in the original direction. :::
4. No Demand/No Supply
These are continuation patterns showing:
No Demand (in uptrends):
- Low volume
- Narrow spread
- Close low in the range
- Indicates lack of buying interest
No Supply (in downtrends):
- Low volume
- Narrow spread
- Close high in the range
- Shows absence of selling pressure
5. Strength/Weakness Patterns
Strength:
- High volume
- Wide spread
- Close high
- Indicates professional buying
Weakness:
- High volume
- Wide spread
- Close low
- Shows professional selling
How to Apply VSA in Your Trading
Implementing volume spread analysis for beginners requires a systematic approach:
Step 1: Set Up Your Charts
1. Choose appropriate timeframes (daily charts are ideal for beginners) 2. Add volume indicators below your price chart 3. Calculate a 10-period moving average of volume for reference 4. Ensure you can clearly see the high, low, open, and close of each bar
Step 2: Analyze Market Context
Before analyzing individual bars, understand:
- The overall trend direction
- Recent significant highs and lows
- Areas of potential support and resistance
- The general market phase (trending, ranging, or transitioning)
Step 3: Apply the VSA Framework
For each significant bar, ask: 1. Is the volume high, average, or low? 2. Is the spread wide, average, or narrow? 3. Where did the price close within the range? 4. What story does this combination tell?
:::tip Start by focusing on bars with unusual volume - either very high or very low compared to recent averages. These bars often contain the most valuable information. :::
Step 4: Look for Confirmation
VSA works best when patterns are confirmed by:
- Subsequent price action
- Multiple VSA signals pointing in the same direction
- Support/resistance levels
- Market structure analysis
Step 5: Plan Your Trades
Use VSA to:
- Identify potential entry points after tests or strength/weakness
- Set stop losses beyond key VSA levels
- Determine profit targets based on previous climaxes or tests
- Manage positions based on ongoing VSA signals
Trading Example Walkthrough
Let's walk through a practical example:
:::example Scenario: You're analyzing a stock that's been in an uptrend. You notice a bar with:
- Very high volume (3x average)
- Wide spread
- Close in the lower 25% of the range
Analysis: This suggests a buying climax - supply has entered to meet the demand.
Action Plan: 1. Wait for a test (lower volume, narrow spread, price reaching similar levels) 2. If the test is successful (low volume), look for buying opportunities 3. If the test fails (high volume returns), prepare for potential trend reversal :::
Common VSA Mistakes and How to Avoid Them
As you begin your journey with volume spread analysis for beginners, avoid these common pitfalls:
Mistake 1: Over-Analyzing Every Bar
Problem: Trying to find VSA signals in every price bar.
Solution: Focus only on bars with unusual characteristics - very high or very low volume, unusually wide or narrow spreads, or significant price levels.
Mistake 2: Ignoring Market Context
Problem: Analyzing VSA patterns in isolation without considering the overall market trend and structure.
Solution: Always assess VSA signals within the broader market context, including trend direction, key support/resistance levels, and market phase.
Mistake 3: Acting on Single Signals
Problem: Making trading decisions based on one VSA bar without waiting for confirmation.
Solution: Look for multiple confirming signals and subsequent price action before entering trades.
:::warning VSA is not infallible. Like all analysis methods, it should be combined with proper risk management and position sizing strategies. :::
Mistake 4: Misunderstanding Volume Data
Problem: Not accounting for different volume characteristics across markets (stocks vs. forex vs. futures).
Solution: Understand how volume is calculated and reported in your chosen market, and adjust your analysis accordingly.
Mistake 5: Expecting Immediate Results
Problem: Becoming discouraged when VSA signals don't immediately produce profits.
Solution: Remember that VSA often identifies potential turning points that may take time to develop. Be patient and focus on the probability of success over multiple trades.
Building Your VSA Skills
To become proficient in volume spread analysis for beginners:
1. Practice Daily: Spend 15-30 minutes daily analyzing charts with VSA principles 2. Keep a Trading Journal: Document VSA patterns you identify and their outcomes 3. Study Multiple Markets: Different markets may show VSA patterns differently 4. Focus on Major Patterns First: Master the basic climax and test patterns before moving to advanced concepts 5. Combine with Price Action: VSA works best when combined with support/resistance and market structure analysis
:::tip Start with daily charts and major market indices or liquid stocks. These provide cleaner VSA signals and are more reliable for beginners to practice on. :::
Conclusion
Volume spread analysis for beginners provides a powerful framework for understanding market dynamics by revealing the actions of professional traders and institutions. By focusing on the relationship between volume, price spread, and closing position, traders can identify accumulation and distribution phases, spot potential turning points, and make more informed trading decisions.
The key to success with VSA lies in understanding that it's not about predicting exact price movements, but rather about identifying areas of high probability where smart money is active. Combined with proper risk management and market structure analysis, VSA can significantly improve your trading edge.
Remember that mastering volume spread analysis for beginners takes time and practice. Start with the basic patterns - buying climaxes, selling climaxes, tests, and strength/weakness bars. Focus on understanding the story that volume and price action tell together, rather than trying to memorize complex pattern combinations.
As you develop your VSA skills, you'll begin to see markets differently. Instead of random price movements, you'll recognize the footprints of professional money and understand when they're accumulating, distributing, or absent from the market.
Ready to put your volume spread analysis knowledge into practice? Start by reviewing historical charts of your favorite trading instruments, identifying the VSA patterns discussed in this guide, and documenting your observations. The more you practice, the more natural this powerful analysis method will become in your trading toolkit.