# VSA for Swing Trading: A Long-Term Perspective on Volume Spread Analysis
Volume Spread Analysis (VSA) is a powerful methodology that examines the relationship between volume, price spread, and closing price to understand market dynamics. While many traders apply VSA to shorter timeframes, its principles become even more potent when adapted for swing trading strategies. This comprehensive guide explores how to effectively use VSA for swing trading, providing you with a long-term perspective that can significantly improve your trading results.
:::key-concept VSA for swing trading focuses on identifying major accumulation and distribution phases that unfold over days to weeks, rather than minutes or hours. This longer-term approach allows traders to capture more substantial price movements while reducing market noise. :::
Table of Contents
- [Understanding VSA Fundamentals for Swing Trading](#understanding-vsa-fundamentals-for-swing-trading)
- [Key VSA Patterns for Long-Term Analysis](#key-vsa-patterns-for-long-term-analysis)
- [Timeframe Selection and Chart Analysis](#timeframe-selection-and-chart-analysis)
- [Building a VSA-Based Swing Trading System](#building-a-vsa-based-swing-trading-system)
- [Risk Management in VSA Swing Trading](#risk-management-in-vsa-swing-trading)
- [Conclusion](#conclusion)
Understanding VSA Fundamentals for Swing Trading
Volume Spread Analysis operates on the principle that professional money (smart money) leaves footprints in the market through volume and price action patterns. When applying VSA for swing trading, we focus on identifying these footprints over extended periods, allowing us to position ourselves alongside institutional traders.
The Three Core Elements
Volume: The fuel behind price movements. In swing trading, we examine volume patterns over multiple days to identify accumulation or distribution phases.
Spread (Range): The distance between high and low prices within a given period. Wider spreads often indicate professional interest, while narrow spreads may suggest lack of institutional participation.
Closing Price: Where the market closes within the day's range reveals the balance of power between buyers and sellers.
:::example Consider a stock that shows increasing volume over three consecutive days while the price spread narrows and closes consistently in the upper portion of each day's range. This pattern suggests accumulation, making it an attractive swing trading candidate for a long position. :::
Professional vs. Retail Activity
Swing traders using VSA must distinguish between professional and retail activity. Professional money typically:
- Creates significant volume spikes during accumulation or distribution
- Operates during specific market phases
- Leaves consistent patterns across multiple timeframes
Retail activity often shows:
- Random volume patterns
- Emotional responses to news events
- Inconsistent follow-through
Key VSA Patterns for Long-Term Analysis
When implementing VSA for swing trading, certain patterns become particularly significant due to their reliability over extended timeframes.
Accumulation Patterns
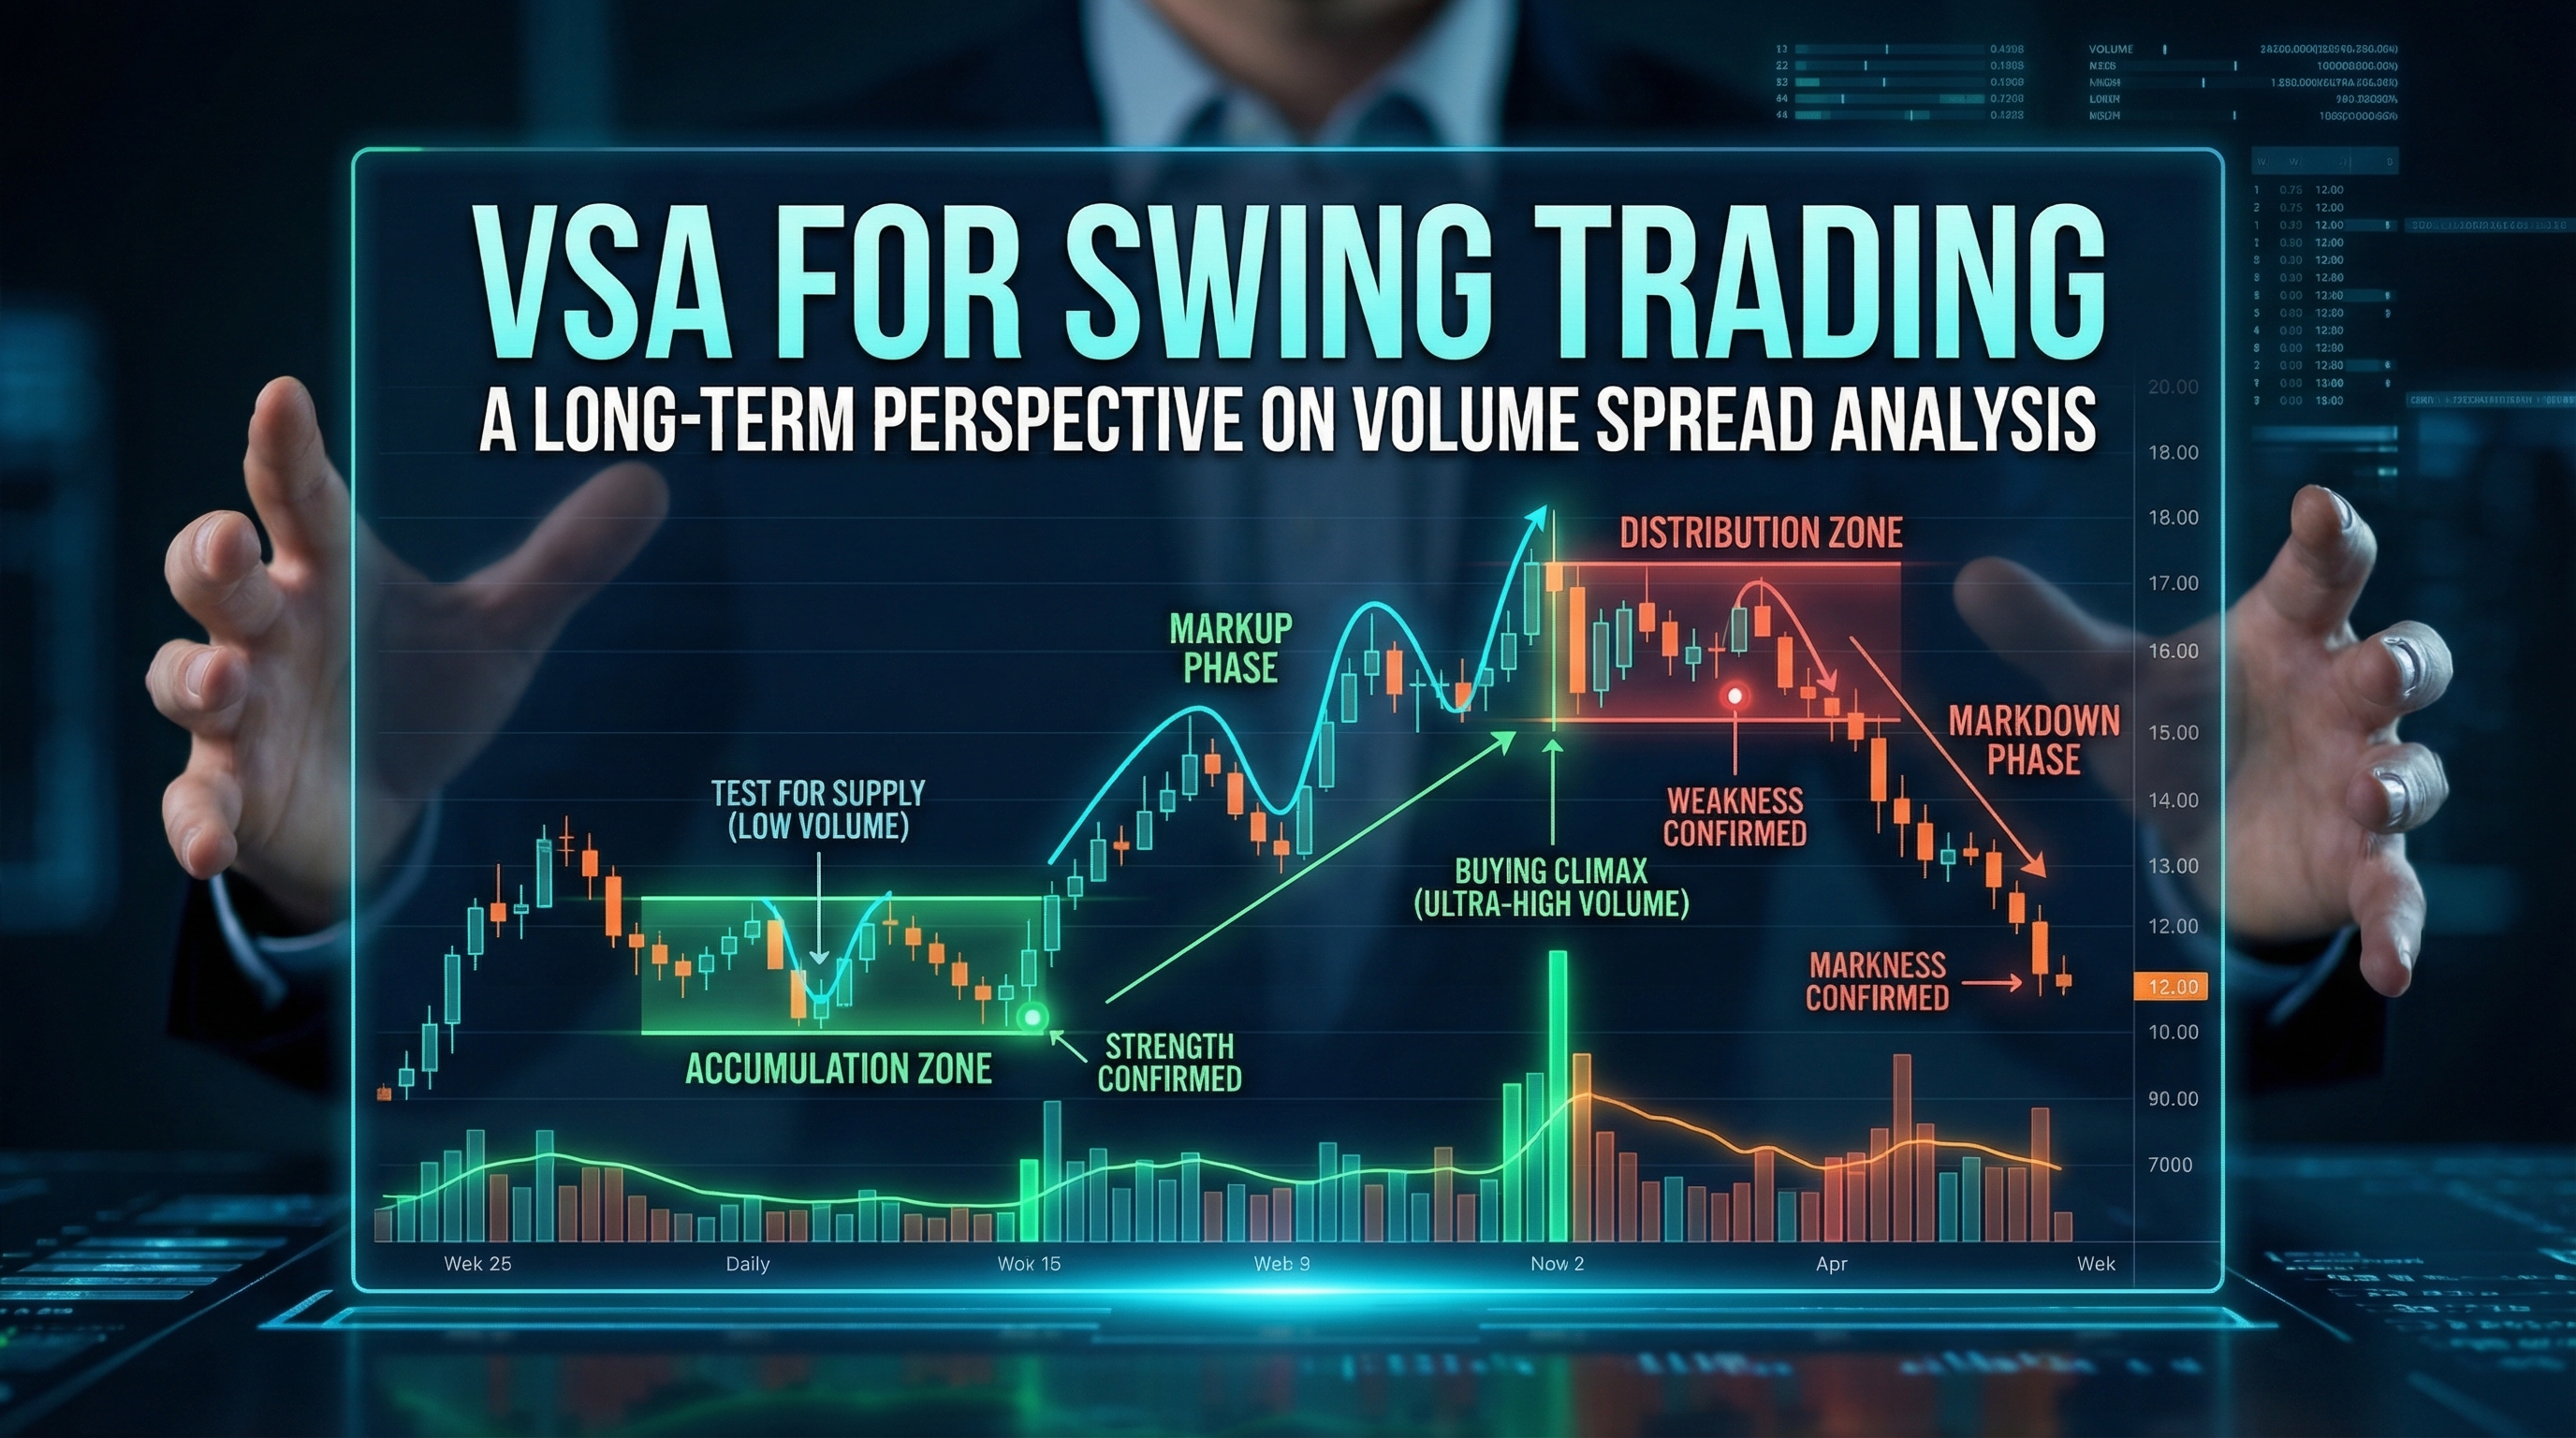
Test for Supply This pattern occurs when price attempts to move lower on reduced volume compared to previous down moves. The inability to continue declining with less selling pressure suggests supply has been absorbed.
No Demand Characterized by narrow spreads, low volume, and closes in the middle to lower portion of the range. This pattern often appears after significant markup phases and warns of potential weakness.
:::warning No Demand bars in uptrends should be treated with caution. While they don't immediately signal trend reversal, they indicate reduced buying interest and potential distribution beginning. :::
Distribution Patterns
Buying Climax A wide spread up-bar with very high volume that closes in the middle to lower portion of its range. This pattern suggests professional selling into retail buying enthusiasm.
Test for Demand Similar to Test for Supply but in reverse. Price attempts to rally on reduced volume, indicating lack of genuine demand and potential for further decline.
Confirmation Patterns
Strength Showing Narrow spread bars with good volume that close near their highs indicate underlying strength. In swing trading, these patterns confirm the validity of accumulation phases.
Weakness Showing The opposite of Strength Showing - narrow spreads with good volume closing near lows, confirming distribution phases.
:::tip Look for clusters of similar VSA patterns rather than isolated occurrences. Three or more consecutive Test for Supply bars provide stronger evidence of accumulation than a single instance. :::
Timeframe Selection and Chart Analysis
Effective VSA for swing trading requires careful timeframe selection to capture the full picture of institutional activity while filtering out short-term noise.
Primary Analysis Timeframe
Daily Charts: The cornerstone of VSA swing trading analysis. Daily bars provide sufficient data to identify professional activity while smoothing out intraday volatility.
Weekly Charts: Used for higher-level context and identifying major accumulation or distribution campaigns spanning months.
Supporting Timeframes
4-Hour Charts: Helpful for timing entries and exits within the broader daily trend identified through VSA analysis.
Weekly and Monthly: Provide macro context for understanding where current price action fits within longer-term market cycles.
Volume Analysis Considerations
When analyzing volume for swing trading:
- Compare current volume to the 20-period moving average
- Look for volume expansion during key reversal points
- Pay attention to volume contraction during consolidation phases
- Consider relative volume rather than absolute numbers
:::key-concept Volume should be analyzed in context. High volume during a decline after significant markup often indicates distribution, while high volume during a decline after a major selloff may indicate accumulation. :::
Chart Preparation
For effective VSA analysis:
1. Remove unnecessary indicators - VSA relies primarily on price and volume 2. Use adequate chart history - At least 6 months of data for proper context 3. Mark significant VSA patterns - Create a visual record of key accumulation and distribution zones 4. Note volume characteristics - Identify average volume levels for comparison
Building a VSA-Based Swing Trading System
Constructing a systematic approach to VSA for swing trading involves combining pattern recognition with proper trade management techniques.
Entry Criteria
Long Positions: 1. Identify accumulation zone through multiple VSA patterns 2. Wait for Test for Supply or similar strength indication 3. Confirm with volume expansion on breakout above resistance 4. Enter on pullback to former resistance (now support)
Short Positions: 1. Identify distribution zone through VSA analysis 2. Look for Test for Demand or weakness confirmation 3. Wait for volume expansion on breakdown below support 4. Enter on rally back to former support (now resistance)
:::example A technology stock shows three consecutive days of Test for Supply patterns at a key support level. Volume decreases with each test, suggesting supply absorption. When price breaks above the recent high with expanding volume, it confirms accumulation completion and provides a swing trading entry opportunity. :::
Position Sizing
VSA swing trading allows for larger position sizes due to:
- Higher probability setups based on institutional activity
- Clearer stop-loss placement below/above VSA-identified zones
- Better risk-to-reward ratios from capturing longer-term moves
Recommended Position Sizing:
- Risk 1-2% of account per trade
- Use VSA zones to determine stop-loss placement
- Target risk-to-reward ratios of 1:3 or better
Trade Management
Stop Loss Placement:
- Below the lowest point of accumulation zone for long positions
- Above the highest point of distribution zone for short positions
- Allow sufficient room for normal market volatility
Profit Targets:
- Previous significant highs/lows
- Measured moves based on accumulation/distribution zones
- VSA-identified resistance/support levels
Partial Profits:
- Take 25-50% profits at first target
- Move stop to breakeven after first target hit
- Trail remaining position using VSA patterns
Risk Management in VSA Swing Trading
While VSA provides high-probability setups, proper risk management remains crucial for long-term success.
Portfolio Considerations
Diversification:
- Limit exposure to any single market or sector
- Avoid overconcentration in correlated positions
- Consider market cap and liquidity when position sizing
Correlation Analysis:
- Monitor relationships between positions
- Reduce position sizes when high correlation exists
- Use VSA across different asset classes for true diversification
Market Environment Assessment
Bull Markets:
- Focus on accumulation patterns and long positions
- Be cautious of distribution patterns in individual stocks
- Allow for wider stops due to general upward bias
Bear Markets:
- Emphasize distribution patterns and short opportunities
- Look for accumulation only in oversold conditions
- Tighten risk management parameters
Sideways Markets:
- Trade both directions based on VSA patterns
- Shorter-term targets due to lack of trending bias
- Higher selectivity in trade selection
:::warning Never ignore broader market context when applying VSA for swing trading. Even the strongest individual accumulation patterns can fail in severe bear markets, while distribution patterns may be overcome in powerful bull markets. :::
Psychology and Discipline
Patience Requirements: VSA swing trading demands patience to wait for proper setups. This means:
- Accepting periods without trades
- Avoiding forcing trades in unclear market conditions
- Trusting the process over extended periods
Emotional Management:
- VSA patterns don't guarantee immediate success
- Some trades may take weeks to develop
- Maintain discipline during drawdown periods
Conclusion
VSA for swing trading offers a sophisticated approach to market analysis that aligns traders with institutional money flow. By focusing on the relationship between volume, spread, and closing prices over extended timeframes, traders can identify high-probability opportunities that unfold over days to weeks rather than minutes to hours.
The key to successful implementation lies in:
- Proper pattern recognition - Understanding how VSA patterns manifest in different market conditions
- Timeframe selection - Using daily charts as the primary analysis tool while incorporating weekly context
- Systematic approach - Developing clear entry, exit, and risk management rules based on VSA principles
- Patience and discipline - Waiting for high-quality setups and managing trades according to predetermined rules
Remember that VSA is not a magic formula but rather a framework for understanding market dynamics. Success comes from consistent application of these principles combined with proper risk management and realistic expectations.
The long-term perspective inherent in swing trading naturally complements VSA methodology, as both focus on identifying and capitalizing on significant market moves driven by institutional activity. By mastering these concepts, traders can develop a robust approach that captures substantial price movements while maintaining manageable risk levels.
Start by practicing VSA pattern recognition on historical charts, focusing on major accumulation and distribution phases. As your pattern recognition skills develop, gradually implement these concepts in live trading with small position sizes until you gain confidence in the methodology. The investment in learning VSA for swing trading can provide dividends for years to come, offering a sustainable approach to capturing market opportunities driven by professional money flow.