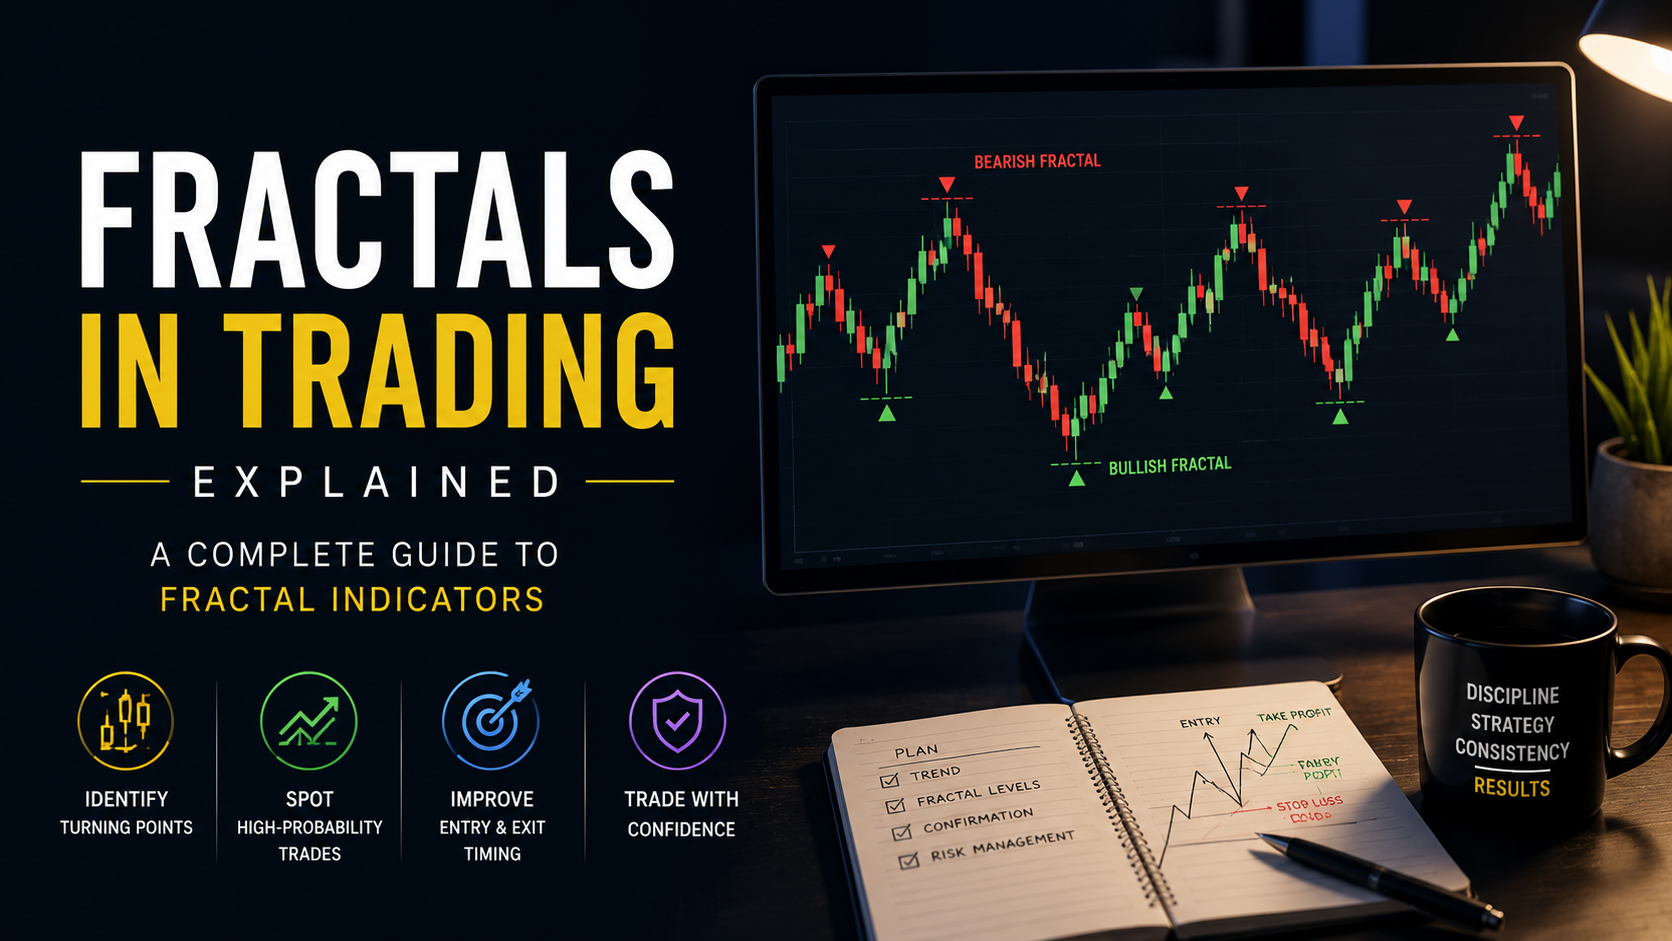
Fractal patterns represent one of the most fascinating concepts in technical analysis, offering traders a systematic way to identify potential market turning points. When you examine price charts closely, you'll notice that markets often create repetitive patterns at various time scales—this self-similar behavior forms the foundation of fractal analysis. Understanding fractals in trading explained properly can significantly enhance your ability to spot high-probability reversal zones and improve your entry and exit timing.
Originally introduced to the trading world by legendary trader Bill Williams, fractal indicators have become a staple tool for traders across all markets and timeframes. These geometric patterns appear naturally in price action, making them a universal language of market structure that works equally well in forex, stocks, cryptocurrencies, and commodities.
Table of Contents
- [What Are Fractals in Trading](#what-are-fractals-in-trading)
- [How Fractal Patterns Form](#how-fractal-patterns-form)
- [Trading Strategies Using Fractals](#trading-strategies-using-fractals)
- [Combining Fractals with Other Indicators](#combining-fractals-with-other-indicators)
- [Common Mistakes and Best Practices](#common-mistakes-and-best-practices)
- [Conclusion](#conclusion)
What Are Fractals in Trading
A fractal in trading is a specific five-candle pattern that signals potential market reversal points. The pattern consists of a central candle (the high or low point) surrounded by two candles on each side with progressively lower highs or higher lows. This simple yet powerful formation appears naturally across all timeframes and markets, providing traders with objective reference points for potential support and resistance levels.
:::key-concept Fractal Definition: A bullish fractal forms when a low is surrounded by two higher lows on each side. A bearish fractal forms when a high is surrounded by two lower highs on each side. These patterns indicate potential reversal zones where price may change direction. :::
The Two Types of Fractals
Bullish (Up) Fractals:
- Indicate potential support levels
- Form at local price bottoms
- Signal possible upward reversals
- The middle candle has the lowest low of the five-candle sequence
- The two candles on each side have progressively higher lows
Bearish (Down) Fractals:
- Indicate potential resistance levels
- Form at local price tops
- Signal possible downward reversals
- The middle candle has the highest high of the five-candle sequence
- The two candles on each side have progressively lower highs
Why Fractals Matter
Fractals represent crowd psychology at work. When a fractal forms, it shows a moment where buying or selling pressure reached a temporary extreme before reversing. These points often become significant reference levels that price respects in the future, as traders remember these turning points and react accordingly when price returns to these zones.
:::example Real-World Scenario: Imagine EUR/USD on a 4-hour chart forms a bearish fractal at 1.1050. This level represents a point where sellers overwhelmed buyers. Two weeks later, when price rallies back to 1.1050, traders who remember this rejection zone may place sell orders, creating resistance at this fractal level. :::
How Fractal Patterns Form
Understanding how fractals in trading explained through their formation process helps you recognize them in real-time and anticipate their development. The formation of a fractal requires patience, as you cannot confirm a fractal until all five candles have completed.
The Formation Process
1. Initial Movement: Price begins moving in one direction, creating momentum 2. Extreme Point: A high or low forms that represents a temporary extreme 3. First Reversal: The candle after the extreme moves in the opposite direction 4. Confirmation: The second candle continues in the reversal direction 5. Fractal Complete: The pattern is now confirmed and can be marked on your chart
:::warning Lagging Nature: Fractals are lagging indicators by design. You need two candles to form after the central candle before confirmation. This means the actual turning point occurred two candles ago. Always account for this delay when planning entries. :::
Reading Fractal Strength
Not all fractals carry equal weight. Several factors determine a fractal's significance:
Higher Timeframe Fractals: A fractal on a daily chart typically carries more weight than one on a 5-minute chart, as it represents a larger market consensus.
Distance from Previous Fractals: Fractals that form after extended moves tend to be more significant, as they represent exhaustion points after substantial price action.
Volume Confirmation: Fractals forming on high volume indicate stronger conviction and are more likely to hold when tested in the future.
Alignment with Market Structure: Fractals that align with major support/resistance zones, trend lines, or Fibonacci levels gain additional significance.
Fractal Density and Market Conditions
Different market conditions produce varying fractal densities:
- Trending Markets: Fewer, more spaced-out fractals appear in strong trends, with most forming in the direction of the trend
- Ranging Markets: Higher fractal density occurs in consolidation, with fractals appearing frequently at range boundaries
- Volatile Markets: Increased fractal formation as price whipsaws, though many may be false signals
- Low Volatility: Fewer fractals form during quiet periods, but those that do often mark significant levels
Trading Strategies Using Fractals
Fractals serve multiple purposes in a trading strategy. While they can generate standalone signals, their real power emerges when integrated into a comprehensive trading approach. Here are proven strategies that incorporate fractal analysis.
Strategy 1: Fractal Breakout System
This approach uses fractals as breakout levels, entering trades when price decisively breaks above a bearish fractal or below a bullish fractal.
Setup Requirements:
- Identify a clear fractal on your chosen timeframe
- Wait for price to approach the fractal level
- Monitor for a decisive break beyond the fractal high/low
- Enter on the break or on a retest of the broken level
Entry Rules:
- For long positions: Enter when price closes above the last bearish fractal high
- For short positions: Enter when price closes below the last bullish fractal low
- Use a buffer (3-5 pips in forex) to avoid false breakouts
Exit Rules:
- Set stop loss below the fractal low (for longs) or above the fractal high (for shorts)
- Target the next opposing fractal level as your take profit
- Trail stops using new fractals as they form in your favor
:::tip Professional Tip: Wait for a strong close beyond the fractal level, preferably with increased volume. A weak break that barely exceeds the fractal often leads to false signals and whipsaw losses. :::
Strategy 2: Fractal Support and Resistance Trading
This conservative approach treats fractals as support and resistance zones, entering trades when price bounces from these levels rather than breaks through them.
Identification Phase: 1. Mark all recent fractals on your chart (last 20-30 candles) 2. Identify which fractals align with multiple touches or key levels 3. Focus on fractals at swing highs and lows 4. Note the timeframe—higher timeframes provide stronger levels
Entry Techniques:
- Limit Orders: Place buy orders at bullish fractal levels and sell orders at bearish fractal levels
- Confirmation Entries: Wait for a reversal candlestick pattern (pin bar, engulfing) at the fractal level before entering
- Breakout Failure: Enter when price attempts to break a fractal but fails and reverses
Risk Management:
- Position stop loss 5-10 pips beyond the fractal level
- Use a minimum 1:2 risk-reward ratio
- Consider the distance to the next fractal when setting targets
Strategy 3: Multiple Timeframe Fractal Analysis
This advanced technique combines fractals from different timeframes to identify high-probability setups with optimal entry timing.
Process: 1. Higher Timeframe (Daily/4H): Identify the dominant trend and major fractal levels 2. Mid Timeframe (1H/30M): Locate fractals that align with the higher timeframe direction 3. Lower Timeframe (15M/5M): Use for precise entry timing near mid-timeframe fractals
Example Setup:
- Daily chart shows an uptrend with a bullish fractal at a key support level
- 1-hour chart forms a bullish fractal at the same zone, confirming support
- 15-minute chart creates a bullish fractal, providing entry signal
- Enter long on the 15-minute fractal break, with stops below the daily fractal
:::example Complete Trade Example: On GBP/USD, the daily chart shows a strong uptrend with a bullish fractal at 1.2650. Price retraces to this level, and a 1-hour bullish fractal forms at 1.2655. When the 15-minute chart creates a bullish fractal at 1.2660 and price breaks above it, you enter long at 1.2665. Your stop sits at 1.2640 (below the daily fractal), risking 25 pips. Your target is the next daily bearish fractal at 1.2750, giving you a potential 85-pip gain and a 3.4:1 risk-reward ratio. :::
Strategy 4: Fractal Trend Following
Use fractals to trade in the direction of the dominant trend, entering only when fractals align with the prevailing market direction.
Trend Identification:
- Uptrend: Series of higher highs and higher lows, with bullish fractals forming at higher levels
- Downtrend: Series of lower highs and lower lows, with bearish fractals forming at lower levels
Trading Rules:
- In uptrends: Only trade breaks of bearish fractals to the upside
- In downtrends: Only trade breaks of bullish fractals to the downside
- Ignore counter-trend fractal breaks
- Use fractals in the trend direction as trailing stop levels
Combining Fractals with Other Indicators
While fractals provide valuable signals independently, their effectiveness multiplies when combined with complementary technical tools. Here's how to integrate fractals in trading explained through popular indicator combinations.
Fractals and Alligator Indicator
Bill Williams, who introduced fractals, designed them to work harmoniously with his Alligator indicator (a combination of three smoothed moving averages).
The Alligator Consists Of:
- Jaw (Blue Line): 13-period smoothed moving average, shifted 8 bars forward
- Teeth (Red Line): 8-period smoothed moving average, shifted 5 bars forward
- Lips (Green Line): 5-period smoothed moving average, shifted 3 bars forward
Combined Strategy:
- Alligator Sleeping (Lines Intertwined): Avoid trading fractals; market is ranging
- Alligator Awakening (Lines Separating): Prepare for trades as trend develops
- Alligator Eating (Lines Wide Apart): Trade fractal breaks in the direction of the Alligator's mouth
- Entry Signal: Buy fractal break when price is above the Alligator; sell fractal break when below
:::tip Synergy Insight: The Alligator filters market conditions, telling you WHEN to trade fractals, while fractals tell you WHERE to enter. This combination significantly reduces false signals during choppy, directionless markets. :::
Fractals and Moving Averages
Simple or exponential moving averages complement fractals by providing trend direction and dynamic support/resistance.
Effective Combinations:
- 50-period and 200-period EMAs: Use for long-term trend direction
- 20-period EMA: Use for intermediate trend and dynamic support/resistance
- Trade fractal breaks only in the direction of the moving average slope
- Use MA crossovers to confirm fractal signals
Application:
- When price is above the 200 EMA, focus on buying fractal breakouts
- When price is below the 200 EMA, focus on selling fractal breakdowns
- Fractals forming near moving averages carry additional weight
Fractals and Fibonacci Retracements
Fractals often form at or near Fibonacci retracement levels, creating powerful confluence zones.
Setup Process: 1. Identify a significant price swing using fractals at both ends 2. Draw Fibonacci retracement from the swing low fractal to swing high fractal 3. Watch for new fractals forming at key Fibonacci levels (38.2%, 50%, 61.8%) 4. Enter when price breaks the fractal that formed at a Fibonacci level
Confluence Signals:
- Fractal + 61.8% Fibonacci = High-probability reversal zone
- Multiple fractals clustered near Fibonacci level = Strong support/resistance
- Fractal break at Fibonacci level = Powerful continuation signal
Fractals and Volume Analysis
Volume adds context to fractal formations, helping you distinguish between strong and weak fractals.
Volume Patterns to Watch:
- High Volume at Fractal: Indicates strong conviction; fractal level likely to hold
- Low Volume at Fractal: Suggests weak formation; more likely to break easily
- Volume Spike on Fractal Break: Confirms genuine breakout; follow-through expected
- Low Volume on Break: Warning sign of false breakout; exercise caution
:::warning Critical Distinction: A fractal forming on climactic volume often marks a significant turning point, while fractals on declining volume may simply be noise in a continuation pattern. Always check volume before acting on fractal signals. :::
Fractals and RSI (Relative Strength Index)
The RSI helps identify overbought/oversold conditions, adding another layer of confirmation to fractal signals.
Combined Approach:
- Bearish fractals forming with RSI above 70: Strong sell signal (overbought reversal)
- Bullish fractals forming with RSI below 30: Strong buy signal (oversold reversal)
- Fractal breaks with RSI divergence: Extremely high-probability setups
- Avoid fractal trades when RSI contradicts the signal
Divergence Strategy:
- Price makes a higher high with a bearish fractal, but RSI makes a lower high = Bearish divergence; strong sell signal
- Price makes a lower low with a bullish fractal, but RSI makes a higher low = Bullish divergence; strong buy signal
Common Mistakes and Best Practices
Understanding fractals in trading explained through common pitfalls helps you avoid costly errors and develop a professional approach to fractal analysis.
Mistake 1: Trading Every Fractal
Many beginners mark every fractal on their chart and attempt to trade all of them, leading to overtrading and inconsistent results.
The Problem:
- Creates analysis paralysis with too many signals
- Includes low-quality fractals in ranging markets
- Ignores market context and overall trend
- Results in numerous small losses that outweigh wins
The Solution:
- Filter fractals by timeframe importance (favor higher timeframes)
- Only trade fractals aligned with the broader trend
- Require additional confirmation before entry
- Focus on fractals at key support/resistance zones
Mistake 2: Ignoring the Lagging Nature
Fractals require two candles after the extreme point for confirmation, meaning you're always entering two candles late.
Why This Matters:
- The optimal entry point has already passed
- Risk-reward ratio may be unfavorable by confirmation time
- Price may have already moved significantly from the fractal
How to Compensate:
- Accept wider stops to account for the delay
- Use lower timeframes for earlier entry near higher timeframe fractals
- Wait for pullbacks to fractal levels rather than chasing breaks
- Combine with faster indicators for early warning signals
:::key-concept Timeframe Strategy: Use daily chart fractals for direction and support/resistance, hourly chart fractals for trade setup, and 15-minute chart fractals for precise entry timing. This approach minimizes the lagging effect while maintaining fractal reliability. :::
Mistake 3: Poor Stop Placement
Improper stop loss placement relative to fractal levels leads to premature exits or excessive risk.
Common Errors:
- Placing stops exactly at the fractal level (too tight)
- Positioning stops too far from fractals (poor risk-reward)
- Using fixed pip stops instead of structure-based stops
- Forgetting to account for spread and volatility
Best Practices:
- Place stops 5-10 pips beyond the fractal in forex (adjust for instrument volatility)
- Use ATR (Average True Range) to determine appropriate stop distance
- Account for typical market noise and spread
- Give the trade room to breathe while protecting capital
Mistake 4: Neglecting Market Context
Trading fractals without considering overall market structure, news events, or broader trends reduces effectiveness.
Context to Consider:
- Trend Direction: Is the fractal with or against the trend?
- Market Phase: Are you in accumulation, markup, distribution, or markdown?
- News Events: Major economic releases can invalidate technical levels
- Session Times: Fractals formed during high-liquidity sessions are more reliable
- Market Sentiment: Risk-on vs. risk-off environments affect fractal behavior
Mistake 5: Lack of Patience
Impatience causes traders to force trades before fractals confirm or enter prematurely on assumed fractal formations.
Patience Requirements:
- Wait for full five-candle fractal confirmation before acting
- Allow price to return to fractal levels rather than chasing
- Skip fractal trades that don't meet all criteria
- Accept that some opportunities will pass
:::example Patience in Action: You identify a potential bullish fractal forming on USD/JPY. The third candle just closed, creating what looks like a fractal bottom. Instead of entering immediately, you wait for the fourth and fifth candles to confirm the pattern. During this wait, price moves up 15 pips, and you feel tempted to chase. However, by waiting for confirmation, you avoid a false signal when the fourth candle actually makes a new low, invalidating the fractal. :::
Best Practice 1: Create a Fractal Trading Checklist
Develop a systematic approach to evaluating every potential fractal trade.
Sample Checklist:
- [ ] Fractal fully formed and confirmed (five candles complete)
- [ ] Fractal aligns with higher timeframe trend
- [ ] Additional confirmation indicator agrees (MA, RSI, volume)
- [ ] Risk-reward ratio minimum 1:2
- [ ] Clear stop loss and take profit levels identified
- [ ] No major news events scheduled during trade
- [ ] Account risk limited to 1-2% on this trade
- [ ] Trade fits within daily/weekly trading plan
Best Practice 2: Maintain a Fractal Journal
Document your fractal trades to identify patterns in your successes and failures.
Journal Elements:
- Screenshot of the setup with fractals marked
- Timeframe(s) used for analysis
- Entry price, stop loss, and take profit levels
- Additional indicators or confluence factors
- Outcome (win/loss) and R-multiple (risk-reward achieved)
- What worked well or what could improve
Best Practice 3: Backtest Fractal Strategies
Before risking real capital, validate your fractal approach through historical data.
Backtesting Process: 1. Select a specific market and timeframe 2. Define exact entry and exit rules for fractal trades 3. Review 6-12 months of historical data 4. Record all trades that met your criteria 5. Calculate win rate, average win/loss, and expectancy 6. Refine rules based on results 7. Forward test on a demo account before going live
Best Practice 4: Adapt Fractals to Your Trading Style
Customize fractal usage based on whether you're a day trader, swing trader, or position trader.
Day Trading:
- Use 5-minute and 15-minute chart fractals for entries
- Reference 1-hour fractals for context
- Close all positions by end of session
- Tighter risk management due to lower timeframes
Swing Trading:
- Focus on 4-hour and daily chart fractals
- Hold positions for days to weeks
- Wider stops to accommodate normal market fluctuation
- Target multiple fractals away for larger gains
Position Trading:
- Primarily use weekly and monthly fractals
- Hold positions for months
- Combine with fundamental analysis
- Allow for substantial volatility
:::tip Personal Optimization: The most successful fractal traders develop their own unique approach that aligns with their schedule, risk tolerance, and psychological preferences. Don't simply copy someone else's system—adapt fractal concepts to fit your individual circumstances. :::
Conclusion
Fractals in trading explained through this comprehensive guide represent a powerful tool for identifying potential market turning points and high-probability trading opportunities. These five-candle patterns appear naturally across all markets and timeframes, providing traders with objective reference points for support, resistance, and reversal zones.
The key to successfully trading fractals lies not in trading every pattern you see, but in developing a systematic approach that combines fractal analysis with proper market context, complementary indicators, and sound risk management. Remember that fractals work best when:
- Aligned with the broader market trend
- Confirmed by additional technical indicators
- Formed on higher timeframes or at significant price levels
- Accompanied by appropriate volume and momentum
- Integrated into a complete trading strategy with clear rules
Whether you're a beginner trader just learning technical analysis or an experienced market participant looking to refine your approach, fractals offer a versatile framework for reading price action. The patterns are objective and easy to identify, yet powerful enough to form the foundation of profitable trading systems.
As you begin incorporating fractals into your trading, start small. Practice identifying fractals on your charts, backtest simple strategies, and gradually build confidence through demo trading before risking real capital. Keep a detailed journal of your fractal trades to identify what works best for your specific trading style and the markets you trade.
The fractal patterns you've learned today have been recognized and traded by professionals for decades. Now it's your turn to put this knowledge into practice. Open your charts, start marking fractals, and begin the journey toward mastering this essential technical analysis tool. Remember, consistent profitability comes from patient execution of a well-tested plan, not from chasing every signal that appears on your screen.
Ready to take your fractal trading to the next level? Begin by analyzing historical charts to identify fractal patterns and their outcomes. Practice makes perfect, and the more fractals you study, the better you'll become at recognizing high-probability setups in real-time market conditions.