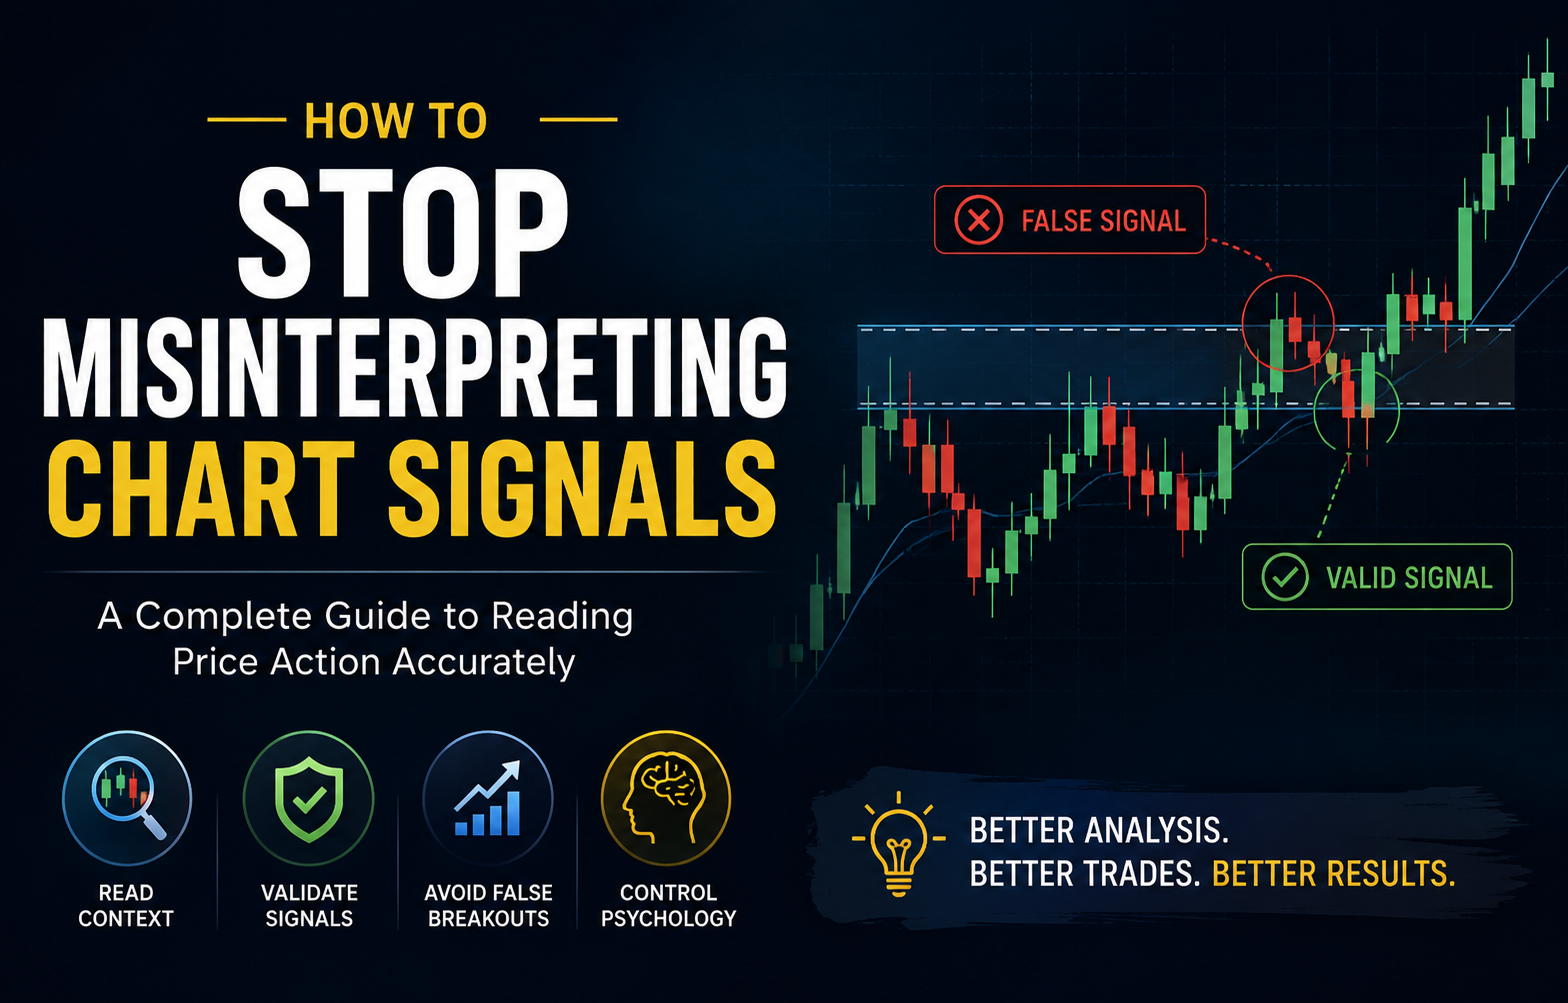
# How to Stop Misinterpreting Chart Signals: A Complete Guide to Reading Price Action Accurately
Every trader has experienced the frustration of entering a trade based on what appeared to be a clear signal, only to watch the market move in the opposite direction. Misinterpreting chart signals is one of the most common—and costly—mistakes traders make, regardless of experience level. The problem isn't usually that the signals are wrong; it's that we're reading them incorrectly or out of context.
This comprehensive guide will help you understand why chart signal misinterpretation happens, identify the most common pitfalls, and develop a systematic approach to reading price action with greater accuracy. By the end, you'll have practical tools to validate signals before committing capital and avoid the costly errors that derail trading accounts.
Table of Contents
- [Understanding Why We Misinterpret Chart Signals](#understanding-why-we-misinterpret-chart-signals)
- [The Most Common Chart Signal Misinterpretations](#the-most-common-chart-signal-misinterpretations)
- [Context is Everything: The Multi-Timeframe Approach](#context-is-everything-the-multi-timeframe-approach)
- [Building a Signal Validation Framework](#building-a-signal-validation-framework)
- [Practical Techniques to Improve Signal Interpretation](#practical-techniques-to-improve-signal-interpretation)
- [Conclusion](#conclusion)
Understanding Why We Misinterpret Chart Signals
Before we can fix the problem of misinterpreting chart signals, we need to understand its root causes. The issue rarely stems from a lack of technical knowledge—instead, it's typically a combination of psychological biases and contextual oversights.
The Psychology Behind Misinterpretation
Our brains are pattern-recognition machines, constantly searching for familiar formations in the chaos of price movement. This natural tendency, while useful, creates several psychological traps:
Confirmation bias leads us to see what we want to see. If you're bullish on a market, you'll naturally emphasize bullish signals while downplaying bearish ones. This selective perception causes traders to enter positions based on incomplete analysis.
Recency bias makes recent events seem more significant than they actually are. If the last three pin bars resulted in strong reversals, you'll expect the fourth to do the same—even if market conditions have fundamentally changed.
Pattern completion bias tricks us into seeing complete patterns where only partial formations exist. Your mind fills in the gaps, convincing you that a half-formed head and shoulders pattern will definitely complete.
:::warning The human brain will find patterns even in random data. Just because you recognize a pattern doesn't mean it has predictive value in the current market context. :::
The Context Problem
Most traders learn to recognize individual signals—a bullish engulfing candle, a break of support, a moving average crossover—but fail to consider the broader context. A bullish engulfing candle means something entirely different at the bottom of a downtrend versus at the top of an extended rally.
:::key-concept Context Hierarchy: Every signal exists within multiple layers of context—timeframe structure, market phase, volume characteristics, and broader market sentiment. Ignoring any layer increases the probability of misinterpretation. :::
The challenge of misinterpreting chart signals often boils down to focusing too narrowly on the signal itself while ignoring the story the entire chart is telling. A signal is just one word in a sentence—you need the full sentence to understand the meaning.
The Most Common Chart Signal Misinterpretations
Let's examine the specific misinterpretations that cost traders the most money and how to recognize when you're falling into these traps.
Support and Resistance Misreadings
Support and resistance levels are foundational to technical analysis, yet they're among the most misunderstood concepts. Here's where traders typically go wrong:
Treating levels as precise lines: Markets don't reverse at exact prices. Support and resistance are better understood as zones where buying or selling pressure historically concentrates. Expecting a precise bounce from a level leads to premature entries and tight stops that get hit before the real move occurs.
Ignoring level strength: Not all support and resistance levels are created equal. A level that held once carries less weight than one tested multiple times across different timeframes. Traders misinterpret chart signals when they give equal importance to a minor level and a major one.
:::example Imagine EUR/USD approaching 1.1000, which acted as support during one session last week. Many traders will prepare to buy at this level. However, if 1.0950 has been tested and held five times over three months across daily and weekly charts, that's where the real buying interest likely sits. Entering at 1.1000 based on weak historical support often results in getting stopped out before the actual bounce occurs at the stronger level below. :::
Breakout False Signals
Breakouts are exciting—they promise the beginning of a strong directional move. This excitement causes traders to jump in without proper validation, leading to devastating false breakout traps.
Volume-less breakouts: A breakout without accompanying volume expansion is suspect. Price may push through a level simply due to low liquidity or stop-hunting, only to quickly reverse. When you're misinterpreting chart signals related to breakouts, you're usually ignoring volume.
Context-free breakouts: A breakout of resistance means little if it occurs at the top of an extended uptrend with exhaustion signs everywhere. The same breakout at the beginning of a new uptrend after consolidation carries much more weight.
:::tip Wait for the breakout candle to close beyond the level, then watch for a retest. If price comes back to the broken level and holds it as new support/resistance, you have much stronger confirmation that the breakout is legitimate. :::
Reversal Pattern Misidentification
Reversal patterns like double tops, head and shoulders, and pin bars appear frequently on charts. The problem? Most of them fail because traders are misinterpreting chart signals about what actually constitutes a valid reversal setup.
Ignoring the trend: Reversal patterns work best when they appear after extended moves. A head and shoulders pattern that forms after a brief rally may not have enough momentum behind it to create a meaningful reversal. You need a tired trend for reversal patterns to be effective.
Incomplete patterns: Many traders enter positions before patterns fully form. Trading a potential head and shoulders before the right shoulder completes and the neckline breaks is speculation, not pattern trading.
Indicator Divergence Confusion
Divergence between price and indicators like RSI or MACD can signal powerful reversals—or become a slow bleed of capital when misunderstood.
Trading divergence alone: Divergence indicates momentum shifts, but momentum can slow without price reversing. Divergence works best when combined with price action confirmation, such as a structure break or reversal candle pattern.
Ignoring divergence timeframe: Divergence on a 5-minute chart carries far less significance than divergence on a daily chart. Many traders give equal weight to all divergences, leading to overtrading and misinterpreting chart signals about the actual strength of the setup.
:::warning Divergence can persist for extended periods, especially in strong trends. Never trade divergence in isolation—always wait for price action confirmation that the momentum shift is actually causing a directional change. :::
Context is Everything: The Multi-Timeframe Approach
The single most effective way to stop misinterpreting chart signals is to analyze them within proper context using multiple timeframes. This approach transforms isolated signals into comprehensive narratives about market behavior.
The Top-Down Analysis Method
Start with higher timeframes and work your way down. This ensures you understand the broader context before focusing on entry signals:
1. Monthly/Weekly Charts: Identify the major trend, key support/resistance zones, and overall market phase (trending, ranging, transitional) 2. Daily Chart: Determine the intermediate trend and current market structure 3. 4-Hour/1-Hour Charts: Identify tactical setups and entry zones 4. Lower Timeframes: Fine-tune entries and exits
:::key-concept Timeframe Alignment: The strongest setups occur when multiple timeframes tell the same story. A bullish signal on a 1-hour chart gains significant strength when the daily and weekly charts are also in uptrends. :::
Reading Market Structure
Market structure—the pattern of higher highs and higher lows (uptrend) or lower highs and lower lows (downtrend)—provides essential context for any signal.
A bullish reversal signal carries different implications depending on structure:
- In an uptrend: Likely a continuation setup after a pullback
- In a downtrend: Potentially a counter-trend bounce (lower probability)
- After structure break: Could signal genuine trend change (requires confirmation)
When traders ignore market structure, they're inevitably misinterpreting chart signals because they don't understand whether they're trading with or against the larger flow.
Volume and Participation Context
Volume tells you about market participation and conviction. The same price pattern with different volume profiles tells completely different stories:
High volume at support: Strong buying interest, level likely to hold Low volume at support: Weak interest, level vulnerable to breaking High volume breakout: Strong conviction, likely to continue Low volume breakout: Weak conviction, likely false signal
:::example Consider a bullish engulfing pattern at support. With high volume, this suggests strong buyer interest and aggressive accumulation—a high-probability reversal setup. The same pattern with below-average volume indicates weak buying pressure and a higher likelihood of continuation lower. The pattern looks identical, but the volume context reveals the true market sentiment. :::
Building a Signal Validation Framework
To consistently avoid misinterpreting chart signals, you need a systematic validation process. This framework ensures you evaluate every potential signal against objective criteria before committing capital.
The Three-Pillar Validation System
Every signal should pass through three validation filters:
Pillar 1: Structural Alignment
Ask these questions:
- Does this signal align with the higher timeframe trend?
- Where are we in the current market structure (trend, range, transition)?
- Is this signal at a significant structural level (major support/resistance, supply/demand zone)?
If the signal conflicts with higher timeframe structure or appears at an arbitrary price level, it fails structural validation.
Pillar 2: Confirmation Requirements
Define specific confirmation criteria:
- For breakouts: Volume expansion + candle close beyond level + retest holding
- For reversals: Pattern completion + momentum divergence + rejection candle
- For continuation: Pullback to key level + bullish/bearish reaction + higher timeframe alignment
Many traders are misinterpreting chart signals because they act on partial setups without waiting for full confirmation. Your confirmation requirements should be specific and non-negotiable.
:::tip Write down your exact confirmation criteria for each setup type you trade. This removes emotional decision-making and creates objective standards for signal validation. :::
Pillar 3: Risk-Reward Assessment
Even valid signals aren't tradeable if the risk-reward ratio is unfavorable:
- Can you place a logical stop loss that respects market structure?
- Does the setup offer at least 2:1 reward-to-risk?
- Is there clear room to a logical profit target?
A signal might be technically valid but practically untradeable due to poor risk-reward. This is a form of misinterpretation—seeing a valid pattern but failing to recognize it doesn't offer a viable trading opportunity.
Creating Your Signal Checklist
Develop a pre-trade checklist that you review before every entry. Here's a template:
Market Context
- [ ] Higher timeframe trend identified and documented
- [ ] Current market phase determined (trending/ranging/transitional)
- [ ] Major support/resistance levels marked
Signal Validation
- [ ] Signal appears at significant structural level
- [ ] All confirmation criteria met (specify which ones)
- [ ] Volume supports the signal interpretation
- [ ] Multiple timeframes align
Trade Viability
- [ ] Logical stop loss location identified
- [ ] Risk-reward ratio meets minimum standard (specify ratio)
- [ ] Clear profit target(s) identified
- [ ] Position size calculated based on risk parameters
:::key-concept A checklist removes the burden of remembering everything in the heat of the moment. It also creates a paper trail you can review later to identify patterns in your decision-making. :::
Practical Techniques to Improve Signal Interpretation
Beyond frameworks and checklists, specific practical techniques can dramatically improve your ability to read charts accurately.
The Clean Chart Approach
Many traders overcomplicate their charts with dozens of indicators, creating visual noise that obscures rather than clarifies price action. This abundance of information paradoxically increases the likelihood of misinterpreting chart signals.
Try this exercise:
- Remove all indicators from your chart
- Mark only major support/resistance levels
- Identify trend direction using price structure alone
- Look for signals based purely on price action
You'll be surprised how much clearer signals become when you eliminate the clutter. Indicators should confirm what price is already showing you, not create signals on their own.
The "Why Here, Why Now" Method
Before acting on any signal, ask two questions:
Why Here? What makes this price level significant? Is there confluence of factors (prior support/resistance, Fibonacci level, psychological number, supply/demand zone)? If you can't articulate why the signal matters at this specific location, you may be misinterpreting chart signals.
Why Now? What has changed to create this signal? Has momentum shifted? Has a key level broken? Has market structure changed? Signals don't appear randomly—something in the market dynamic has shifted. Identify what.
:::example You notice a bullish pin bar on EUR/USD. Before trading it:
Why Here? The pin bar formed at 1.0850, which acted as support three times over the past two months and aligns with the 61.8% Fibonacci retracement of the previous rally.
Why Now? The pin bar appeared after a three-day decline that pulled back from overbought conditions, and RSI is showing bullish divergence while remaining above the key 40 level that marks bullish momentum.
This analysis confirms you're not just seeing a random pin bar—you understand the context that makes it significant. :::
The Post-Trade Review Process
The fastest way to stop misinterpreting chart signals is to learn from your misinterpretations. After each trade, whether winning or losing, conduct a review:
1. Screenshot the setup: Capture multiple timeframes showing the signal and context 2. Document your interpretation: Write exactly why you took the trade 3. Identify what happened: Did the signal play out as expected? If not, what did you miss? 4. Extract the lesson: What will you look for next time to avoid this misinterpretation?
Over time, you'll notice patterns in your misinterpretations. Maybe you consistently overvalue breakout signals, or underestimate the importance of volume, or ignore higher timeframe context. These patterns, once identified, can be systematically corrected.
Practice Without Risk: Chart Replay and Backtesting
One reason traders repeatedly misinterpret chart signals is insufficient experience reading them correctly. Build pattern recognition through risk-free practice:
Chart Replay: Use trading platforms with replay features to practice identifying signals in historical data. Cover the right side of the chart and work through it candle by candle, making decisions in "real-time" without risking capital.
Systematic Backtesting: Go through months or years of historical charts, marking where your signal appeared and whether it played out as expected. Track the success rate under different market conditions (trending vs. ranging, high vs. low volatility).
This practice builds the experiential database your brain uses for pattern recognition. You'll develop an intuitive sense for which signals are reliable and which are likely to fail—but this intuition must be built on hundreds of observations, not dozens.
:::tip Keep a "signal library" of screenshots showing both successful and failed signals in different contexts. Review this library regularly to reinforce the contextual factors that separate high-probability setups from low-probability ones. :::
Developing Market Context Awareness
Broaden your awareness beyond the specific chart you're analyzing:
Correlated Markets: Check related markets for confirmation. If you're seeing a bullish signal on EUR/USD, what are other EUR pairs showing? What about the Dollar Index? Conflicting signals across correlated markets suggest your interpretation may be flawed.
Market Sentiment: Understand the broader market environment. Risk-on or risk-off? High or low volatility regime? Trending or mean-reverting conditions? The same chart signal behaves differently in different market regimes.
Fundamental Backdrop: While technical analysis can stand alone, awareness of major fundamental factors (central bank policy, economic data releases, geopolitical events) provides additional context. A bearish technical signal ahead of a major bullish fundamental catalyst may not play out as expected.
The Patience Filter
Many instances of misinterpreting chart signals come from impatience—acting too quickly without allowing the full picture to develop. Implement these patience disciplines:
Wait for candle closes: Don't make decisions based on candles still forming. What looks like a bullish engulfing pattern can turn into a long upper wick shooting star by the close.
Require full pattern completion: If you trade chart patterns, wait for complete formation plus the trigger (like a neckline break in head and shoulders). Acting early is speculation, not pattern trading.
Allow confirmation time: After a signal appears, give the market time to confirm it. A breakout confirmed by the next several candles closing beyond the level is far more reliable than one you chase on the breakout candle itself.
:::warning FOMO (Fear Of Missing Out) is a primary driver of acting on incomplete signals. Remember: there will always be another trade. Missing a trade is frustrating; taking a poorly validated trade is expensive. :::
Conclusion
Misinterpreting chart signals is not a permanent condition—it's a skill deficiency that can be systematically addressed. The traders who consistently read charts accurately aren't inherently more talented; they've developed structured approaches to signal interpretation that remove guesswork and emotional bias.
The key insights to remember:
- Context is paramount: Signals don't exist in isolation. Evaluate every signal within the context of market structure, timeframe alignment, and volume characteristics.
- Validation is non-negotiable: Develop and follow a systematic validation framework that requires objective criteria to be met before acting on any signal.
- Psychology matters: Recognize the cognitive biases that cause misinterpretation—confirmation bias, recency bias, and pattern completion bias—and implement processes to counteract them.
- Experience builds intuition: Through deliberate practice, post-trade reviews, and systematic backtesting, you'll develop the experiential database needed for accurate signal interpretation.
- Simplicity beats complexity: Often, the clearest signal interpretation comes from clean charts and focus on price action rather than indicator overload.
The path to stopping chart signal misinterpretation isn't about finding better indicators or more exotic patterns. It's about developing the discipline to evaluate signals systematically, the patience to wait for proper confirmation, and the self-awareness to recognize when psychological biases are clouding your judgment.
Start implementing these techniques today. Create your validation checklist, clean up your charts, and begin the practice of asking "Why here, why now?" before every trade. Review your past trades to identify your personal misinterpretation patterns. Most importantly, track your progress—you should see measurable improvement in signal accuracy within weeks of systematic application.
The ability to read charts accurately is perhaps the most valuable skill in trading. It's worth the focused effort to develop it properly. Begin with your next chart analysis session, and commit to never taking another signal at face value without proper validation. Your trading account will thank you.
:::tip Your Next Step: Take your three most recent losing trades and conduct "Why here, why now?" post-trade reviews. Identify which contextual factors you missed that could have prevented the misinterpretation. This immediate feedback will accelerate your learning curve. :::