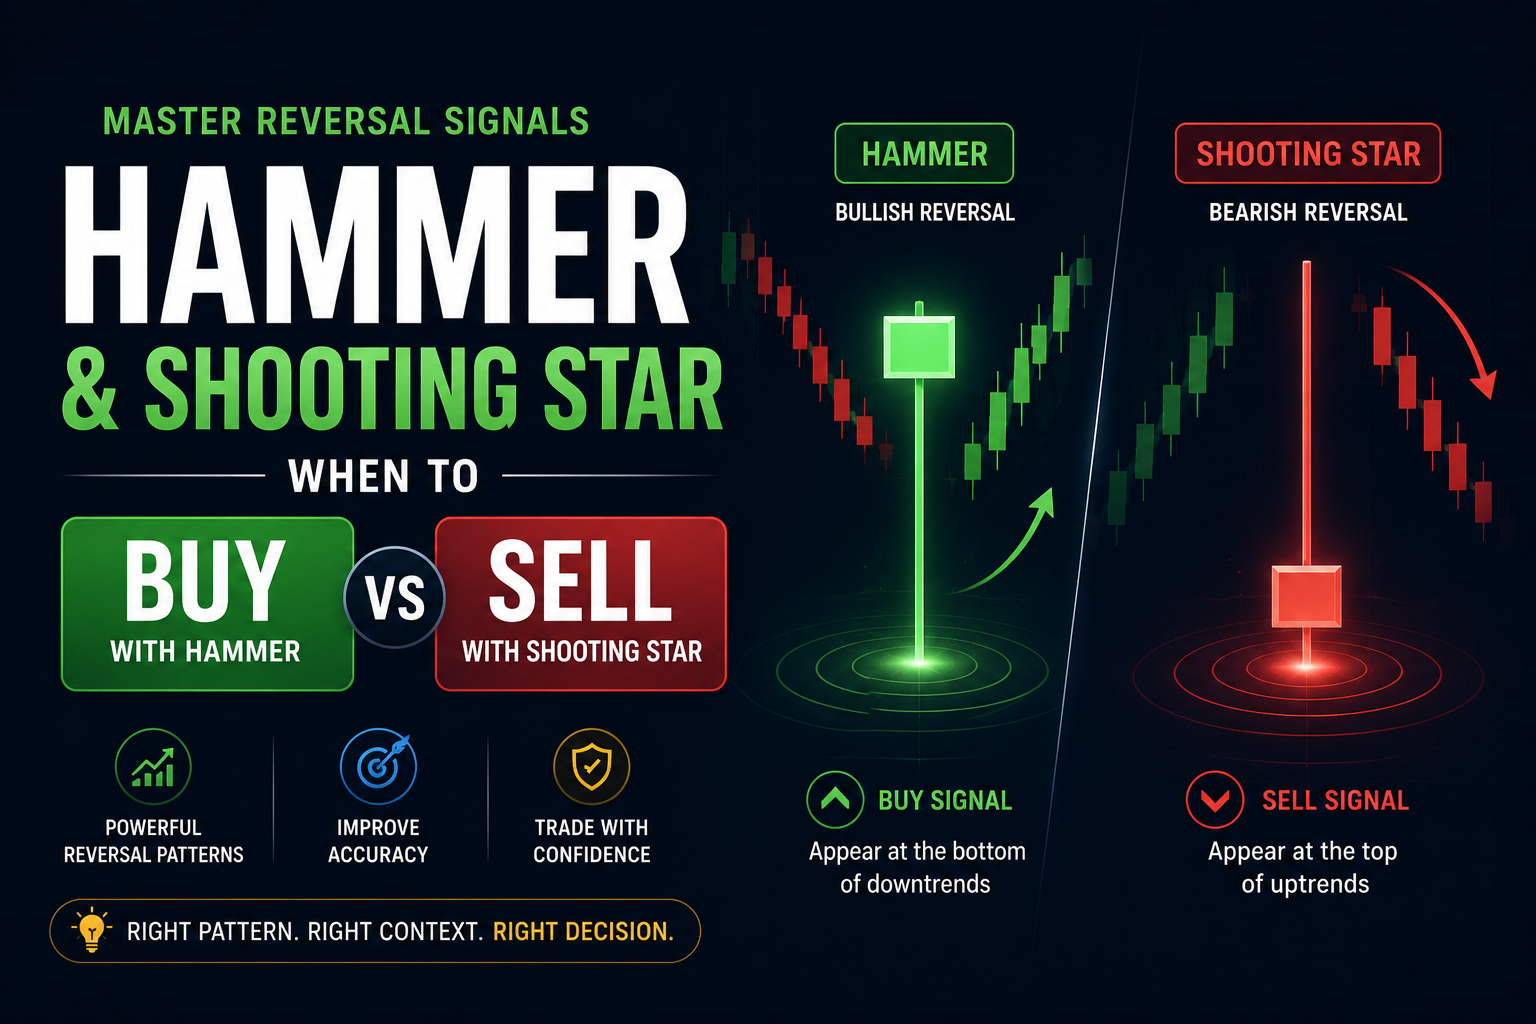
Candlestick patterns remain one of the most powerful tools in a trader's arsenal, and among the most reliable are the hammer and shooting star formations. These single-candle reversal patterns appear frequently across all markets and timeframes, offering traders clear visual signals of potential trend changes. Understanding when to buy with a hammer and when to sell with a shooting star can dramatically improve your trading accuracy and profitability.
While both patterns share similar structural characteristics—a small body with a long wick—they signal opposite market conditions and require different trading approaches. The hammer suggests bullish reversal potential at market bottoms, while the shooting star warns of bearish reversals at market tops. However, recognizing these patterns is only the beginning. Success comes from understanding the context in which they appear, confirming their validity, and executing trades with proper risk management.
In this comprehensive guide, we'll explore everything you need to know about these powerful reversal patterns, from identification to execution, helping you develop a systematic approach to trading both hammers and shooting stars.
Table of Contents
- [Understanding the Hammer Pattern](#understanding-the-hammer-pattern)
- [Understanding the Shooting Star Pattern](#understanding-the-shooting-star-pattern)
- [Key Differences and Similarities](#key-differences-and-similarities)
- [Confirmation Signals and Context](#confirmation-signals-and-context)
- [Trading Strategies and Entry Techniques](#trading-strategies-and-entry-techniques)
- [Risk Management and Position Sizing](#risk-management-and-position-sizing)
- [Conclusion](#conclusion)
Understanding the Hammer Pattern
The hammer is a bullish reversal candlestick pattern that typically appears at the bottom of downtrends, signaling potential exhaustion of selling pressure and the emergence of buying interest. Its distinctive shape resembles an actual hammer, with a small body at the top and a long lower shadow.
Anatomy of a Hammer
To qualify as a true hammer, the candlestick must meet specific criteria:
Body Characteristics:
- Small real body located at or near the upper end of the trading range
- The body can be either bullish (green/white) or bearish (red/black)
- Body size should be relatively small compared to the total candle range
Shadow Requirements:
- Lower shadow should be at least twice the length of the real body
- Ideally, the lower shadow is three times the body length or more
- Upper shadow should be minimal or non-existent
- The longer the lower shadow, the more significant the pattern
:::key-concept The Psychology Behind the Hammer
The hammer reflects a battle between buyers and sellers where sellers initially push prices significantly lower, but buyers step in with enough force to drive prices back up near the opening level. This rejection of lower prices demonstrates buying pressure and potential trend exhaustion. :::
Where Hammers Appear
Context is critical when identifying valid hammer patterns. Look for hammers in these locations:
1. After Significant Downtrends: The pattern is most reliable after an extended move lower 2. At Support Levels: Hammers gain credibility when forming at key support zones 3. Near Fibonacci Retracements: Common at 50%, 61.8%, or 78.6% retracement levels 4. At Round Numbers: Psychological levels often coincide with hammer formations
:::warning Hammer Invalidation
A hammer appearing in the middle of an uptrend or without a preceding downtrend has little predictive value. Always ensure the pattern appears in the proper context—at potential reversal zones after bearish price action. :::
Types of Hammers
Several variations of the hammer pattern exist:
Standard Hammer: Small body at the top, long lower shadow, minimal upper shadow
Inverted Hammer: Small body at the bottom, long upper shadow, minimal lower shadow (also bullish at bottoms)
Dragonfly Doji: Opening and closing prices are identical, creating a T-shape with no body
Each variation carries similar implications, though the standard hammer with a small bullish body is generally considered the strongest signal.
Understanding the Shooting Star Pattern
The shooting star is the bearish counterpart to the hammer, appearing at the top of uptrends and warning of potential reversals. This pattern signals that buyers pushed prices higher during the session, but sellers gained control and drove prices back down near the opening level.
Anatomy of a Shooting Star
A valid shooting star must exhibit these characteristics:
Body Characteristics:
- Small real body located at or near the lower end of the trading range
- Can be bullish or bearish, though a bearish body adds conviction
- Body should be proportionally small relative to the overall candle
Shadow Requirements:
- Upper shadow should be at least twice the length of the body
- Optimal shooting stars have upper shadows three times the body or longer
- Lower shadow should be minimal to non-existent
- The longer the upper shadow, the stronger the rejection signal
:::key-concept The Psychology Behind the Shooting Star
The shooting star demonstrates that buyers attempted to continue the uptrend by pushing prices higher, but encountered strong selling pressure that completely erased the gains. This rejection of higher prices suggests distribution and potential trend exhaustion. :::
Where Shooting Stars Appear
For maximum reliability, shooting stars should form in specific market contexts:
1. After Strong Uptrends: Most effective following extended bullish moves 2. At Resistance Levels: Credibility increases when forming at established resistance 3. Near Fibonacci Extensions: Often appear at 127.2%, 161.8%, or 200% extension levels 4. At Previous Highs: Historical price peaks often coincide with shooting star formations
:::example Real Trading Scenario
Imagine a stock that has rallied 25% over two weeks. It reaches a previous all-time high and forms a shooting star with an upper shadow twice the body length. This pattern, combined with the resistance from the previous high, creates a high-probability short setup. :::
Types of Shooting Stars
Variations of the shooting star pattern include:
Standard Shooting Star: Small body at bottom, long upper shadow, minimal lower shadow
Inverted Hammer at Tops: When appearing after uptrends, this becomes bearish
Gravestone Doji: Opening and closing prices are identical, creating an inverted T-shape
The most reliable shooting star has a small bearish body, emphasizing the rejection of higher prices.
Key Differences and Similarities
While hammers and shooting stars share structural similarities, understanding their differences is crucial for proper application.
Structural Similarities
Both patterns share these common characteristics:
- Single Candlestick Patterns: Both are complete reversal signals in one candle
- Small Real Bodies: Each has a proportionally small body relative to the shadows
- Long Shadows: Both feature prominent shadows indicating price rejection
- Reversal Nature: Both signal potential trend changes rather than continuation
- Require Confirmation: Neither should be traded in isolation without supporting evidence
Critical Differences
Location in Trend:
- Hammer: Appears at downtrend bottoms (bullish reversal)
- Shooting Star: Appears at uptrend tops (bearish reversal)
Shadow Direction:
- Hammer: Long lower shadow showing rejection of lower prices
- Shooting Star: Long upper shadow showing rejection of higher prices
Market Psychology:
- Hammer: Buyers overcome sellers, rejecting lower prices
- Shooting Star: Sellers overcome buyers, rejecting higher prices
Trading Implication:
- Hammer: Suggests buying opportunity
- Shooting Star: Suggests selling or shorting opportunity
:::tip Quick Identification Method
Remember this simple rule: The long shadow points to where price was rejected. Hammers reject lower prices (bullish), while shooting stars reject higher prices (bearish). The shadow tells the story of who won the battle. :::
Volume Considerations
While both patterns benefit from volume analysis, the ideal volume characteristics differ:
Hammer Volume:
- Higher volume on the hammer candle suggests stronger buying interest
- Increasing volume as price rebounds from the low adds conviction
- Low volume hammers are less reliable
Shooting Star Volume:
- Higher volume on the shooting star indicates stronger distribution
- Volume surge followed by price rejection is particularly bearish
- Low volume shooting stars may simply indicate lack of follow-through rather than true reversal
Confirmation Signals and Context
Neither hammers nor shooting stars should be traded in isolation. Professional traders always seek confirmation before entering positions based on these patterns.
Essential Confirmation Techniques
1. Next Candle Confirmation
The most common confirmation method involves the candle immediately following the pattern:
For Hammers:
- Wait for a bullish candle that closes above the hammer's high
- Increased volume on the confirmation candle strengthens the signal
- The higher the close relative to the hammer, the stronger the confirmation
For Shooting Stars:
- Wait for a bearish candle that closes below the shooting star's low
- Volume increase on the breakdown adds conviction
- The lower the close relative to the shooting star, the stronger the confirmation
:::example Confirmation in Action
A hammer forms at a support level with a low at $48.50 and a close at $50.00. The next day, the market opens at $50.25 and closes at $51.75 on strong volume. This confirmation validates the hammer and triggers a long entry. :::
2. Support and Resistance Alignment
Patterns gain credibility when aligned with key levels:
- Hammers at major support zones are more reliable
- Shooting stars at significant resistance carry more weight
- Multiple timeframe support/resistance alignment increases probability
- Historical price levels add conviction to reversal patterns
3. Trend Context Analysis
Evaluate the broader trend before trading these patterns:
For Hammers:
- Is there a clear downtrend to reverse?
- Has the downtrend shown signs of weakening?
- Are momentum indicators showing bullish divergence?
- Is the market oversold on multiple timeframes?
For Shooting Stars:
- Is there a clear uptrend to reverse?
- Has the uptrend shown signs of exhaustion?
- Are momentum indicators showing bearish divergence?
- Is the market overbought on multiple timeframes?
4. Multiple Timeframe Confirmation
Analyzing higher timeframes provides crucial context:
- A hammer on a daily chart gains strength if the weekly chart shows support
- A shooting star on a 4-hour chart is more reliable if the daily shows resistance
- Alignment across timeframes significantly increases pattern reliability
- Higher timeframe patterns generally take precedence over lower timeframes
:::warning Avoid These Common Mistakes
1. Trading hammers in the middle of uptrends or shooting stars in the middle of downtrends 2. Ignoring volume—patterns with weak volume often fail 3. Entering before confirmation, leading to premature positions 4. Forgetting to check higher timeframe context 5. Overtrading these patterns without proper risk management :::
Additional Confluence Factors
Look for these supporting elements to strengthen pattern validity:
Technical Indicators:
- RSI divergence aligning with the reversal pattern
- Moving average support/resistance at the pattern location
- MACD crosses occurring near pattern formation
- Bollinger Band extremes coinciding with patterns
Market Structure:
- Break of market structure on higher timeframes
- Liquidity zones being tested at pattern formation
- Previous swing highs/lows aligning with pattern location
- Gap fills occurring at pattern areas
Trading Strategies and Entry Techniques
Successful trading of hammers and shooting stars requires systematic entry strategies that balance risk and reward while maximizing probability.
Hammer Trading Strategy
Conservative Entry Approach:
1. Pattern Identification: Spot a valid hammer after a downtrend at support 2. Confirmation Wait: Wait for the next candle to close above the hammer high 3. Entry Trigger: Enter long when price breaks above the confirmation candle high 4. Stop Loss Placement: Place stop below the hammer's low with a small buffer 5. Target Setting: Aim for recent resistance or use a risk-reward ratio of at least 2:1
Aggressive Entry Approach:
1. Pattern Recognition: Identify hammer formation in real-time 2. Immediate Entry: Enter at the close of the hammer candle or on the open of the next 3. Tight Stop: Place stop just below the hammer low 4. Quick Scaling: Consider scaling out partial positions at resistance levels 5. Trail Remaining: Trail stop on remaining position as price advances
:::tip Entry Optimization
For best results, use a combination approach: Enter 50% of your intended position on the hammer close (aggressive) and the remaining 50% on confirmation (conservative). This balances early entry benefits with confirmation safety. :::
Shooting Star Trading Strategy
Conservative Entry Approach:
1. Pattern Spotting: Identify shooting star after uptrend at resistance 2. Confirmation Wait: Wait for next candle to close below the shooting star low 3. Entry Trigger: Enter short when price breaks below the confirmation candle low 4. Stop Loss Placement: Place stop above the shooting star's high with buffer 5. Target Setting: Aim for recent support or minimum 2:1 risk-reward ratio
Aggressive Entry Approach:
1. Real-Time Recognition: Spot shooting star as it forms 2. Quick Entry: Enter at close of shooting star or open of next candle 3. Stop Placement: Set stop just above the shooting star high 4. Partial Profit Taking: Scale out at support levels 5. Stop Trailing: Trail stop on remaining position downward
Advanced Entry Techniques
Pullback Entry Method:
Instead of entering immediately after confirmation, wait for a pullback:
For Hammers:
- After confirmation, wait for price to pull back to the hammer high
- Enter long when price bounces from this level
- This provides better risk-reward ratio
- Stop remains below hammer low
For Shooting Stars:
- After confirmation, wait for price to retrace to shooting star low
- Enter short when price rejects from this level
- Improves entry price significantly
- Stop remains above shooting star high
:::example Pullback Entry Example
A shooting star forms at $155 with a low of $152. After confirmation, price drops to $148 but then rallies back to $152.50. Entering the short here rather than at the initial breakdown at $151 provides a better entry price and improved risk-reward ratio. :::
Scale-In Technique:
Divide your position into multiple entries:
- 1/3 position at pattern close (most aggressive)
- 1/3 position at confirmation break (medium risk)
- 1/3 position at pullback to pattern level (most conservative)
This approach averages your entry while managing risk across different confirmation levels.
Position Management
Profit Targets:
Set realistic targets based on market structure:
1. First Target: Previous swing high/low in the direction of your trade 2. Second Target: Major support/resistance levels 3. Third Target: Fibonacci extension levels (127.2%, 161.8%) 4. Final Target: Previous significant market structure points
Trailing Stop Strategy:
As your trade moves into profit:
- Move stop to breakeven after 1:1 risk-reward achieved
- Trail stop below recent swing lows (long) or above swing highs (short)
- Use ATR-based trailing stops for volatile markets
- Tighten stop as price approaches final targets
Risk Management and Position Sizing
Even the most reliable hammer or shooting star patterns require proper risk management to ensure long-term profitability.
Stop Loss Placement
For Hammer Trades:
Standard Stop Placement:
- Place stop 5-10 pips/ticks below the hammer's low
- Buffer accounts for normal market noise and potential stop hunting
- Never use a stop wider than 2-3% of your account on a single trade
Alternative Stop Methods:
- Use the Average True Range (ATR) to determine buffer size
- Place stop below the support level that aligns with the hammer
- On higher timeframes, use the low of the candle two periods before the hammer
For Shooting Star Trades:
Standard Stop Placement:
- Position stop 5-10 pips/ticks above the shooting star's high
- Ensure buffer protects against false breakouts and whipsaws
- Maintain total risk within your risk management parameters
Alternative Stop Methods:
- Use ATR multiplier (1.5x or 2x) above the shooting star high
- Place stop above the resistance level where shooting star formed
- Consider the high of the candle two periods before the shooting star
:::warning Stop Loss Mistakes to Avoid
:::
- Placing stops too tight, resulting in premature stop-outs
- Moving stops away from the market when trade goes against you
- Using arbitrary stop levels not based on market structure
- Risking more than your predetermined risk per trade limit
- Removing stops entirely due to overconfidence in the pattern
Position Sizing Calculations
Proper position sizing ensures you never risk more than intended:
Basic Position Size Formula:
1. Determine your risk per trade (typically 1-2% of account) 2. Calculate distance from entry to stop loss in pips/points 3. Position Size = (Account Risk Amount) / (Stop Distance × Point Value)
Example Calculation:
- Account Size: $50,000
- Risk Per Trade: 1.5% = $750
- Entry Price: $100.00
- Stop Loss: $98.50
- Risk Per Share: $1.50
- Position Size: $750 / $1.50 = 500 shares
:::key-concept The 2% Rule
Never risk more than 2% of your trading capital on any single trade, regardless of how perfect the hammer or shooting star appears. This ensures that even a string of losses won't devastate your account. Most professional traders risk 0.5-1% per trade for optimal capital preservation. :::
Risk-Reward Ratios
Ensure your potential reward justifies the risk:
Minimum Requirements:
- Never enter a trade with less than 1.5:1 risk-reward ratio
- Optimal hammers and shooting stars offer 2:1 or better
- Premium setups with strong confluence can target 3:1 or higher
Calculating Risk-Reward:
1. Measure distance from entry to stop (your risk) 2. Measure distance from entry to target (your reward) 3. Divide reward by risk to get ratio
If your hammer trade risks 50 points but only targets 60 points, your ratio is 1.2:1—too low for most traders. Look for at least 100 points reward for a 2:1 ratio.
Managing Multiple Positions
When trading multiple hammer or shooting star setups simultaneously:
Correlation Awareness:
- Avoid taking multiple correlated positions (EUR/USD and GBP/USD hammers)
- Ensure total risk across all positions doesn't exceed 4-6% of account
- Diversify across different markets when possible
Portfolio Heat Management:
- Calculate total risk exposure across all open positions
- Reduce new position sizes when multiple trades are active
- Close weakest positions first if portfolio heat exceeds limits
Win Rate and Expectancy
Understand realistic expectations for these patterns:
Typical Performance Metrics:
- Well-confirmed hammers/shooting stars: 55-65% win rate
- Average risk-reward ratio: 2:1 to 2.5:1
- Overall positive expectancy when properly traded
Improving Performance:
- Trade only the highest probability setups (strong confluence)
- Always wait for confirmation on uncertain patterns
- Maintain detailed trading journal to identify pattern strengths/weaknesses
- Review losing trades to identify common factors
:::tip Pattern Journaling
Keep a specific log of every hammer and shooting star trade including: timeframe, confluence factors present, entry method used, and outcome. After 30-50 trades, patterns will emerge showing which specific setups work best for your trading style. :::
Conclusion
Hammers and shooting stars represent two of the most reliable and actionable candlestick reversal patterns available to traders. Their simplicity makes them accessible to beginners, while their effectiveness keeps them in the toolbox of experienced professionals. However, the key to success lies not in simply recognizing these patterns, but in understanding the context in which they appear, waiting for proper confirmation, and executing with disciplined risk management.
The hammer signals that sellers have lost control and buyers are stepping in, offering potential long opportunities at market bottoms and support levels. The shooting star warns that buyers have been rejected and sellers are gaining strength, presenting short opportunities at market tops and resistance zones. Both patterns tell a clear story of market psychology—a story of rejection, reversal, and potential opportunity.
Remember these critical points as you incorporate these patterns into your trading:
Essential Success Factors:
- Context is everything—ensure patterns appear after clear trends at key levels
- Confirmation significantly increases probability—never rush entries without validation
- Volume adds conviction—stronger volume patterns are more reliable
- Risk management is non-negotiable—protect your capital on every trade
- Multiple timeframe analysis provides crucial perspective
- Confluence with other technical factors dramatically improves results
Your journey to mastering hammers and shooting stars doesn't end with reading this guide. True proficiency comes from studying these patterns in real market conditions, paper trading them until you develop confidence, and then executing with proper position sizing and risk management. Start by reviewing historical charts to identify these patterns and their outcomes. Notice what additional factors were present when patterns succeeded versus when they failed.
As you develop your skills, you'll begin to recognize the subtle differences between high-probability setups and mediocre ones. You'll learn which timeframes work best for your trading style, which markets produce the most reliable patterns, and which confluence factors add the most value to your analysis. This pattern recognition becomes second nature with experience, allowing you to spot opportunities quickly while maintaining the discipline to wait for optimal setups.
Your Next Steps:
Begin your practice by opening your charting platform and identifying at least 20 historical examples of both hammers and shooting stars. Note what happened after each pattern, what confirmation signals were present, and what the overall market context looked like. This hands-on analysis will build your pattern recognition skills far more effectively than passive reading.
Then move to real-time chart watching, observing how these patterns form in live markets without taking actual positions. Practice marking potential entry points, stop losses, and targets. Calculate position sizes based on your risk parameters. This simulation phase builds confidence and refines your execution skills before risking capital.
Finally, when you're ready to trade real money, start small. Take only the highest probability setups with strong confluence factors and clear confirmation. Track every trade meticulously, building your personal database of pattern performance. With time, patience, and disciplined execution, hammers and shooting stars will become reliable components of your trading edge.
The markets will continue to present these patterns regularly—now you have the knowledge to recognize them and the framework to trade them profitably. Begin your chart analysis today and discover how these powerful reversal signals can enhance your trading performance.