# How to Draw Supply and Demand Zones That Actually Work - A Complete Guide
Supply and demand zones are among the most powerful concepts in technical analysis, yet many traders struggle to draw them correctly. These zones represent areas where institutional money has previously created significant buying or selling pressure, making them prime locations for future price reactions. Understanding how to draw supply and demand zones accurately can transform your trading by helping you identify high-probability entry and exit points.
The difference between profitable traders and those who struggle often comes down to their ability to read the story that price action tells. Supply and demand zones are essentially the fingerprints left behind by smart money - the banks, institutions, and large traders who move the markets. When you learn to identify these zones correctly, you gain insight into where these powerful market participants are likely to act again.
Table of Contents
- [Understanding Supply and Demand Zone Fundamentals](#understanding-supply-and-demand-zone-fundamentals)
- [The Step-by-Step Process to Draw Effective Zones](#the-step-by-step-process-to-draw-effective-zones)
- [Identifying High-Quality vs Low-Quality Zones](#identifying-high-quality-vs-low-quality-zones)
- [Common Mistakes and How to Avoid Them](#common-mistakes-and-how-to-avoid-them)
- [Advanced Zone Drawing Techniques](#advanced-zone-drawing-techniques)
- [Conclusion](#conclusion)
Understanding Supply and Demand Zone Fundamentals
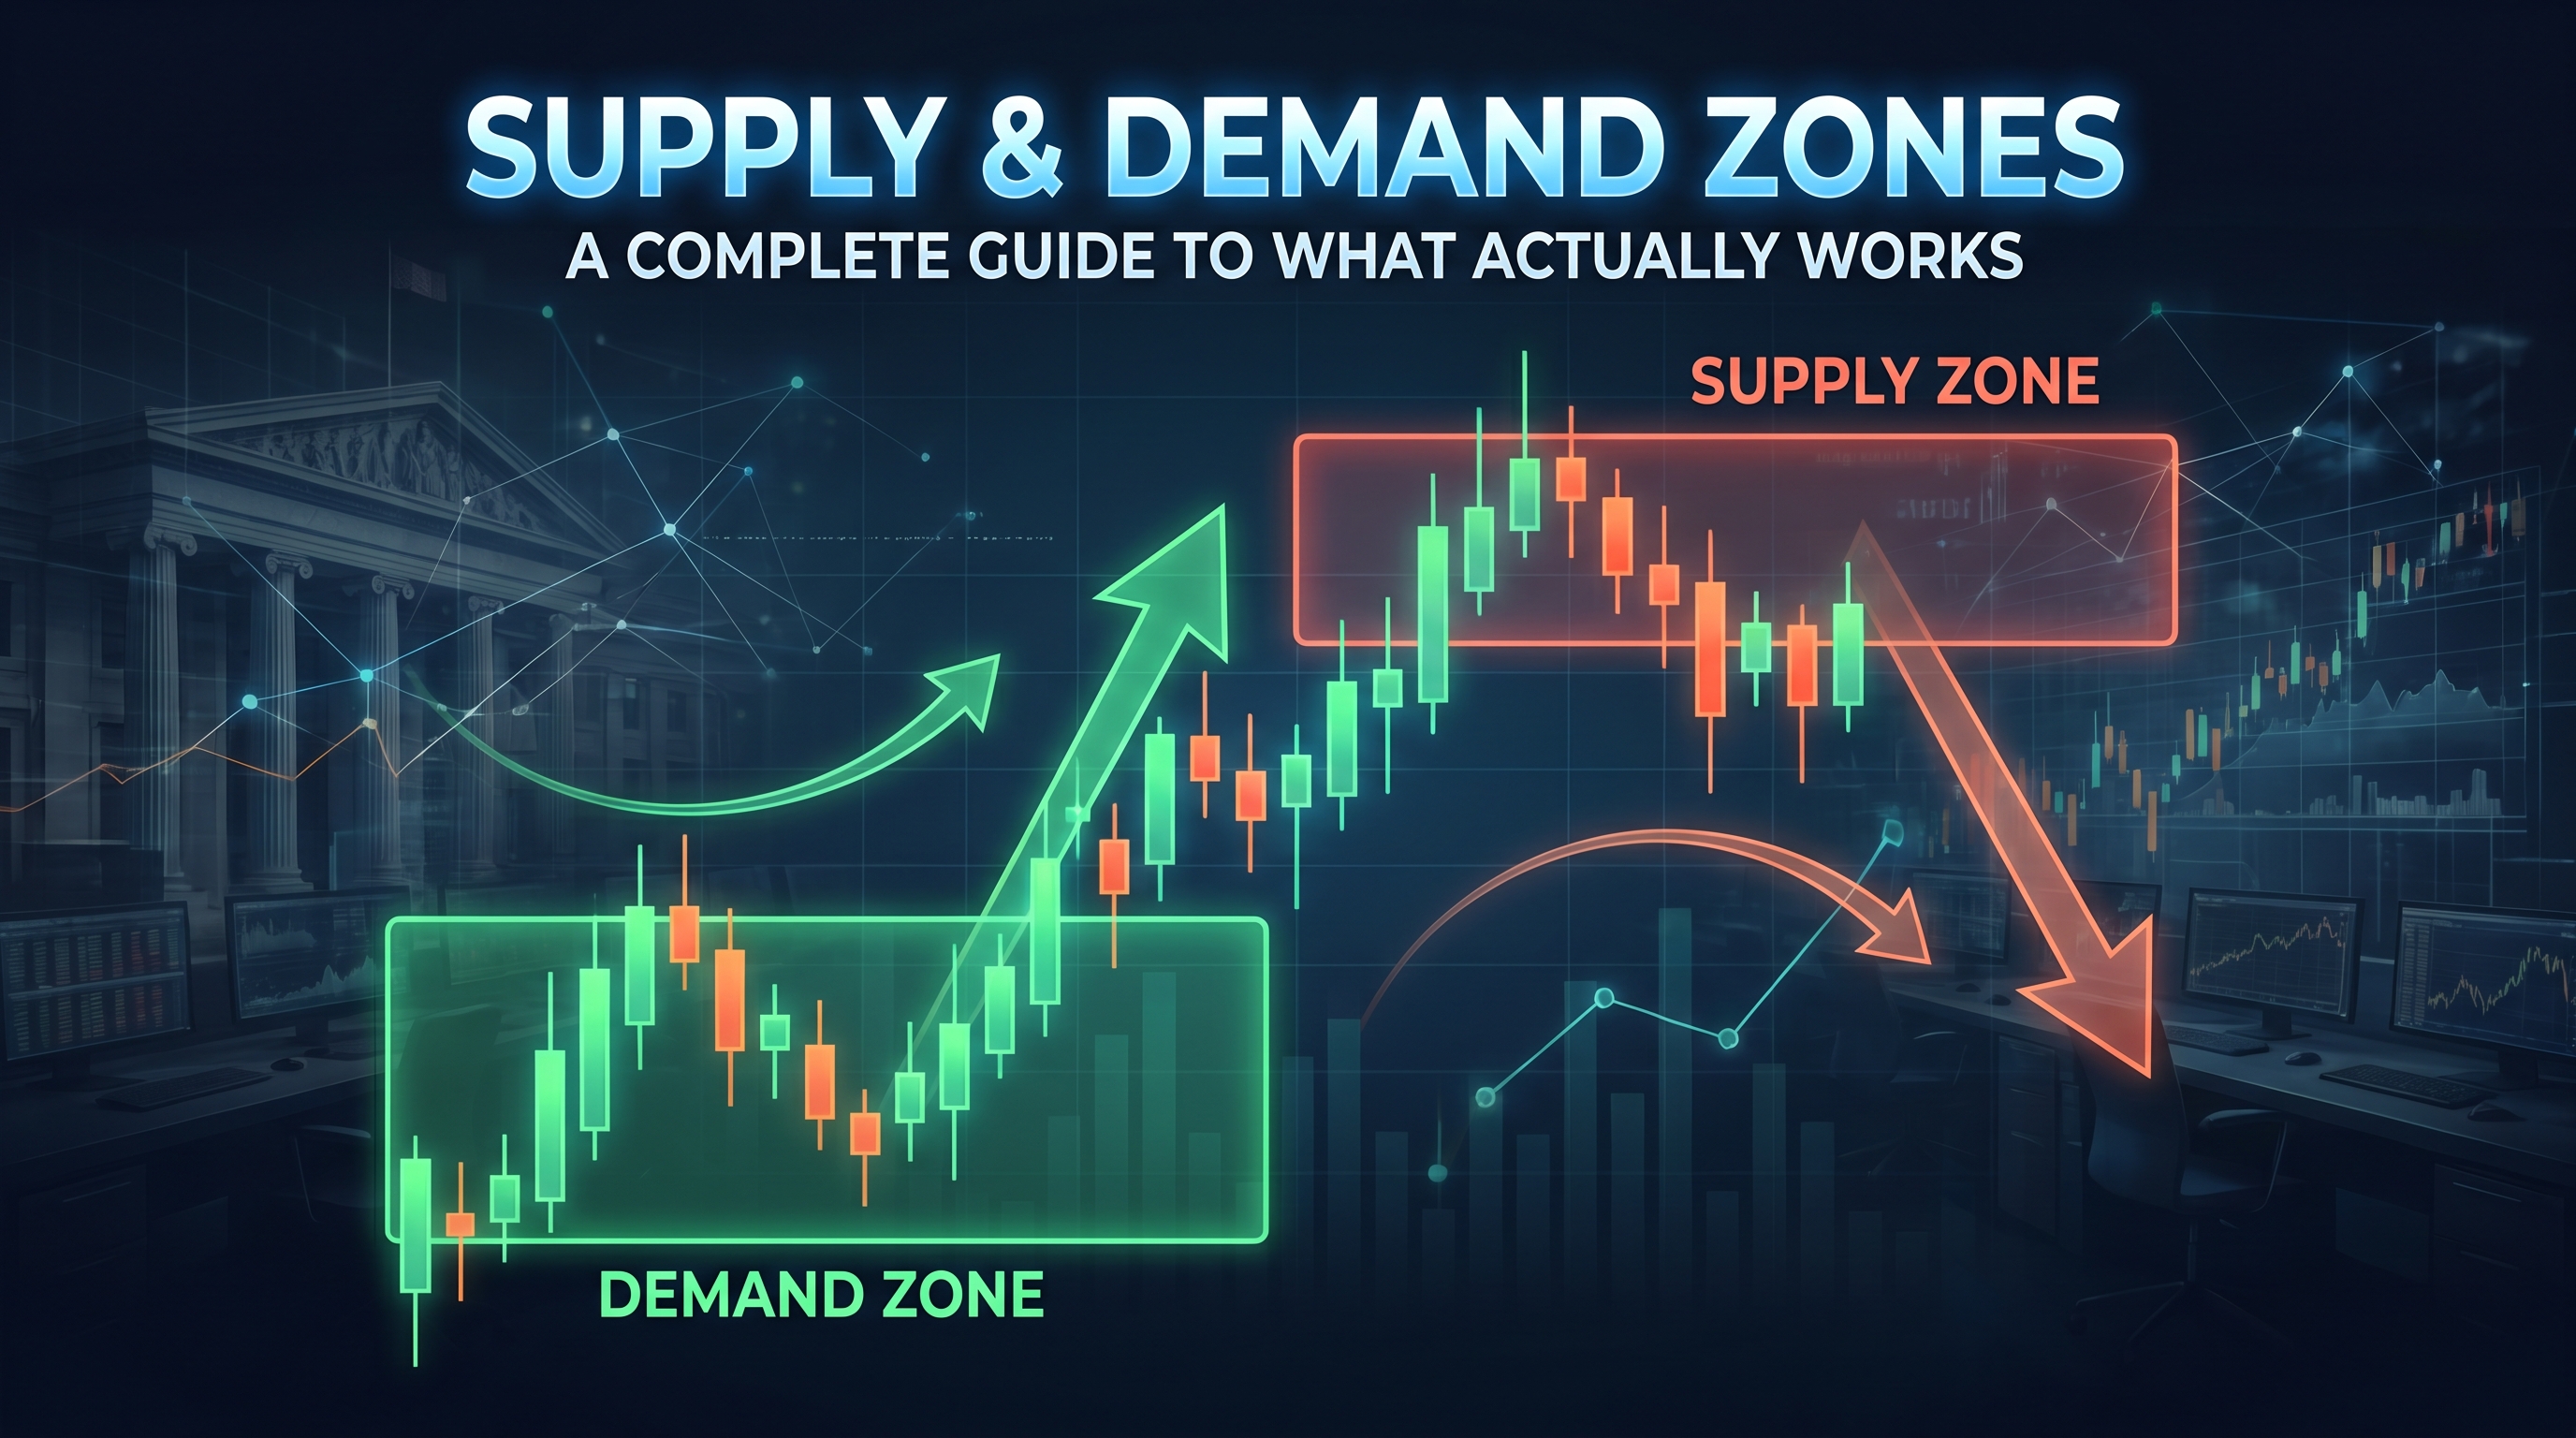
Before learning how to draw supply and demand zones, you must understand what they represent. A supply zone is an area where selling pressure previously overwhelmed buying pressure, causing price to drop sharply. Conversely, a demand zone is where buying pressure dominated, resulting in a strong upward move.
:::key-concept Supply and demand zones are not just support and resistance lines. They are areas where institutional orders were placed, creating imbalances that caused significant price movements. :::
The Psychology Behind Zone Formation
When institutional traders need to buy or sell large positions, they can't do it all at once without moving the market against themselves. Instead, they accumulate or distribute their positions over time within specific price ranges. These ranges become our supply and demand zones.
For a demand zone to form, you need:
- A base or consolidation area where smart money accumulates positions
- A strong, impulsive move away from this base
- Minimal or no retest of the zone (fresh zones are stronger)
For supply zones, the process is reversed:
- A base where smart money distributes positions
- A strong bearish impulse away from the zone
- Ideally no prior retests
:::example Imagine a major bank wanting to buy $100 million worth of EUR/USD. If they placed this order all at once, it would spike the price immediately. Instead, they slowly accumulate over several hours or days within a tight range (creating a demand zone), then once their position is complete, the buying pressure lifts and price moves impulsively higher. :::
Zone Strength Indicators
Not all supply and demand zones are created equal. Strong zones typically exhibit:
- Sharp, impulsive moves away from the zone
- High volume during zone formation (when visible)
- Time spent in the zone (more time = more orders)
- Number of touches (fewer touches = stronger zone)
- Distance traveled after leaving the zone
The Step-by-Step Process to Draw Effective Zones
Mastering how to draw supply and demand zones requires a systematic approach. Follow this proven methodology to identify zones that actually work in live trading conditions.
Step 1: Identify the Impulse Move
Start by scanning your charts for strong, impulsive price movements. These moves should stand out clearly and represent significant changes in market sentiment. Look for:
- Candles with large bodies and small wicks
- Multiple consecutive candles in the same direction
- Moves that break through previous structure
- Volume spikes (if available on your platform)
:::tip Use multiple timeframes to confirm impulse moves. What looks impulsive on a 5-minute chart might just be noise when viewed on a 1-hour chart. :::
Step 2: Trace Back to the Origin
Once you've identified an impulse move, trace back to find where it originated. This is your potential zone. Look for:
- The last area of consolidation before the impulse
- Where price "rested" before the big move
- Areas showing signs of accumulation or distribution
Step 3: Mark the Zone Boundaries
When learning how to draw supply and demand zones, precision in marking boundaries is crucial:
For Demand Zones:
- Upper boundary: The highest point of the base/consolidation
- Lower boundary: The lowest point before the impulsive move up
For Supply Zones:
- Upper boundary: The highest point before the impulsive move down
- Lower boundary: The lowest point of the distribution area
:::warning Avoid making zones too wide. If your zone encompasses more than 2-3% of the current price, it's probably too large to be effective. :::
Step 4: Validate with Multiple Timeframes
Always confirm your zones across different timeframes:
- Higher timeframes for overall market structure
- Lower timeframes for precise entry and exit points
- Current timeframe for trade management
A zone that appears on multiple timeframes carries more weight and is more likely to hold when tested.
:::example If you identify a demand zone on the 1-hour chart, check if the same area shows significance on the 4-hour and daily charts. If it aligns with a major support level or previous reaction point on higher timeframes, the zone becomes much more powerful. :::
Identifying High-Quality vs Low-Quality Zones
Not every area that looks like a supply or demand zone will actually work in practice. Learning to distinguish between high-quality and low-quality zones is essential for profitable trading.
Characteristics of High-Quality Zones
Strong Impulse Away: The move away from the zone should be decisive and strong. Look for:
- Large candles with minimal wicks
- Consecutive moves in the same direction
- Breakouts through significant levels
- Volume confirmation (when available)
Fresh Zones: Zones that haven't been retested are generally stronger because:
- Orders may still be waiting at these levels
- No profit-taking has occurred yet
- Smart money positions remain intact
Significant Time in Zone: The more time price spends forming the base, the more orders accumulate:
- Multiple hours on intraday charts
- Several days on daily charts
- Weeks or months on weekly charts
Red Flags for Low-Quality Zones
Multiple Retests: Zones that have been tested multiple times lose strength because:
- Orders get filled on each retest
- Profit-taking occurs
- Smart money may have already exited
Weak Impulse Moves: If the move away from the zone is slow and grinding:
- It may not represent institutional activity
- The zone might be retail-driven
- Future reactions may be weak or non-existent
Overlapping with Major News: Zones formed during major news events may be:
- Driven by emotion rather than smart money
- Less likely to hold during future tests
- Influenced by one-time events rather than ongoing supply/demand
:::key-concept Quality over quantity is crucial when marking zones. It's better to have fewer, high-quality zones than numerous weak ones cluttering your charts. :::
Common Mistakes and How to Avoid Them
Even experienced traders make errors when learning how to draw supply and demand zones. Here are the most common mistakes and how to avoid them.
Mistake 1: Drawing Zones Too Wide
Many traders create zones that are too large, reducing their effectiveness:
The Problem: Wide zones make it difficult to:
- Determine precise entry points
- Set appropriate stop losses
- Calculate risk-reward ratios
The Solution:
- Focus on the core area where the most activity occurred
- Use candlestick bodies rather than wicks for boundaries
- Keep zones tight and specific
Mistake 2: Ignoring Market Structure
Drawing zones without considering overall market structure leads to poor trade selection:
The Problem:
- Trading against the trend
- Missing higher timeframe resistance/support
- Ignoring major market levels
The Solution:
- Always analyze higher timeframes first
- Ensure zones align with market structure
- Consider the broader market context
:::warning A perfect demand zone in a strong downtrend may still fail because the overall market pressure is bearish. Context is everything in trading. :::
Mistake 3: Overcomplicating the Process
Some traders add too many rules and indicators, making zone identification overly complex:
The Problem:
- Analysis paralysis
- Missing clear opportunities
- Confusing signals
The Solution:
- Keep your approach simple and consistent
- Focus on price action first
- Add indicators only if they improve accuracy
Mistake 4: Not Adapting to Different Market Conditions
Zone effectiveness varies across different market environments:
Trending Markets:
- Supply zones work better in downtrends
- Demand zones work better in uptrends
- Zones against the trend often fail
Ranging Markets:
- Both supply and demand zones are effective
- Look for zones at range extremes
- Multiple retests are more common
Advanced Zone Drawing Techniques
Once you've mastered the basics of how to draw supply and demand zones, these advanced techniques can enhance your analysis and improve your trading results.
Zone Confluence Analysis
The most powerful zones often occur where multiple factors converge:
Fibonacci Confluence:
- Zones that align with key Fibonacci levels (38.2%, 50%, 61.8%)
- Combine retracement and extension levels
- Look for multiple Fibonacci confluences
Moving Average Confluence:
- Zones near dynamic support/resistance
- 20, 50, and 200-period moving averages
- Multiple timeframe MA confluence
Previous Structure Confluence:
- Old support becoming resistance (and vice versa)
- Historical significant levels
- Round number psychological levels
:::example A demand zone that aligns with the 61.8% Fibonacci retracement, the 200-period moving average, and a previous significant high has multiple reasons to hold, making it a high-probability trading opportunity. :::
Volume-Based Zone Refinement
When volume data is available, use it to refine your zones:
High Volume Areas:
- More significant than low volume zones
- Indicate genuine institutional interest
- Likely to provide stronger reactions
Volume Profile Analysis:
- Use volume profile to identify high-volume nodes
- Look for volume gaps (areas of low volume)
- Combine with traditional zone analysis
Time-Based Zone Strength
Consider the time element when evaluating zones:
Age of the Zone:
- Fresher zones are generally stronger
- Old zones may have less remaining orders
- Consider the timeframe when assessing age
Session-Based Analysis:
- Zones formed during high-activity sessions (London, New York open)
- Consider the trading session when zones were created
- Account for holiday and low-liquidity periods
Institutional Order Flow Integration
Advanced traders integrate order flow concepts:
Order Block Analysis:
- Identify the last opposing candle before impulsive moves
- Look for institutional order blocks within zones
- Consider fair value gaps and liquidity voids
Smart Money Concepts:
- Identify break of structure points
- Look for liquidity sweeps before zone formation
- Consider change of character in price action
:::tip Combine traditional supply and demand analysis with modern smart money concepts for a more complete picture of institutional activity. :::
Conclusion
Mastering how to draw supply and demand zones that actually work requires practice, patience, and a systematic approach. The key is understanding that these zones represent areas where institutional money has previously acted and is likely to act again. By following the step-by-step process outlined in this guide, focusing on zone quality over quantity, and avoiding common mistakes, you'll develop the skills to identify high-probability trading opportunities.
Remember that zone analysis is just one component of a complete trading system. Always combine your supply and demand analysis with proper risk management, position sizing, and an understanding of overall market structure. The most successful traders use zones as part of a broader strategy that includes multiple confirmations and sound money management principles.
Start practicing these techniques on historical charts before applying them to live trading. Take the time to study how zones behave across different market conditions and timeframes. With consistent practice and application, you'll develop an intuitive feel for identifying the zones that truly matter and can significantly improve your trading results.
Ready to master supply and demand zone analysis? Begin by practicing these techniques on your favorite trading instruments. Start with higher timeframes to identify major zones, then drill down to lower timeframes for precise entries. Remember, quality zone identification is a skill that improves with experience, so be patient with yourself as you develop this crucial trading ability.