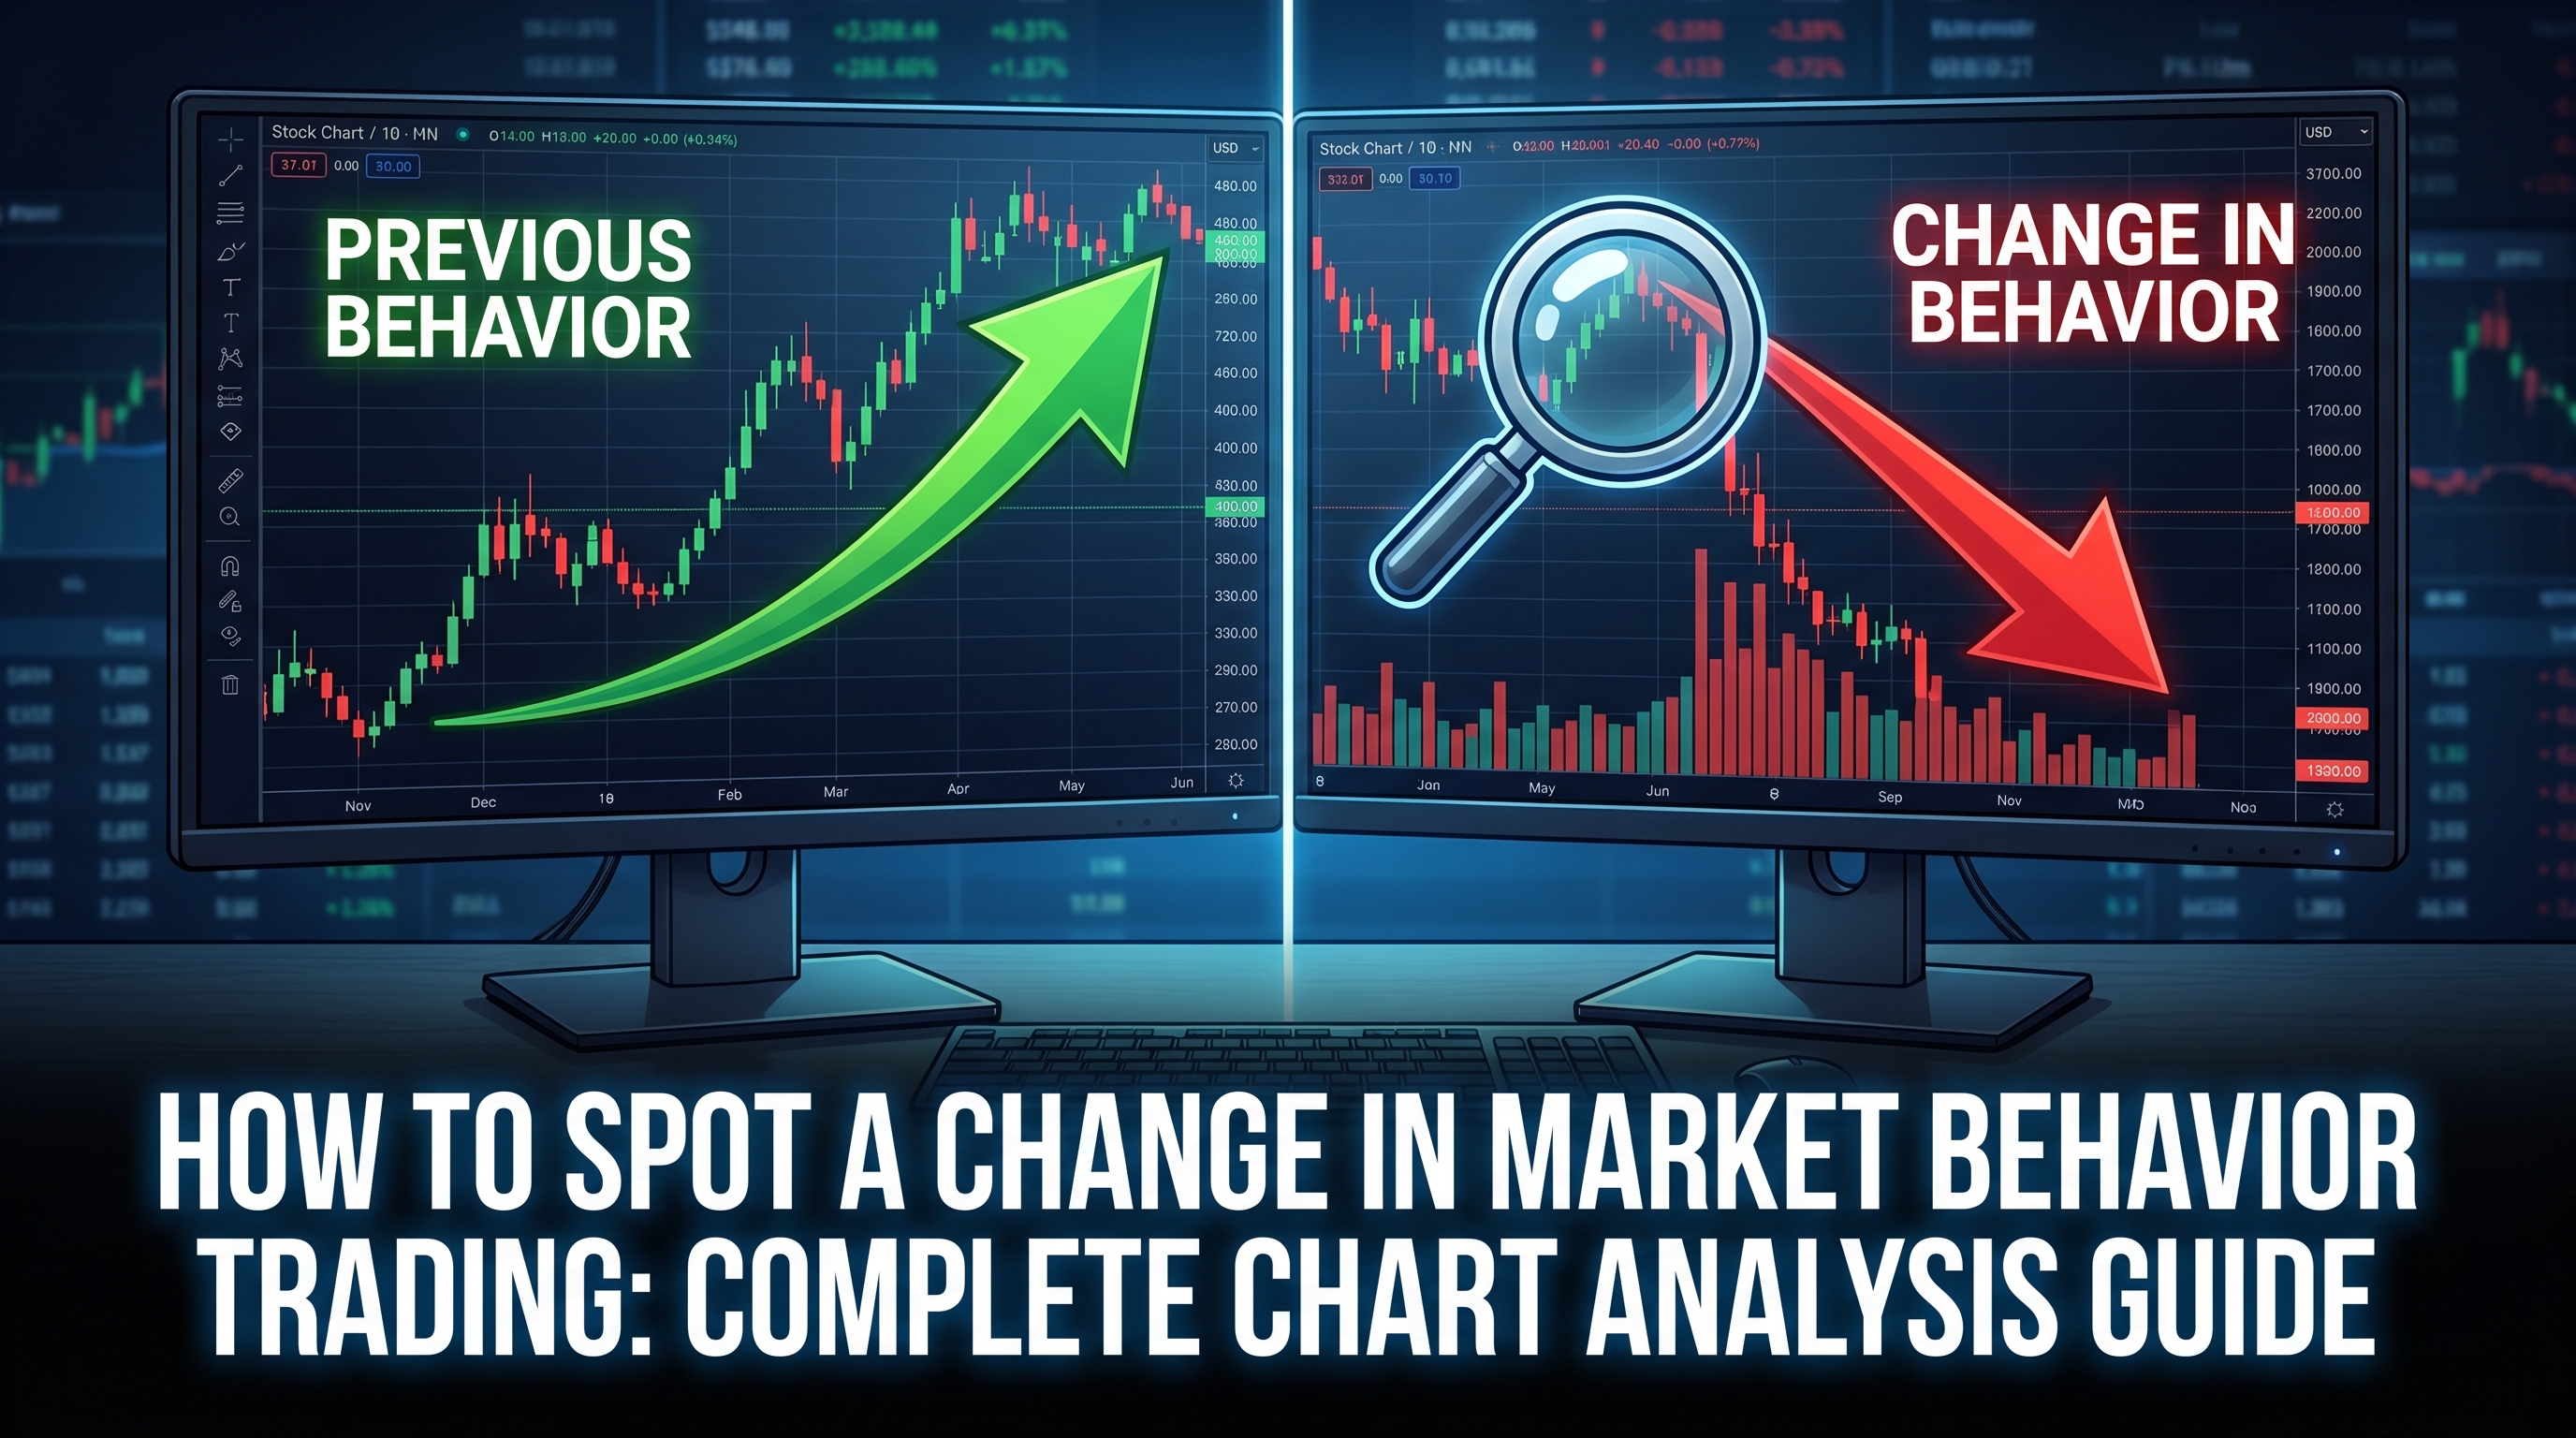
# How to Spot a Change in Market Behavior Trading: Complete Chart Analysis Guide
Successful trading hinges on your ability to read market sentiment and recognize when conditions are shifting. The ability to identify a change in market behavior trading early can be the difference between catching a major move and being caught off-guard by market reversals. This comprehensive guide will teach you how to spot these crucial behavioral shifts using chart analysis techniques that professional traders rely on.
Table of Contents
1. [Understanding Market Behavior Basics](#understanding-market-behavior-basics) 2. [Key Indicators of Behavioral Changes](#key-indicators-of-behavioral-changes) 3. [Volume Analysis for Market Shifts](#volume-analysis-for-market-shifts) 4. [Price Action Signals That Matter](#price-action-signals-that-matter) 5. [Advanced Pattern Recognition](#advanced-pattern-recognition) 6. [Practical Application Strategies](#practical-application-strategies) 7. [Common Mistakes to Avoid](#common-mistakes-to-avoid)
Understanding Market Behavior Basics
Market behavior refers to the collective actions and sentiment of all participants trading a particular instrument. When this behavior shifts, it often signals the beginning of new trends, the end of existing ones, or periods of increased volatility.
:::key-concept Market behavior changes occur when the balance between buyers and sellers shifts significantly, leading to new price dynamics and trading patterns. :::
The Psychology Behind Market Changes
Markets are driven by human emotions: fear, greed, hope, and panic. These emotions create identifiable patterns on charts that experienced traders can recognize. When market sentiment shifts from bullish to bearish (or vice versa), it leaves footprints in the form of:
- Changed price action patterns
- Altered volume characteristics
- Shift in market structure
- Modified volatility patterns
Types of Market Behavior Changes
There are three primary types of behavioral shifts to watch for:
1. Trend Continuation Changes: When the market gathers strength to continue in its current direction 2. Reversal Changes: When the market prepares to move in the opposite direction 3. Consolidation Changes: When the market moves from trending to sideways movement
Key Indicators of Behavioral Changes
Spotting a change in market behavior trading requires monitoring several key indicators simultaneously. These signals work best when they converge, providing multiple confirmations of a shift.
Market Structure Breaks
Market structure refers to the pattern of higher highs and higher lows (in an uptrend) or lower highs and lower lows (in a downtrend). A break in this structure is one of the earliest signs of behavioral change.
:::example In an uptrend, if price fails to make a new higher high and instead breaks below the previous higher low, this structure break suggests the bullish behavior is weakening. :::
Momentum Divergences
Divergences occur when price and momentum indicators move in opposite directions. This disconnect often signals that the current trend is losing steam:
- Bullish Divergence: Price makes lower lows while indicators make higher lows
- Bearish Divergence: Price makes higher highs while indicators make lower highs
Support and Resistance Level Behavior
How price interacts with key support and resistance levels reveals changing market sentiment:
- False Breakouts: When price breaks through a level but quickly reverses, suggesting weak conviction
- Failure to Test: When price doesn't even attempt to test a previously significant level
- Changed Reaction: When a former support becomes resistance or vice versa
:::warning Don't rely on single indicator signals. Always look for confluence between multiple indicators before concluding that market behavior has changed. :::
Volume Analysis for Market Shifts
Volume is one of the most reliable indicators for confirming a change in market behavior trading. It represents the level of participation and conviction behind price movements.
Volume Patterns That Signal Change
1. Climactic Volume: Extremely high volume often marks the end of a trend 2. Declining Volume: Decreasing participation suggests waning interest in current direction 3. Volume Expansion: Sudden increases in volume can signal the beginning of new moves 4. Volume at Key Levels: How volume behaves at support/resistance reveals market conviction
Volume Spread Analysis (VSA) Principles
VSA examines the relationship between volume, price spread (range), and closing price:
- High Volume + Wide Spread + Weak Close: Suggests distribution (selling pressure)
- High Volume + Narrow Spread: Often indicates absorption (smart money accumulating)
- Low Volume + Wide Spread: Typically shows lack of institutional interest
:::tip Pay special attention to volume when price approaches significant levels. High volume rejections often signal strong behavioral shifts. :::
Institutional vs. Retail Volume Signatures
Learning to distinguish between institutional and retail trading activity helps identify meaningful behavioral changes:
- Institutional Activity: Smooth, consistent volume with purposeful price action
- Retail Activity: Spiky, emotional volume often associated with news events
Price Action Signals That Matter
Price action provides the clearest picture of market behavior changes. By focusing on how price moves rather than where it moves, traders can identify shifts in sentiment.
Candlestick Pattern Analysis
Certain candlestick patterns are particularly effective at signaling behavioral changes:
Reversal Patterns
- Doji: Indecision that often precedes direction changes
- Hammer/Shooting Star: Rejection at key levels
- Engulfing Patterns: Strong shifts in sentiment
Continuation vs. Reversal Context
The same pattern can signal different behaviors depending on context:
- At trend extremes: Often signals reversal
- During pullbacks: Usually indicates continuation
- At consolidation boundaries: May signal breakout direction
:::example A hammer candlestick at a major support level after a downtrend suggests buyers are stepping in, indicating a potential change from bearish to bullish behavior. :::
Gap Analysis
Gaps in price action often signal significant behavioral changes:
- Exhaustion Gaps: Appear near trend ends, showing final push
- Breakaway Gaps: Signal strong new directional moves
- Continuation Gaps: Confirm ongoing trend strength
Price Velocity Changes
The speed of price movement reveals changing market dynamics:
- Acceleration: Suggests increasing conviction in current direction
- Deceleration: Often precedes consolidation or reversal
- Parabolic Moves: Usually unsustainable and signal exhaustion
Advanced Pattern Recognition
Experienced traders recognize complex patterns that signal behavioral changes before they become obvious to the majority.
Smart Money Concepts
Understanding how institutional money moves reveals behavioral shifts:
Order Blocks
Areas where institutions placed large orders, creating support/resistance levels that often hold significance in future price action.
Fair Value Gaps
Imbalances in price action that institutions often return to fill, creating predictable behavioral patterns.
Liquidity Sweeps
When smart money briefly moves price to trigger stop losses before reversing, indicating a change in their directional bias.
:::key-concept Smart money leaves footprints in the form of specific price patterns. Learning to read these patterns gives insight into institutional behavior changes. :::
Wyckoff Method Applications
The Wyckoff method provides a framework for understanding market cycles and behavioral phases:
1. Accumulation: Smart money quietly gathers positions 2. Markup: Public participation drives prices higher 3. Distribution: Smart money exits positions 4. Markdown: Prices decline as support disappears
Elliott Wave Principle
Wave patterns reflect changing market psychology:
- Impulse Waves: Show strong directional conviction
- Corrective Waves: Indicate consolidation or reversal behavior
- Wave Extensions: Signal accelerating behavioral changes
Practical Application Strategies
Knowing how to identify behavioral changes is only valuable if you can apply this knowledge practically in your trading.
Multi-Timeframe Analysis
Behavioral changes often appear first on longer timeframes before manifesting on shorter ones:
1. Weekly Charts: Identify major behavioral shifts 2. Daily Charts: Confirm the direction and timing 3. 4-Hour Charts: Fine-tune entry and exit points 4. 1-Hour Charts: Manage positions and risk
:::tip Start your analysis on higher timeframes to identify the dominant behavioral bias, then work down to shorter timeframes for execution. :::
Creating a Behavioral Change Checklist
Develop a systematic approach:
- [ ] Market structure break confirmed
- [ ] Volume supporting the move
- [ ] Key level reaction changed
- [ ] Momentum divergence present
- [ ] Multiple timeframe alignment
- [ ] Risk/reward ratio favorable
Position Sizing for Behavioral Changes
Adjust position sizes based on confidence level:
- High Confidence: Multiple confirmations present (larger position)
- Medium Confidence: Some confirmations missing (moderate position)
- Low Confidence: Early signals only (small position or wait)
Risk Management During Transitions
Behavioral change periods often involve increased volatility:
- Use wider stops to account for increased movement
- Consider reducing position sizes temporarily
- Avoid trading during major news events that might mask behavioral signals
- Have clear exit strategies for both success and failure scenarios
:::warning Behavioral changes can be false signals. Always have a plan for what to do if your analysis is wrong. :::
Common Mistakes to Avoid
Even experienced traders make errors when trying to identify behavioral changes. Avoiding these common mistakes will improve your success rate.
Over-Analysis Paralysis
Seeking too many confirmations can cause you to miss opportunities:
- Set clear criteria for what constitutes sufficient confirmation
- Accept that no trade setup is 100% certain
- Focus on high-probability setups rather than perfect ones
Ignoring Market Context
Not all behavioral changes are created equal:
- Consider overall market conditions
- Account for seasonal patterns
- Understand the impact of economic events
- Recognize when markets are in transition vs. established trends
Emotional Decision Making
Fear and greed can cloud judgment:
- Stick to predetermined criteria
- Don't chase moves that have already started
- Avoid revenge trading after missed opportunities
- Keep detailed records of what worked and what didn't
Timeframe Confusion
Mixing signals from different timeframes:
- Establish which timeframe is your primary decision-making frame
- Use other timeframes only for confirmation or refinement
- Don't let short-term noise override longer-term behavioral signals
Insufficient Testing
Not validating your behavioral change identification methods:
- Backtest your criteria on historical data
- Paper trade new approaches before risking capital
- Keep statistics on success rates and profitability
- Continuously refine your approach based on results
Conclusion
Mastering the ability to spot a change in market behavior trading is a crucial skill that separates successful traders from the rest. By combining volume analysis, price action signals, and pattern recognition, you can identify these shifts early and position yourself advantageously.
Remember that behavioral changes don't happen overnight. They develop over time and leave multiple clues on your charts. The key is developing a systematic approach that considers multiple factors while maintaining the flexibility to adapt as market conditions evolve.
Success in identifying behavioral changes comes through practice and experience. Start by analyzing historical charts to identify past behavioral shifts, then apply your knowledge to current market conditions. Keep detailed records of your observations and continuously refine your approach based on results.
The markets are constantly evolving, driven by the collective emotions and decisions of millions of participants. By learning to read these behavioral shifts, you gain insight into the market's next likely move, giving you a significant edge in your trading endeavors.
Ready to improve your chart analysis skills? Start practicing these behavioral change identification techniques on your preferred trading platform today. Begin with one market and one timeframe, then gradually expand your analysis as you become more confident in spotting these crucial market shifts.