# The Beginner's Fallacy: Why Too Many Indicators on Chart Kill Your Trading
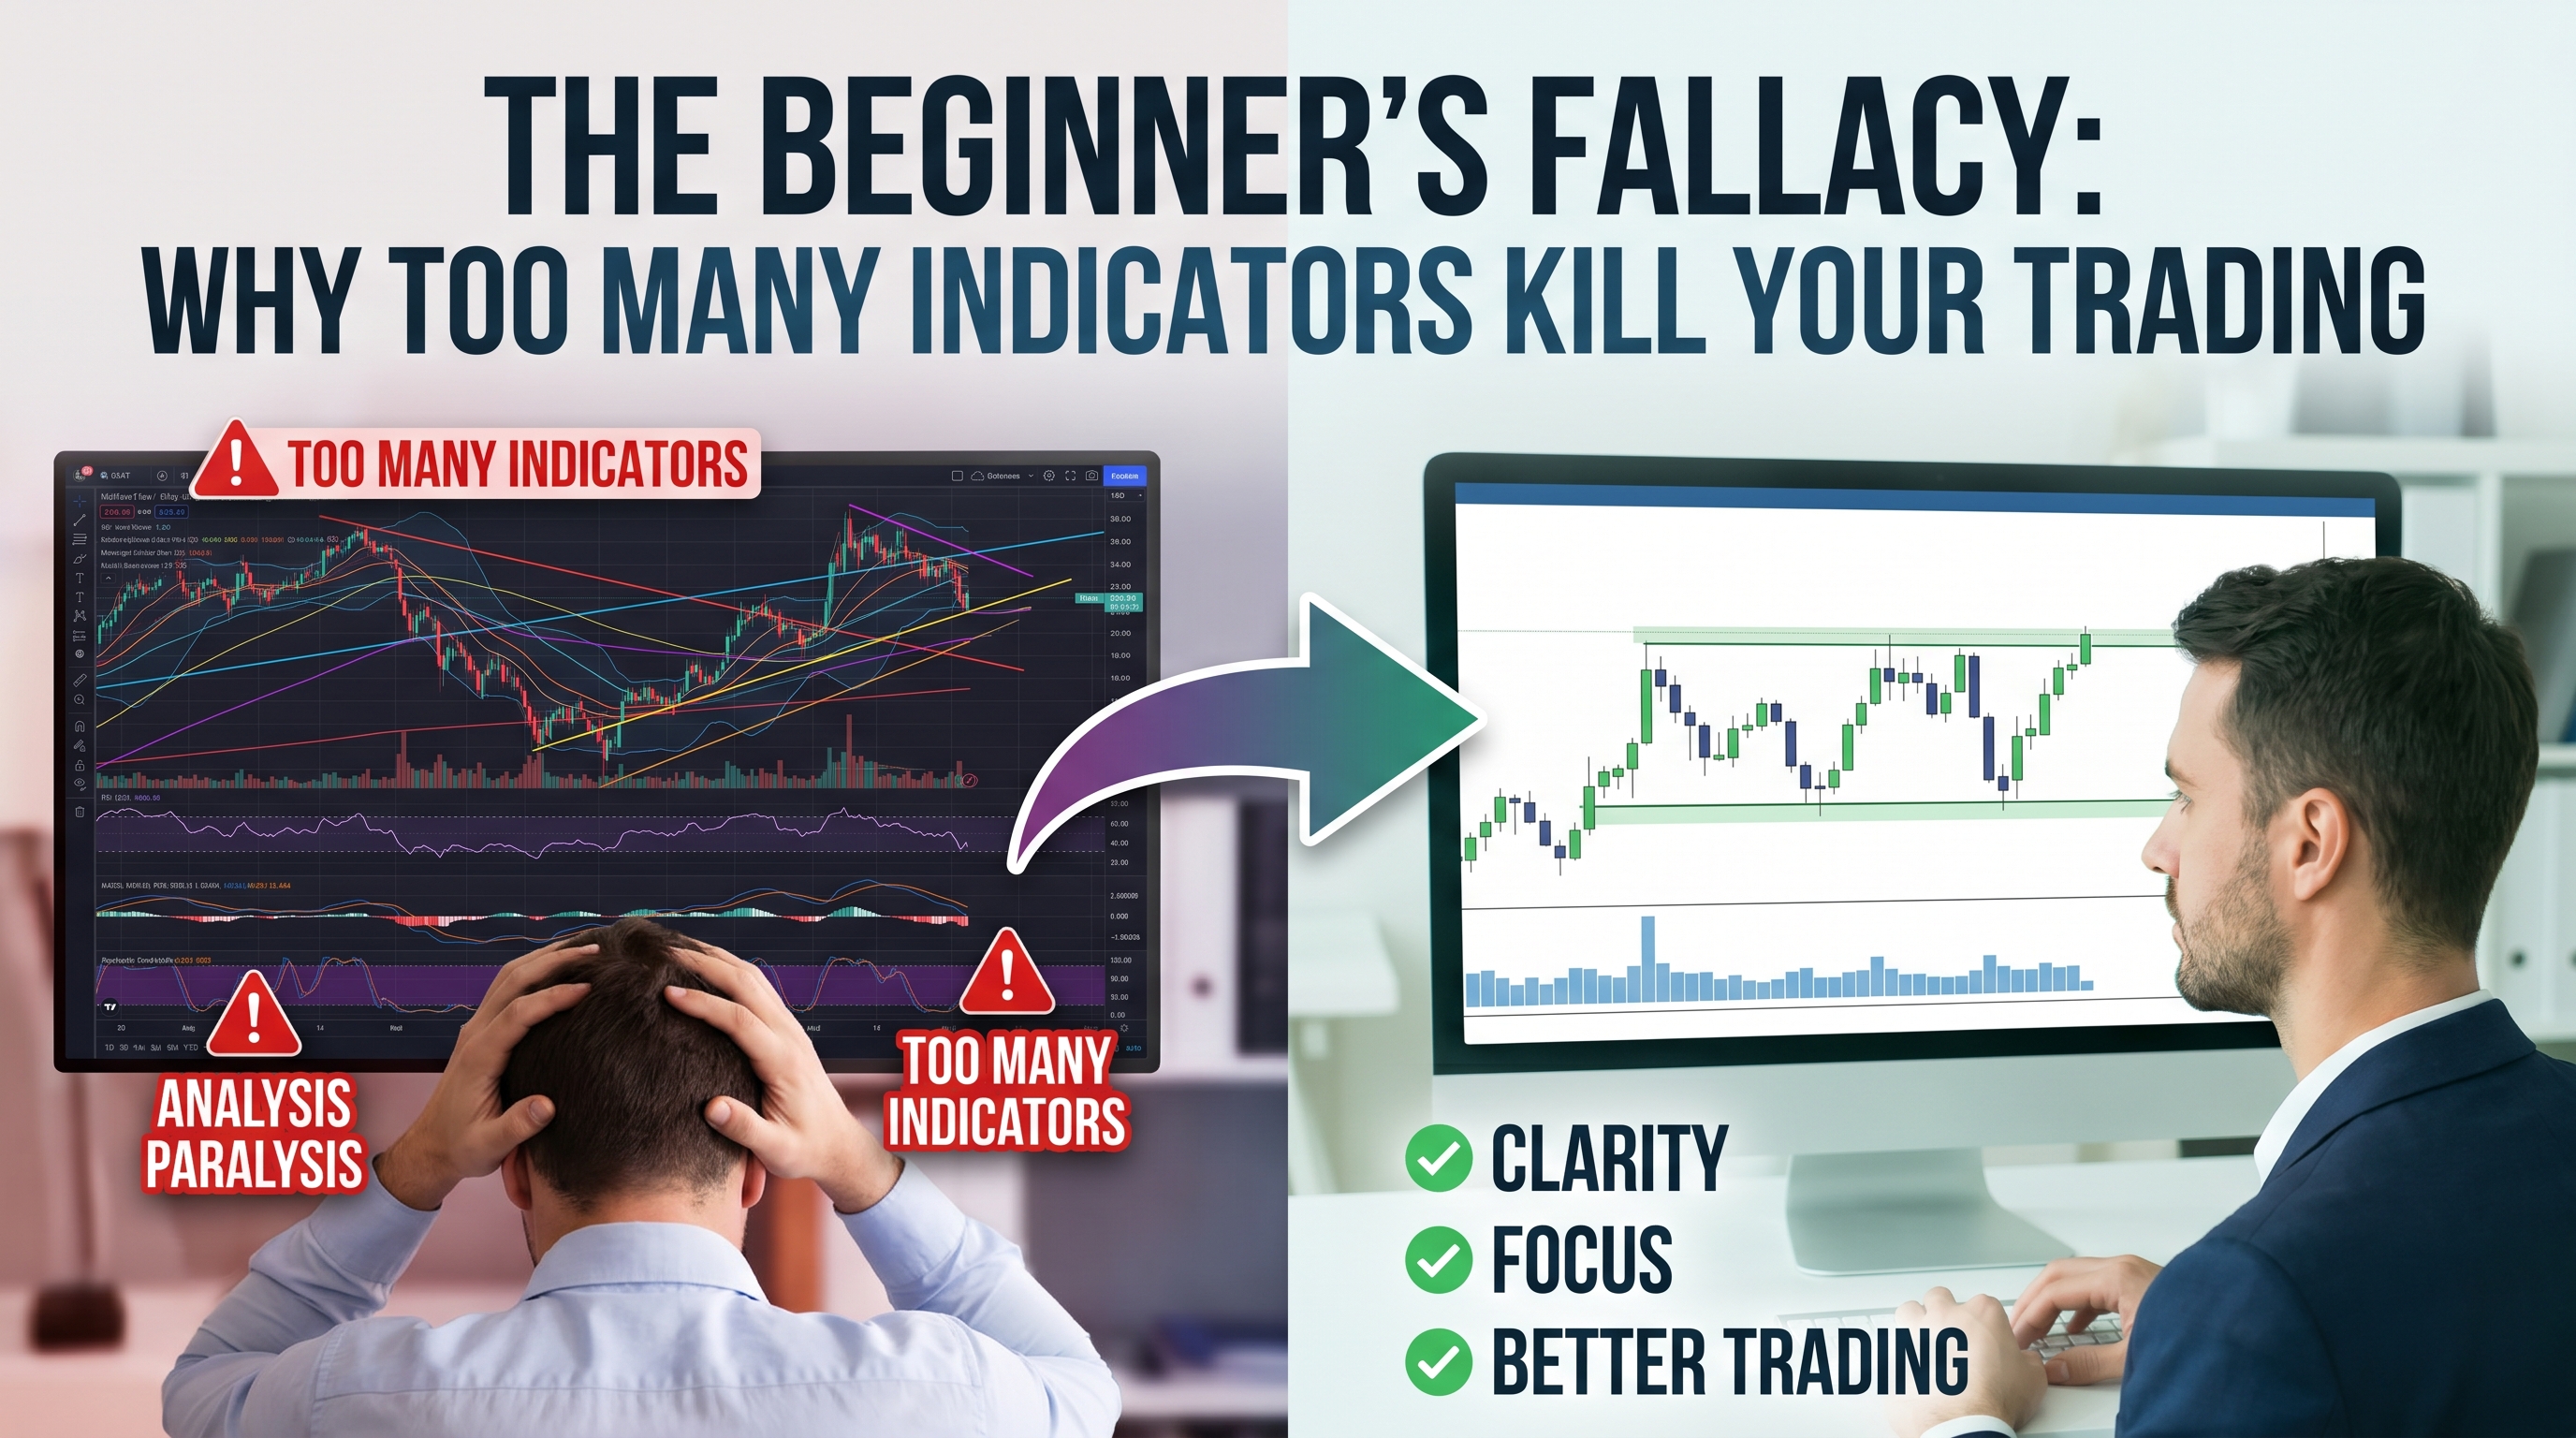
One of the most common mistakes new traders make is believing that more indicators equal better trading results. This misconception leads to cluttered charts filled with oscillators, moving averages, and various technical tools that create confusion rather than clarity. The truth is that having too many indicators on chart often leads to analysis paralysis and poor decision-making.
In this comprehensive guide, we'll explore why the "more is better" approach fails in trading, examine the psychological factors behind indicator addiction, and provide you with a practical framework for simplifying your charts while improving your trading performance.
Table of Contents
- [The Indicator Overload Problem](#the-indicator-overload-problem)
- [Why Simplicity Beats Complexity](#why-simplicity-beats-complexity)
- [The Psychology Behind Indicator Addiction](#the-psychology-behind-indicator-addiction)
- [Building an Effective Minimal Setup](#building-an-effective-minimal-setup)
- [Common Indicator Combinations That Fail](#common-indicator-combinations-that-fail)
- [Transitioning to Clean Chart Analysis](#transitioning-to-clean-chart-analysis)
The Indicator Overload Problem
When traders first discover the world of technical analysis, they're often overwhelmed by the sheer number of indicators available. Most charting platforms offer dozens of tools, each promising to unlock the secrets of market movement. This abundance creates a false sense of security – surely using multiple indicators provides better confirmation and reduces risk?
Unfortunately, the opposite is true. Having too many indicators on chart creates several critical problems:
:::warning Signal Confusion: Multiple indicators often provide conflicting signals, making it impossible to determine the best course of action. When your RSI shows oversold conditions while your MACD suggests selling, which signal do you follow? :::
The Lagging Effect
Most technical indicators are lagging by nature, meaning they react to price movement rather than predicting it. When you combine multiple lagging indicators, you're essentially layering delayed information on top of more delayed information. This creates an even greater lag between market reality and your analysis.
Information Redundancy
Many traders unknowingly use multiple indicators that measure similar market conditions. For example, using both RSI and Stochastic oscillators provides redundant information about momentum. Adding a third momentum indicator doesn't triple your edge – it triples your confusion.
:::example Real-World Scenario: A trader uses RSI, MACD, Bollinger Bands, moving averages, and volume indicators on a single chart. During a trending market, the moving averages suggest buying, RSI shows overbought conditions, MACD gives a sell signal, and Bollinger Bands indicate neutral conditions. Instead of clarity, this setup creates decision paralysis. :::
Why Simplicity Beats Complexity
Successful professional traders often use surprisingly simple setups. This isn't because they lack knowledge of complex indicators – it's because they understand that simplicity leads to better execution and clearer decision-making.
The Clarity Advantage
With fewer indicators cluttering your screen, you can focus on what matters most: price action and market structure. When you eliminate the noise created by too many indicators on chart, key support and resistance levels, trend lines, and chart patterns become much more visible.
:::key-concept The 80/20 Rule in Trading: Approximately 80% of your trading success comes from 20% of your analysis tools. The key is identifying which tools provide the most value and eliminating the rest. :::
Faster Decision Making
Simple setups enable faster decision-making because there are fewer variables to consider. In fast-moving markets, the ability to quickly assess conditions and act decisively often determines success or failure.
Reduced False Signals
Every indicator generates false signals periodically. When you use multiple indicators, you multiply the opportunities for false signals to occur. A clean chart approach helps you focus on high-probability setups rather than chasing every potential signal.
The Psychology Behind Indicator Addiction
Understanding why traders gravitate toward complex indicator combinations reveals important insights about trading psychology and how to overcome these tendencies.
The Security Blanket Effect
New traders often feel anxious about making trading decisions with limited information. Adding more indicators creates an illusion of certainty and control. However, this false security often leads to overconfidence in poor setups.
Fear of Missing Out (FOMO)
Traders worry they might miss important market information if they don't use every available tool. This FOMO drives them to add indicator after indicator, believing each addition provides crucial insight they can't afford to miss.
:::tip Overcoming Indicator FOMO: Remember that professional traders often use just 1-3 primary analysis tools. If simplicity works for professionals managing millions of dollars, it can work for you too. :::
The Complexity Bias
Humans naturally associate complexity with sophistication and effectiveness. In trading, this bias leads people to believe that complex indicator combinations must be superior to simple approaches. However, the market doesn't care about your indicator complexity – it only rewards accurate predictions and good execution.
Analysis Paralysis
When faced with too many indicators providing conflicting information, traders often freeze and fail to take action. This analysis paralysis can cause missed opportunities in trending markets or delayed exits during reversals.
Building an Effective Minimal Setup
Creating an effective minimal trading setup requires careful selection of tools that complement rather than compete with each other. Here's how to build a powerful yet simple analysis framework.
Start with Pure Price Action
Before adding any indicators, spend time analyzing pure price action. Look for:
- Support and resistance levels
- Trend lines and channels
- Chart patterns
- Candlestick formations
- Market structure breaks
:::example Clean Chart Analysis: On a daily EUR/USD chart, identify the major trend direction, key support/resistance levels, and recent swing highs/lows. This analysis alone often provides enough information for trading decisions. :::
The Three-Tool Rule
Limit yourself to a maximum of three indicators or analysis tools. This constraint forces you to choose only the most valuable tools for your trading style. A effective combination might include:
1. Price action analysis (primary) 2. One trend indicator (moving average or trend line) 3. One momentum tool (RSI, MACD, or volume)
Volume: The Universal Indicator
Volume deserves special mention because it's the one indicator that adds genuinely unique information to price analysis. Unlike price-derived indicators, volume shows the conviction behind price movements. High volume confirms breakouts while low volume suggests weak moves.
Choosing Complementary Tools
When selecting indicators, ensure they provide different types of information:
- Trend indicators: Moving averages, trend lines
- Momentum indicators: RSI, MACD
- Volatility indicators: Bollinger Bands, ATR
- Volume indicators: Volume, OBV
Avoid using multiple tools from the same category, as this creates redundancy rather than confirmation.
Common Indicator Combinations That Fail
Understanding which indicator combinations commonly lead to poor results helps traders avoid these pitfalls and develop more effective approaches.
The "Rainbow Chart" Syndrome
Some traders use multiple moving averages (5, 10, 20, 50, 100, 200) creating a "rainbow" effect on their charts. While this might look impressive, it often leads to:
- Conflicting signals when different timeframes disagree
- Visual clutter that obscures important price action
- Decision paralysis when multiple averages provide different indications
:::warning Avoid Indicator Redundancy: Using RSI, Stochastic, and Williams %R simultaneously is redundant since all three measure momentum. Choose one and master it instead. :::
The Oscillator Overload
Combining multiple oscillators (RSI, MACD, Stochastic, CCI) creates several problems:
- Conflicting overbought/oversold signals
- Difficulty determining which signal to follow
- Missed opportunities while waiting for all indicators to align
The "Confirmation" Trap
Many traders add indicators seeking "confirmation" of their initial analysis. However, this often leads to:
- Cherry-picking signals that support predetermined views
- Ignoring contrary evidence from other indicators
- Delayed entries while waiting for perfect alignment
Transitioning to Clean Chart Analysis
Moving from a cluttered, indicator-heavy approach to clean chart analysis requires patience and discipline. Here's a step-by-step process to make this transition successfully.
Phase 1: Audit Your Current Setup
Begin by honestly evaluating your current indicator usage:
1. List all indicators currently on your charts 2. Identify redundancies (multiple momentum indicators, etc.) 3. Assess effectiveness of each tool over your recent trades 4. Note conflicts where indicators provided opposing signals
Phase 2: Gradual Reduction
Rather than eliminating everything at once, gradually reduce indicator usage:
Week 1-2: Remove obvious redundancies Week 3-4: Eliminate your least effective indicators Week 5-6: Focus on your top 2-3 remaining tools Week 7+: Trade with your simplified setup
:::tip Practice on Demo First: Test your simplified setup on a demo account before risking real money. This builds confidence in your new approach. :::
Phase 3: Focus on Price Action
As you reduce indicator dependence, increase focus on price action elements:
- Candlestick patterns and formations
- Support and resistance levels
- Trend line analysis
- Market structure changes
- Volume confirmation
Phase 4: Performance Tracking
Monitor your trading performance throughout this transition:
- Win rate changes
- Average risk/reward ratios
- Decision speed improvements
- Stress levels while trading
- Overall profitability
:::key-concept The Clean Chart Advantage: Many traders find their performance improves significantly after reducing chart clutter. Cleaner charts lead to clearer thinking and better decision-making. :::
Developing Chart Reading Skills
As you eliminate indicators, invest time in developing advanced chart reading abilities:
Market Structure Analysis:
- Higher highs and higher lows (uptrend)
- Lower highs and lower lows (downtrend)
- Sideways consolidation patterns
Key Level Identification:
- Psychological price levels (round numbers)
- Previous swing highs and lows
- Areas of high volume/activity
- Fibonacci retracement levels
Pattern Recognition:
- Classic chart patterns (triangles, flags, head and shoulders)
- Candlestick reversal patterns
- Continuation vs. reversal formations
Building Confidence Without Indicators
The transition away from indicator dependence often creates anxiety. Build confidence through:
1. Historical chart analysis - Study past price movements without indicators 2. Paper trading with your simplified setup 3. Starting with longer timeframes where noise is reduced 4. Focusing on high-probability setups rather than trading frequency
Conclusion
The journey from indicator overload to clean chart analysis represents a crucial evolution in every trader's development. While it's natural to seek security in complex indicator combinations, the reality is that too many indicators on chart create more problems than they solve.
Successful trading isn't about having the most sophisticated setup – it's about understanding market dynamics, managing risk effectively, and executing your plan with discipline. Simple, clean charts enable all of these elements by providing clarity instead of confusion.
Remember that the market's most successful participants often use surprisingly simple approaches. By embracing minimalism in your chart analysis, you're following in the footsteps of professional traders who prioritize execution over complexity.
The transition to cleaner charts won't happen overnight, but the benefits – improved decision-making, faster execution, and reduced stress – make the effort worthwhile. Start your journey today by removing just one redundant indicator from your charts and notice the immediate improvement in clarity.
Ready to simplify your trading approach? Begin by identifying the most effective tool in your current setup and challenge yourself to trade using only that tool for the next week. You might be surprised by how much clearer the market becomes when you remove the noise of too many indicators on chart.