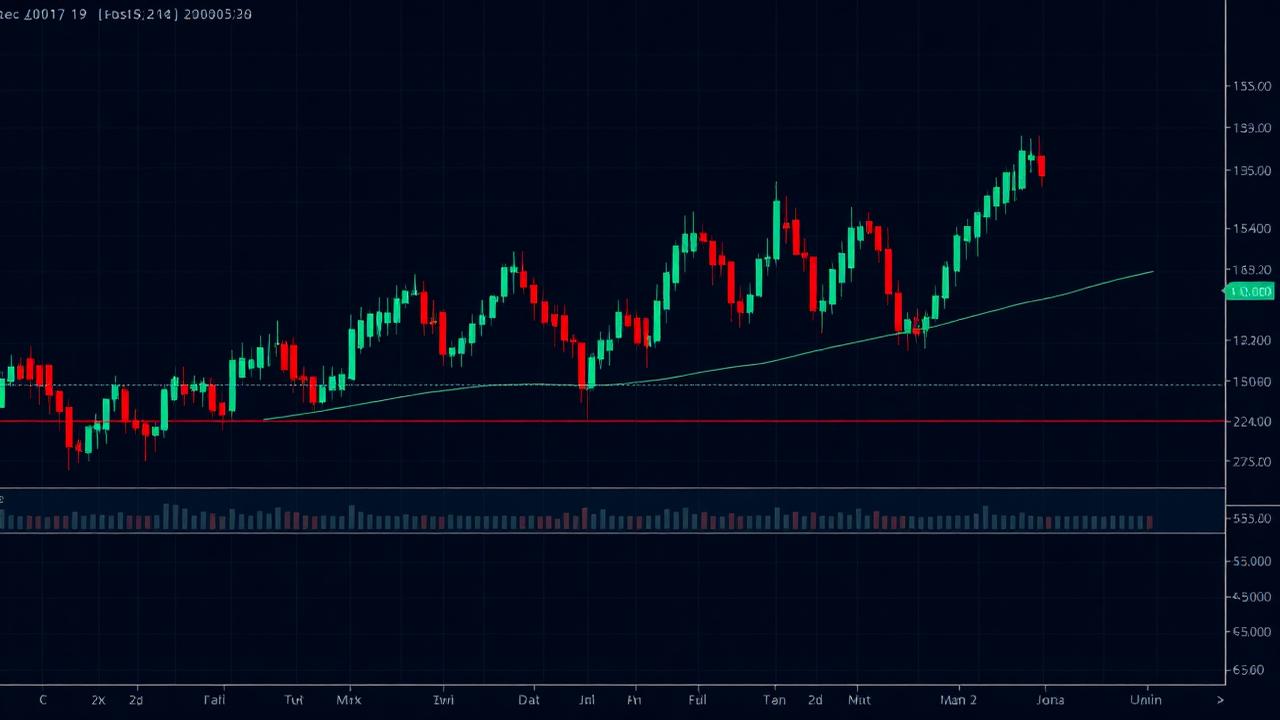
# Support and Resistance Trading: The Complete Guide
Support and resistance levels are the foundation of technical analysis and price action trading. Understanding how to identify, draw, and trade these key levels can dramatically improve your trading results, regardless of which market you trade or what timeframe you prefer.
This guide teaches you everything you need to know about support and resistance—from basic concepts to advanced trading strategies that professional traders use daily.
:::tip Core Concept: Support and resistance exist because market psychology creates memory. Price levels that mattered before tend to matter again. Learning to identify these levels gives you a significant edge. :::
Table of Contents
- [Understanding Support & Resistance](#understanding)
- [How to Identify Key Levels](#identification)
- [Drawing Support and Resistance](#drawing)
- [Role Reversal Concept](#role-reversal)
- [Trading Strategies](#strategies)
- [Advanced Concepts](#advanced)
- [Common Mistakes](#mistakes)
- [Practical Examples](#examples)
- [Getting Started](#getting-started)
---
Understanding Support and Resistance
What is Support?
Support is a price level where buying pressure is strong enough to prevent price from falling further. Think of it as a "floor" that price bounces off.
Why Support Forms:
- Buyers see value at this price and step in
- Previous buyers who sold want to buy back
- Psychological level (round numbers)
- Technical significance (previous low, trendline)
How Support Works: 1. Price falls toward support level 2. Buyers outnumber sellers 3. Buying pressure stops decline 4. Price bounces upward
What is Resistance?
Resistance is a price level where selling pressure is strong enough to prevent price from rising further. Think of it as a "ceiling" that price can't break through.
Why Resistance Forms:
- Sellers see price as too high (overbought)
- Previous buyers at this level want to break even
- Psychological level (round numbers)
- Technical significance (previous high, trendline)
How Resistance Works: 1. Price rises toward resistance level 2. Sellers outnumber buyers 3. Selling pressure stops rally 4. Price reverses downward
The Psychology Behind Support and Resistance
At Support (1.2000):
- Buyers who missed it at 1.2000 before get another chance
- Sellers who shorted at 1.2000 before want to cover (buy back)
- New buyers see value
- Result: Buying pressure increases as price approaches
At Resistance (1.2500):
- Buyers who bought at 1.2500 and price fell want to exit breakeven
- Sellers who shorted at 1.2500 before made money and want to repeat
- New sellers see price as extended
- Result: Selling pressure increases as price approaches
:::example Real-World Example: Stock falls from $50 to $40, where strong buying appears and price rallies. That $40 level is now support because: (1) Previous sellers want to buy back at same price, (2) New buyers see value, (3) $40 is now psychologically significant. :::
[↑ Back to Top](#table-of-contents)
---
How to Identify Key Levels
Types of Support and Resistance
1. Horizontal Levels (Most Common)
- Previous swing highs = resistance
- Previous swing lows = support
- Round numbers (100.00, 1.3000, 50.00)
- Historical significant prices
2. Trendlines (Dynamic Levels)
- Uptrend line connecting higher lows = support
- Downtrend line connecting lower highs = resistance
- Diagonal lines that price respects
3. Moving Averages (Dynamic Levels)
- 50-day and 200-day MAs commonly act as support/resistance
- Price tends to bounce off these averages
- Especially in trending markets
4. Fibonacci Levels
- 38.2%, 50%, 61.8% retracement levels
- Often coincide with support/resistance
- Used by many traders (self-fulfilling)
What Makes a Level Significant?
Strong Support/Resistance Has:
- Multiple touches (price bounced 2-3+ times)
- High volume at the level
- Round number significance
- Long time period (older levels = stronger)
- Visible on higher timeframes
Weak Support/Resistance:
- Only one touch
- Low volume
- Random price, not round number
- Recent formation (not tested over time)
- Only visible on low timeframes
[↑ Back to Top](#table-of-contents)
---
Drawing Support and Resistance
Step-by-Step Process
For Horizontal Support: 1. Zoom out to see several months of price action 2. Identify obvious swing lows (where price bounced) 3. Look for areas where price bounced MULTIPLE times 4. Draw horizontal line through these lows 5. Extend line to the right (into future)
For Horizontal Resistance: 1. Same process but identify swing highs 2. Look for where price was rejected multiple times 3. Draw horizontal line through these highs 4. Extend to the right
Drawing Rules
Rule 1: Zones, Not Lines Support and resistance are areas, not exact prices. Draw zones (e.g., 95-98) rather than precise lines (97.00).
Why? Price rarely bounces at the EXACT same price. There's usually 10-50 pips of variation.
Rule 2: Use Wicks and Bodies Some traders connect wicks (highs/lows), others use bodies (opens/closes). Both work—be consistent.
Best Practice: Use wicks for defining zones, but watch how bodies react.
Rule 3: Don't Overdo It Only mark MAJOR levels. If you have 20 lines on your chart, you have too many.
How Many? Typically 3-5 key levels max per chart. More than that and none are truly significant.
Rule 4: Adjust for New Information As price creates new swings, update your levels. Support and resistance is dynamic, not static.
:::tip Drawing Tip: Start on daily or weekly chart to find major levels. These matter most. Then drop to lower timeframes for precision entries. :::
[↑ Back to Top](#table-of-contents)
---
Role Reversal: Broken Support Becomes Resistance
One of the most powerful concepts in technical analysis is role reversal.
How Role Reversal Works
When Support Breaks: 1. Price falls through support level 2. Support becomes new resistance 3. When price rallies back to old support, sellers appear 4. Old support now acts as ceiling
Why This Happens:
- Buyers who bought at support are underwater (losing money)
- When price returns to their entry, they sell to break even
- This selling pressure creates resistance
When Resistance Breaks: 1. Price rallies through resistance level 2. Resistance becomes new support 3. When price pulls back to old resistance, buyers appear 4. Old resistance now acts as floor
Why This Happens:
- Sellers who shorted at resistance are underwater
- When price returns to their entry, they buy to cover
- This buying pressure creates support
Trading Role Reversal
The Setup (Bullish): 1. Resistance level at 50.00 2. Price breaks above 50.00 with high volume 3. Price pulls back toward 50.00 4. Old resistance (now support) holds 5. Enter long on bounce at 50.00
The Setup (Bearish): 1. Support level at 1.2000 2. Price breaks below 1.2000 with high volume 3. Price rallies back toward 1.2000 4. Old support (now resistance) holds 5. Enter short on rejection at 1.2000
Confirmation Needed:
- High volume on initial break
- Clean break (not just a wick through)
- Clear bounce/rejection on retest
:::example Classic Role Reversal: Stock at $100 support for months. Breaks down to $90. Rallies back to $100. All the buyers from $100 who are now down $10 sell to break even. $100 resistance rejects rally. Perfect short entry. :::
[↑ Back to Top](#table-of-contents)
---
Support and Resistance Trading Strategies
Strategy 1: The Bounce Trade
How It Works: Trade the bounce off support (buy) or rejection at resistance (sell).
Bullish Bounce Setup: 1. Identify strong support level 2. Wait for price to approach support 3. Look for bounce confirmation (bullish candle, volume increase) 4. Enter long 5. Stop loss below support 6. Target next resistance
Risk/Reward: Typically 1:2 or better (risking 20 pips to make 40+)
Success Rate: 60-65% when support is well-established
Strategy 2: The Breakout Trade
How It Works: Trade the break of support or resistance when price decisively breaks through.
Bullish Breakout Setup: 1. Identify strong resistance level 2. Wait for price to break above with high volume 3. Wait for pullback to test old resistance (now support) 4. Enter long on successful retest 5. Stop loss below old resistance 6. Target measured move (distance from consolidation to breakout)
Key Rule: Wait for retest! Don't chase the initial breakout.
Strategy 3: Range Trading
How It Works: When price is ranging between support and resistance, buy at support and sell at resistance.
The Setup: 1. Identify clear range (horizontal support and resistance) 2. Buy near support 3. Sell near resistance 4. Repeat until breakout 5. Stop trading when range breaks
When to Use: Markets range 70% of the time. This strategy has many opportunities.
When to Stop: Once support or resistance breaks decisively, stop range trading and switch to breakout strategy.
Strategy 4: False Breakout (Fakeout)
How It Works: Trade reversals when price briefly breaks through support/resistance then quickly reverses.
Bullish Fakeout Setup: 1. Price breaks below support 2. Immediately reverses back above support (false breakdown) 3. This traps sellers who entered on breakdown 4. Enter long as price reclaims support 5. Stop below false breakdown low 6. Target next resistance
Why It Works: Stops triggered on false break + trapped traders covering = fuel for reversal
:::warning Risk Warning: Breakouts are harder to trade than bounces. Many breakouts fail (false breaks). Always wait for retest confirmation. :::
[↑ Back to Top](#table-of-contents)
---
Advanced Support and Resistance Concepts
Confluence Zones
What is Confluence? When multiple support/resistance factors align at the same level.
Example Strong Confluence:
- Previous swing low (support)
- 200-day moving average
- 61.8% Fibonacci retracement
- Round number (1.2000)
Why It Matters: More factors = stronger level. Confluence zones have highest probability.
Supply and Demand Zones
Supply Zone (Resistance):
- Area where sellers previously overwhelmed buyers
- Large red candles dropping from these zones
- Price struggles to get back into zone
Demand Zone (Support):
- Area where buyers previously overwhelmed sellers
- Large green candles rallying from these zones
- Price bounces when reaching zone
Difference from S/R: Zones focus on WHERE the move started, not just where price reversed.
Pivot Points
What Are Pivots? Mathematical calculations based on previous day's high, low, close. Create automatic support/resistance levels.
Daily Pivot Calculation:
- Pivot Point (PP) = (High + Low + Close) / 3
- R1 = (2 x PP) - Low
- S1 = (2 x PP) - High
Why Traders Use Them: Many traders watch same levels = self-fulfilling prophecy
Psychological Levels
Round Numbers:
- Whole numbers (100.00, 50.00, 1.3000)
- Half numbers (150.00, 75.00, 1.2500)
- Quarter numbers (125.00, 62.50, 1.1250)
Why They Matter: Human psychology likes round numbers. Traders place orders at these levels.
Examples:
- EUR/USD: 1.1000, 1.1500, 1.2000
- Gold: $2000, $1900, $1800
- S&P 500: 4000, 4500, 5000
[↑ Back to Top](#table-of-contents)
---
Common Mistakes When Trading Support and Resistance
Mistake 1: Drawing Too Many Lines
Wrong: Chart covered with 15-20 support/resistance lines Right: 3-5 MAJOR levels that clearly matter Why: Too many lines = analysis paralysis, none are truly significant
Mistake 2: Not Waiting for Confirmation
Wrong: Buying immediately when price touches support Right: Wait for bounce confirmation (bullish candle, volume, rejection wick) Why: Support can break! Always wait for confirmation.
Mistake 3: Using Exact Prices
Wrong: Expecting price to bounce at exactly 1.2000 Right: Thinking of 1.1980-1.2020 as the support zone Why: Price is rarely exact. Always use zones.
Mistake 4: Ignoring Volume
Wrong: Trading all support/resistance bounces regardless of volume Right: Higher volume at levels = more reliable Why: Volume shows conviction. High volume bounces more likely to hold.
Mistake 5: Fighting Strong Breaks
Wrong: Continuing to buy support after it clearly broke Right: Accepting the break, waiting for retest of old support as new resistance Why: Broken support is broken. Don't fight it—trade the new reality.
:::tip Pro Tip: When support breaks on very high volume, it's REALLY broken. Don't try to be a hero buying it. Wait for clear retest as resistance. :::
[↑ Back to Top](#table-of-contents)
---
Real-World Examples
Example 1: Classic Support Bounce
Setup:
- EUR/USD has bounced off 1.0850 three times in past 2 months
- Price approaches 1.0850 again
- Bullish hammer candle forms at 1.0855 (in the zone)
- Next candle closes green above hammer high
Trade:
- Entry: 1.0865 (above hammer confirmation)
- Stop: 1.0820 (below support zone)
- Target: 1.0950 (next resistance)
- Risk: 45 pips, Reward: 85 pips, R:R = 1.89:1 ✅
Result: Price bounces to 1.0940, near-perfect trade.
Example 2: Resistance Becomes Support
Setup:
- Stock stuck under $50 resistance for 3 months
- Breaks above $50 on earnings with huge volume
- Rallies to $55, then pulls back
- Tests $50 from above, holds with bullish candle
Trade:
- Entry: $50.50 (on successful retest)
- Stop: $48.50 (below old resistance)
- Target: $57 (measured move from consolidation)
- Risk: $2, Reward: $6.50, R:R = 3.25:1 ✅
Result: Stock rallies to $58. Role reversal trade works perfectly.
Example 3: Range Trading
Setup:
- Gold trading between $1,900 (support) and $1,950 (resistance) for 6 weeks
- Clear range, multiple touches of both levels
- No trend, just oscillating between levels
Trade Strategy:
- Buy at $1,905 (near support)
- Sell at $1,945 (near resistance)
- Repeat 4 times over 6 weeks
- Exit strategy when range breaks
Result: 4 successful round trips before eventual breakout. Consistent profits from range.
[↑ Back to Top](#table-of-contents)
---
Getting Started: Action Plan
Week 1: Identification
- Open 10 charts (stocks, forex, whatever you trade)
- On each chart, mark the 3 most obvious support and resistance levels
- Use daily or weekly timeframe
- Practice seeing the key levels
Week 2: Drawing Practice
- Same 10 charts, draw support/resistance zones (not lines)
- Use both bodies and wicks
- Identify which levels have been tested multiple times
- Remove weak levels, keep only strong ones
Week 3: Historical Testing
- On your marked charts, see what happened when price reached your levels
- Did price bounce? Break through? How many times?
- Calculate success rate of your levels
- Learn which characteristics make levels stronger
Week 4: Live Monitoring
- Watch your markets in real-time
- Alert when price approaches your marked levels
- Observe how price reacts
- Build intuition for which bounces/breaks are real
AI-Powered Alternative
Learning to identify support and resistance takes months of practice. AI can identify key levels instantly:
What AI Provides:
- Automatic support/resistance identification
- Volume analysis at each level
- Historical test frequency
- Probability of hold vs break
- Optimal entry and exit zones
Try it: Upload any chart and see key support/resistance levels marked with explanations of why they matter.
→ Identify Support & Resistance with AI
[↑ Back to Top](#table-of-contents)
---
Conclusion: Master the Basics, Master Trading
Support and resistance is the foundation of technical analysis for a reason—it works. These levels exist because of market psychology and human behavior, which hasn't changed in 100 years and won't change in the next 100.
Key Takeaways:
✅ Support and resistance are ZONES, not exact prices ✅ Multiple touches = stronger levels ✅ Broken support becomes resistance (and vice versa) ✅ Always wait for confirmation before trading ✅ Confluence zones (multiple factors) are strongest ✅ Volume confirms the strength of levels
Your Path Forward:
Start simple. Mark 3-5 major levels on your charts. Watch how price reacts. Over time, you'll develop an intuition for which levels matter most.
The best part? This skill works in any market, any timeframe, forever. Master support and resistance, and you have a skill for life.
Start Identifying Key Levels Now →
---
Continue Learning
Deepen your understanding of support and resistance with related guides:
📈 Price Action Trading Guide - Learn to trade key levels with candlestick patterns
📊 Volume Spread Analysis Guide - Add volume confirmation to your level analysis
🏦 Smart Money Concepts Guide - Understand order blocks at key levels
📉 Trend Analysis Guide - Combine levels with trend direction
🕯️ Candlestick Patterns Guide - Identify reversal signals at support/resistance
💰 Risk Management Guide - Set stop loss orders based on key levels
---
About TradingAnalysis.ai
We help traders identify support and resistance levels through AI-powered analysis. Upload any chart and see key levels marked instantly with volume analysis and probability assessments.