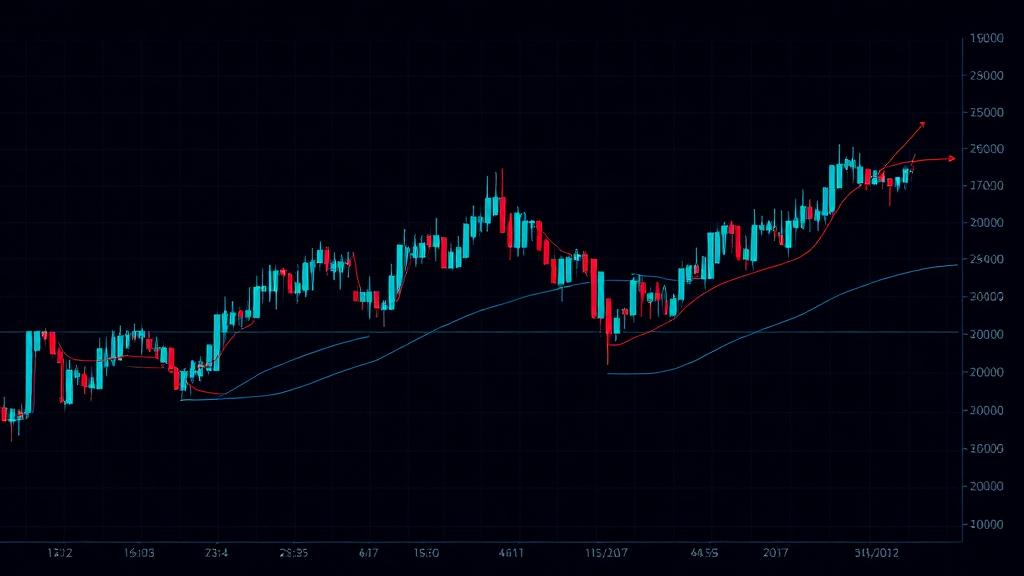
# Trend Analysis: How to Identify and Trade Market Trends
"The trend is your friend" is the most repeated phrase in trading—because it's true. Trading with the trend dramatically increases your probability of success, while fighting the trend is one of the fastest ways to lose money.
This guide covers everything you need to master trend analysis: identifying trends, drawing trendlines, using moving averages, and trading strategies that profit from directional markets.
:::tip Why Trends Matter: 80% of profits come from 20% of trades—usually the ones that catch strong trends. Learning to identify and ride trends is the highest-value skill in trading. :::
Table of Contents
- [What is a Trend?](#what-is-trend)
- [Why Trade with the Trend](#why-trend-trading)
- [Identifying Trends with Price Action](#identifying-trends)
- [Drawing Trendlines](#trendlines)
- [Using Moving Averages](#moving-averages)
- [Measuring Trend Strength](#trend-strength)
- [Trend Trading Strategies](#strategies)
- [When Trends End](#trend-end)
- [Common Mistakes](#mistakes)
- [Getting Started](#getting-started)
---
What is a Trend?
A trend is the general direction of price movement over time. Markets move in three directions:
Uptrend (Bullish)
Definition: Price making higher highs and higher lows.
Characteristics:
- Each rally goes higher than the previous one
- Each pullback stays above the previous low
- Buyers are in control
- Demand exceeds supply
Visual Pattern:
        /\
       /  \    /\
      /    \  /  \   /\
     /      \/    \ /  \
    /              \/
Downtrend (Bearish)
Definition: Price making lower highs and lower lows.
Characteristics:
- Each rally fails to reach the previous high
- Each decline goes lower than the previous low
- Sellers are in control
- Supply exceeds demand
Visual Pattern:
\
 \  /\
  \/  \    /\
       \  /  \
        \/    \  /\
               \/  \
Sideways (Range/Consolidation)
Definition: Price moving between support and resistance without making significant new highs or lows.
Characteristics:
- No clear direction
- Highs and lows roughly equal
- Neither buyers nor sellers in control
- Often precedes a breakout
Visual Pattern:
___/\___/\___/\___
   \/   \/   \/
Timeframe Considerations
Important: Trends exist on all timeframes, and they often conflict.
Example:
- Daily chart: Strong uptrend
- 4-hour chart: Pullback (temporary downtrend)
- 1-hour chart: Ranging
Best Practice: Identify the trend on a higher timeframe, then enter on a lower timeframe in the direction of the higher timeframe trend.
[↑ Back to Top](#trend-analysis-how-to-identify-and-trade-market-trends)
---
Why Trade with the Trend
The Math of Trend Trading
With the Trend:
- Higher win rate (trend helps your trade)
- Larger winners (trending moves are bigger)
- More comfortable holds (market is working for you)
Against the Trend:
- Lower win rate (fighting momentum)
- Smaller winners (countertrend moves are shorter)
- More stressful (watching market go against you)
Probability Edge
In an Uptrend:
- Probability of higher prices > lower prices
- Buyers are stepping in on pullbacks
- Support levels more likely to hold
- Resistance levels more likely to break
In a Downtrend:
- Probability of lower prices > higher prices
- Sellers are stepping in on rallies
- Resistance levels more likely to hold
- Support levels more likely to break
:::example Trend Probability: In a strong uptrend, the probability of any given pullback being a buying opportunity (rather than a trend reversal) is approximately 70-80%. Those are good odds to trade with. :::
Professional Approach
What Professionals Do:
- Identify the dominant trend
- Wait for pullbacks
- Enter in trend direction
- Let winners run
What Amateurs Do:
- Try to catch tops and bottoms
- Fight the trend
- Take profits too early
- Let losers run
[↑ Back to Top](#trend-analysis-how-to-identify-and-trade-market-trends)
---
Identifying Trends with Price Action
The purest way to identify trends is through price action—no indicators needed.
Higher Highs and Higher Lows (Uptrend)
How to Identify: 1. Look at recent swing highs (peaks) 2. Look at recent swing lows (troughs) 3. If each high is higher than the previous high AND each low is higher than the previous low → Uptrend
What It Means:
- Buyers are willing to pay higher prices
- Sellers can't push price below previous lows
- Demand is increasing
How to Trade:
- Buy on pullbacks to higher lows
- Use previous lows as stop loss reference
- Target new highs
Lower Highs and Lower Lows (Downtrend)
How to Identify: 1. Look at recent swing highs 2. Look at recent swing lows 3. If each high is lower than the previous high AND each low is lower than the previous low → Downtrend
What It Means:
- Sellers are willing to accept lower prices
- Buyers can't push price above previous highs
- Supply is increasing
How to Trade:
- Sell on rallies to lower highs
- Use previous highs as stop loss reference
- Target new lows
Identifying Swing Points
Swing High: A candle with at least 2 lower highs on each side.
Swing Low: A candle with at least 2 higher lows on each side.
Tips:
- Use higher timeframes for clearer swing points
- Don't over-identify—focus on obvious, significant swings
- Connect major swings, not every minor fluctuation
:::warning Trend Clarity: If you can't clearly identify higher highs/lows or lower highs/lows, the market is probably ranging. Don't force a trend where there isn't one—wait for clarity. :::
[↑ Back to Top](#trend-analysis-how-to-identify-and-trade-market-trends)
---
Drawing Trendlines
Trendlines are diagonal lines connecting swing points, providing visual representation of trend direction and potential support/resistance.
How to Draw an Uptrend Line
Step 1: Identify at least 2 significant swing lows Step 2: Draw a line connecting these lows Step 3: Extend the line into the future Step 4: Wait for a third touch for confirmation
Placement:
- Connect the bodies or wicks (be consistent)
- The more touches, the more valid the line
- Adjust as new lows form
How to Draw a Downtrend Line
Step 1: Identify at least 2 significant swing highs Step 2: Draw a line connecting these highs Step 3: Extend the line into the future Step 4: Wait for a third touch for confirmation
Placement:
- Connect the bodies or wicks (be consistent)
- The more touches, the more valid the line
- Adjust as new highs form
Trendline Trading Rules
Entry Signals:
- Uptrend line touch → Potential buy (price bouncing off support)
- Downtrend line touch → Potential sell (price rejecting at resistance)
Exit/Reversal Signals:
- Uptrend line break → Trend potentially ending, exit longs
- Downtrend line break → Trend potentially ending, exit shorts
Trendline Best Practices
Do:
- Use higher timeframes (daily, 4H) for more reliable lines
- Require at least 2 touches before considering valid
- Allow for slight penetrations (wicks through the line)
- Adjust lines as trends develop
Don't:
- Force lines where they don't fit
- Use only 1 touch as confirmation
- Ignore multiple breaks of the line
- Draw lines on every minor swing
:::tip Trendline Angle: The steeper the trendline, the less sustainable the trend. Very steep trends (>45 degrees) often correct sharply. More gradual trends (30-45 degrees) tend to be more sustainable. :::
[↑ Back to Top](#trend-analysis-how-to-identify-and-trade-market-trends)
---
Using Moving Averages
Moving averages are the most popular trend indicators. They smooth out price action and show the average price over a specific period.
Common Moving Averages
Short-Term (Fast):
- 9 EMA: Very responsive, good for active traders
- 20 EMA/SMA: Popular for swing traders
Medium-Term:
- 50 SMA/EMA: The "intermediate" average, widely watched
Long-Term (Slow):
- 100 SMA: Medium-term trend indicator
- 200 SMA: The "big picture" trend indicator, most important
Simple vs Exponential
Simple Moving Average (SMA):
- Equal weight to all prices in period
- Slower to react
- Less false signals
- Better for longer-term analysis
Exponential Moving Average (EMA):
- More weight to recent prices
- Faster to react
- More false signals
- Better for shorter-term analysis
Using MAs for Trend Direction
Price Above MA = Bullish Bias
- Above 200 SMA: Long-term uptrend
- Above 50 SMA: Intermediate uptrend
- Above 20 EMA: Short-term uptrend
Price Below MA = Bearish Bias
- Below 200 SMA: Long-term downtrend
- Below 50 SMA: Intermediate downtrend
- Below 20 EMA: Short-term downtrend
Moving Average Crossovers
Golden Cross (Bullish):
- Faster MA crosses ABOVE slower MA
- Example: 50 SMA crosses above 200 SMA
- Signal: Long-term trend turning bullish
Death Cross (Bearish):
- Faster MA crosses BELOW slower MA
- Example: 50 SMA crosses below 200 SMA
- Signal: Long-term trend turning bearish
:::warning MA Lag: Moving averages are lagging indicators—they tell you what HAS happened, not what WILL happen. Use them for trend confirmation, not prediction. By the time MAs signal a trend change, a significant move has usually already occurred. :::
MA Trading Strategy: The Bounce
Setup: Price in uptrend pulls back to key MA (20/50/200)
Entry: Price bounces off MA with bullish candle
Stop: Below the MA
Target: Recent high or next resistance
Why It Works: In strong trends, MAs act as dynamic support/resistance.
[↑ Back to Top](#trend-analysis-how-to-identify-and-trade-market-trends)
---
Measuring Trend Strength
Not all trends are equal. Some are strong and sustainable; others are weak and likely to fail.
Price Action Clues
Strong Trend Signs:
- Clear higher highs/lows (uptrend) or lower highs/lows (downtrend)
- Shallow pullbacks (pullbacks retrace only 20-30% of the move)
- Long candles in trend direction
- Short candles against trend direction
- Quick recovery from pullbacks
Weak Trend Signs:
- Overlapping candles
- Deep pullbacks (50%+ retracements)
- Long wicks against trend direction
- Slow, grinding moves
- Frequent trend line breaks
Moving Average Position
Strong Uptrend:
- Price > 20 EMA > 50 SMA > 200 SMA
- All MAs fanning out upward
- Good separation between MAs
Weak Uptrend:
- MAs tangled together
- Price repeatedly crossing MAs
- MAs flattening
Pullback Depth
Healthy Pullbacks:
- 23.6% to 38.2% Fibonacci retracement
- Don't break previous swing low (uptrend)
- Quickly resume trend direction
Warning Pullbacks:
- 50% or deeper retracement
- Break previous swing structure
- Slow to resume trend
Trend Angle
Sustainable Trend: 30-45 degree angle
Parabolic/Unsustainable: >60 degree angle (often leads to sharp correction)
Dying Trend: Flattening angle (momentum fading)
[↑ Back to Top](#trend-analysis-how-to-identify-and-trade-market-trends)
---
Trend Trading Strategies
Strategy 1: Pullback Entry
Concept: Wait for price to pull back to support in an uptrend (or resistance in a downtrend), then enter in trend direction.
Uptrend Setup: 1. Confirm uptrend (higher highs/lows, above MAs) 2. Wait for pullback to support (trendline, MA, previous resistance now support) 3. Look for bullish reversal signal (hammer, engulfing, pin bar) 4. Enter long with stop below recent swing low 5. Target recent high or new high
Why It Works:
- Entering at better price (not chasing)
- Defined risk (stop below pullback low)
- Trend provides tailwind
Strategy 2: Breakout Entry
Concept: Enter when price breaks above resistance (uptrend) or below support (downtrend), confirming trend continuation.
Uptrend Setup: 1. Confirm uptrend 2. Identify resistance level (previous high, horizontal level) 3. Wait for price to break and close above resistance 4. Enter on breakout or retest 5. Stop below breakout level 6. Target next resistance or measured move
Why It Works:
- Confirms new buyers entering at higher prices
- Momentum often accelerates after breakout
- Clear invalidation level
Strategy 3: Moving Average Crossover
Concept: Enter when fast MA crosses slow MA in trend direction.
Setup: 1. Use 20/50 EMA crossover (or similar) 2. Golden cross (20 above 50) = Long entry 3. Death cross (20 below 50) = Short entry 4. Stop: Below recent swing low (longs) or above recent swing high (shorts) 5. Exit: Opposite crossover
Why It Works:
- Objective, systematic signals
- Captures intermediate-term trends
- Removes emotion from entry/exit decisions
:::tip Multiple Confirmation: The best trend trades have multiple confirmations: price action (higher highs/lows) + trendline support + MA bounce + candlestick pattern. The more confluence, the higher probability. :::
Strategy 4: Trend Following with Trailing Stop
Concept: Enter with trend, use trailing stop to let winners run while protecting profits.
Setup: 1. Enter on pullback or breakout (any trend entry method) 2. Use ATR-based trailing stop (2x ATR below price for longs) 3. Move stop up as price moves up 4. Never move stop down 5. Exit when stop is hit
Why It Works:
- Captures large trending moves
- Protects profits without premature exit
- Removes emotion from exit decision
[↑ Back to Top](#trend-analysis-how-to-identify-and-trade-market-trends)
---
When Trends End
All trends eventually end. Recognizing trend exhaustion prevents you from buying at tops and selling at bottoms.
Warning Signs
Price Action Warnings:
- Failure to make new high (uptrend) or new low (downtrend)
- Lower high in uptrend (first warning)
- Higher low in downtrend (first warning)
- Increasing pullback depth
- Decreasing momentum on rallies
Trendline Warnings:
- Trendline break
- Multiple failed retests of broken trendline
- Price staying on wrong side of trendline
Moving Average Warnings:
- Price crossing below key MAs (uptrend)
- Price crossing above key MAs (downtrend)
- MA crossovers against trend direction
- MAs flattening
Trend Reversal Patterns
Head and Shoulders (Uptrend Ending):
- Left shoulder, head (higher high), right shoulder (lower high)
- Neckline break confirms reversal
Double Top (Uptrend Ending):
- Two attempts at same resistance level
- Failure to break higher
- Support break confirms reversal
Inverse Patterns (Downtrend Ending):
- Inverse head and shoulders
- Double bottom
- Same logic, opposite direction
What to Do When Trend Ends
Option 1: Exit Position
- Close trades in trend direction
- Take profits
- Wait for new trend to establish
Option 2: Reduce Size
- Scale out of position
- Keep smaller position for potential resumption
- Tighten stops
Option 3: Trade the Range
- If trend transitions to range, trade between support/resistance
- Buy at support, sell at resistance
- Smaller position sizes
Option 4: Trade the Reversal
- If clear reversal pattern, trade new trend direction
- Wait for confirmation (lower low after lower high in former uptrend)
- Use pattern-based stops
[↑ Back to Top](#trend-analysis-how-to-identify-and-trade-market-trends)
---
Common Mistakes
Mistake 1: Fighting the Trend
The Error: Taking counter-trend trades hoping to catch reversals.
Reality: Most "reversal" attempts fail. Trends persist longer than you expect.
Fix: Only trade in trend direction until clear reversal confirmation.
Mistake 2: Subjective Trendlines
The Error: Drawing trendlines that fit your bias, ignoring ones that don't.
Reality: If you have to force a trendline, it's not valid.
Fix: Use objective rules (minimum touches, angle, etc.) and accept when no clear trendline exists.
Mistake 3: Chasing Entry
The Error: Entering after price has already moved significantly in trend direction.
Reality: Buying extended moves often leads to immediate pullbacks against you.
Fix: Wait for pullbacks to enter. Missing a move is better than entering at the worst price.
Mistake 4: Using Wrong Timeframe
The Error: Day trading based on monthly trends, or position trading based on 5-minute trends.
Reality: Trend timeframe must match trade timeframe.
Fix: Higher timeframe for trend direction, lower timeframe (1-2 steps down) for entry.
Mistake 5: Ignoring Trend Changes
The Error: Staying in trades after trend has clearly reversed.
Reality: Holding through reversals turns winners into losers.
Fix: Define exit rules for trend exhaustion. Honor your stops.
:::warning The #1 Rule: When in doubt, don't trade. If you can't clearly identify the trend, the market is telling you to wait. There's no requirement to always be in a trade. :::
[↑ Back to Top](#trend-analysis-how-to-identify-and-trade-market-trends)
---
Getting Started: Action Plan
Week 1: Trend Identification
- Practice identifying higher highs/lows and lower highs/lows
- Look at 20+ charts across different assets
- Label each as uptrend, downtrend, or ranging
- Compare your analysis to 20/50/200 MAs
Week 2: Trendline Practice
- Draw trendlines on at least 10 trending charts
- Find minimum 2 touches before considering valid
- Note which trendlines hold and which break
- Observe what happens after trendline touches
Week 3: Moving Average Analysis
- Add 20 EMA, 50 SMA, and 200 SMA to your charts
- Study how price interacts with these levels
- Note bounces, breaks, and crossovers
- Observe how trend direction correlates with MA position
Week 4: Trade Planning
- Create a trend trading plan (entry, stop, target rules)
- Paper trade pullback entries for 1 week
- Journal every trade with notes on trend strength
- Review and refine strategy
AI-Assisted Trend Analysis
Trend identification requires practice and can be subjective. AI analysis provides:
Objective Trend Assessment:
- Algorithmic identification of trend direction
- Trend strength measurement
- Key support/resistance levels within trend
- Optimal entry points for pullbacks
[↑ Back to Top](#trend-analysis-how-to-identify-and-trade-market-trends)
---
Conclusion: Trade with the Trend
Trend trading is the most reliable approach to making money in markets. While it requires patience (waiting for pullbacks rather than chasing), the math is overwhelmingly in your favor when you trade with the dominant direction.
Key Takeaways:
✅ Higher highs/lows = uptrend; Lower highs/lows = downtrend ✅ Trendlines and moving averages confirm trend direction ✅ Enter on pullbacks, not at extended prices ✅ Let winners run with trailing stops ✅ Exit when trend structure breaks
Your Next Steps:
Start by simply identifying trends correctly. Practice on historical charts until you can quickly determine trend direction. Then add trendlines and moving averages. Only after you're confident in trend identification should you start executing trades.
The trend is your friend—learn to find it and trade with it.
---
Continue Learning
Complement your trend analysis with these guides:
🎯 Support and Resistance Guide - Key levels for pullback entries
📈 Price Action Trading Guide - Complete price action methodology
🕯️ Candlestick Patterns Guide - Entry signals at trendlines
📊 Volume Spread Analysis Guide - Volume confirmation for trend strength
🏦 Smart Money Concepts Guide - Understand market structure and break of structure
💰 Risk Management Guide - Trailing stop loss strategies
---
About TradingAnalysis.ai
We help traders identify trends and optimal entry points through AI-powered analysis. Upload any chart for instant trend assessment and actionable trading levels.