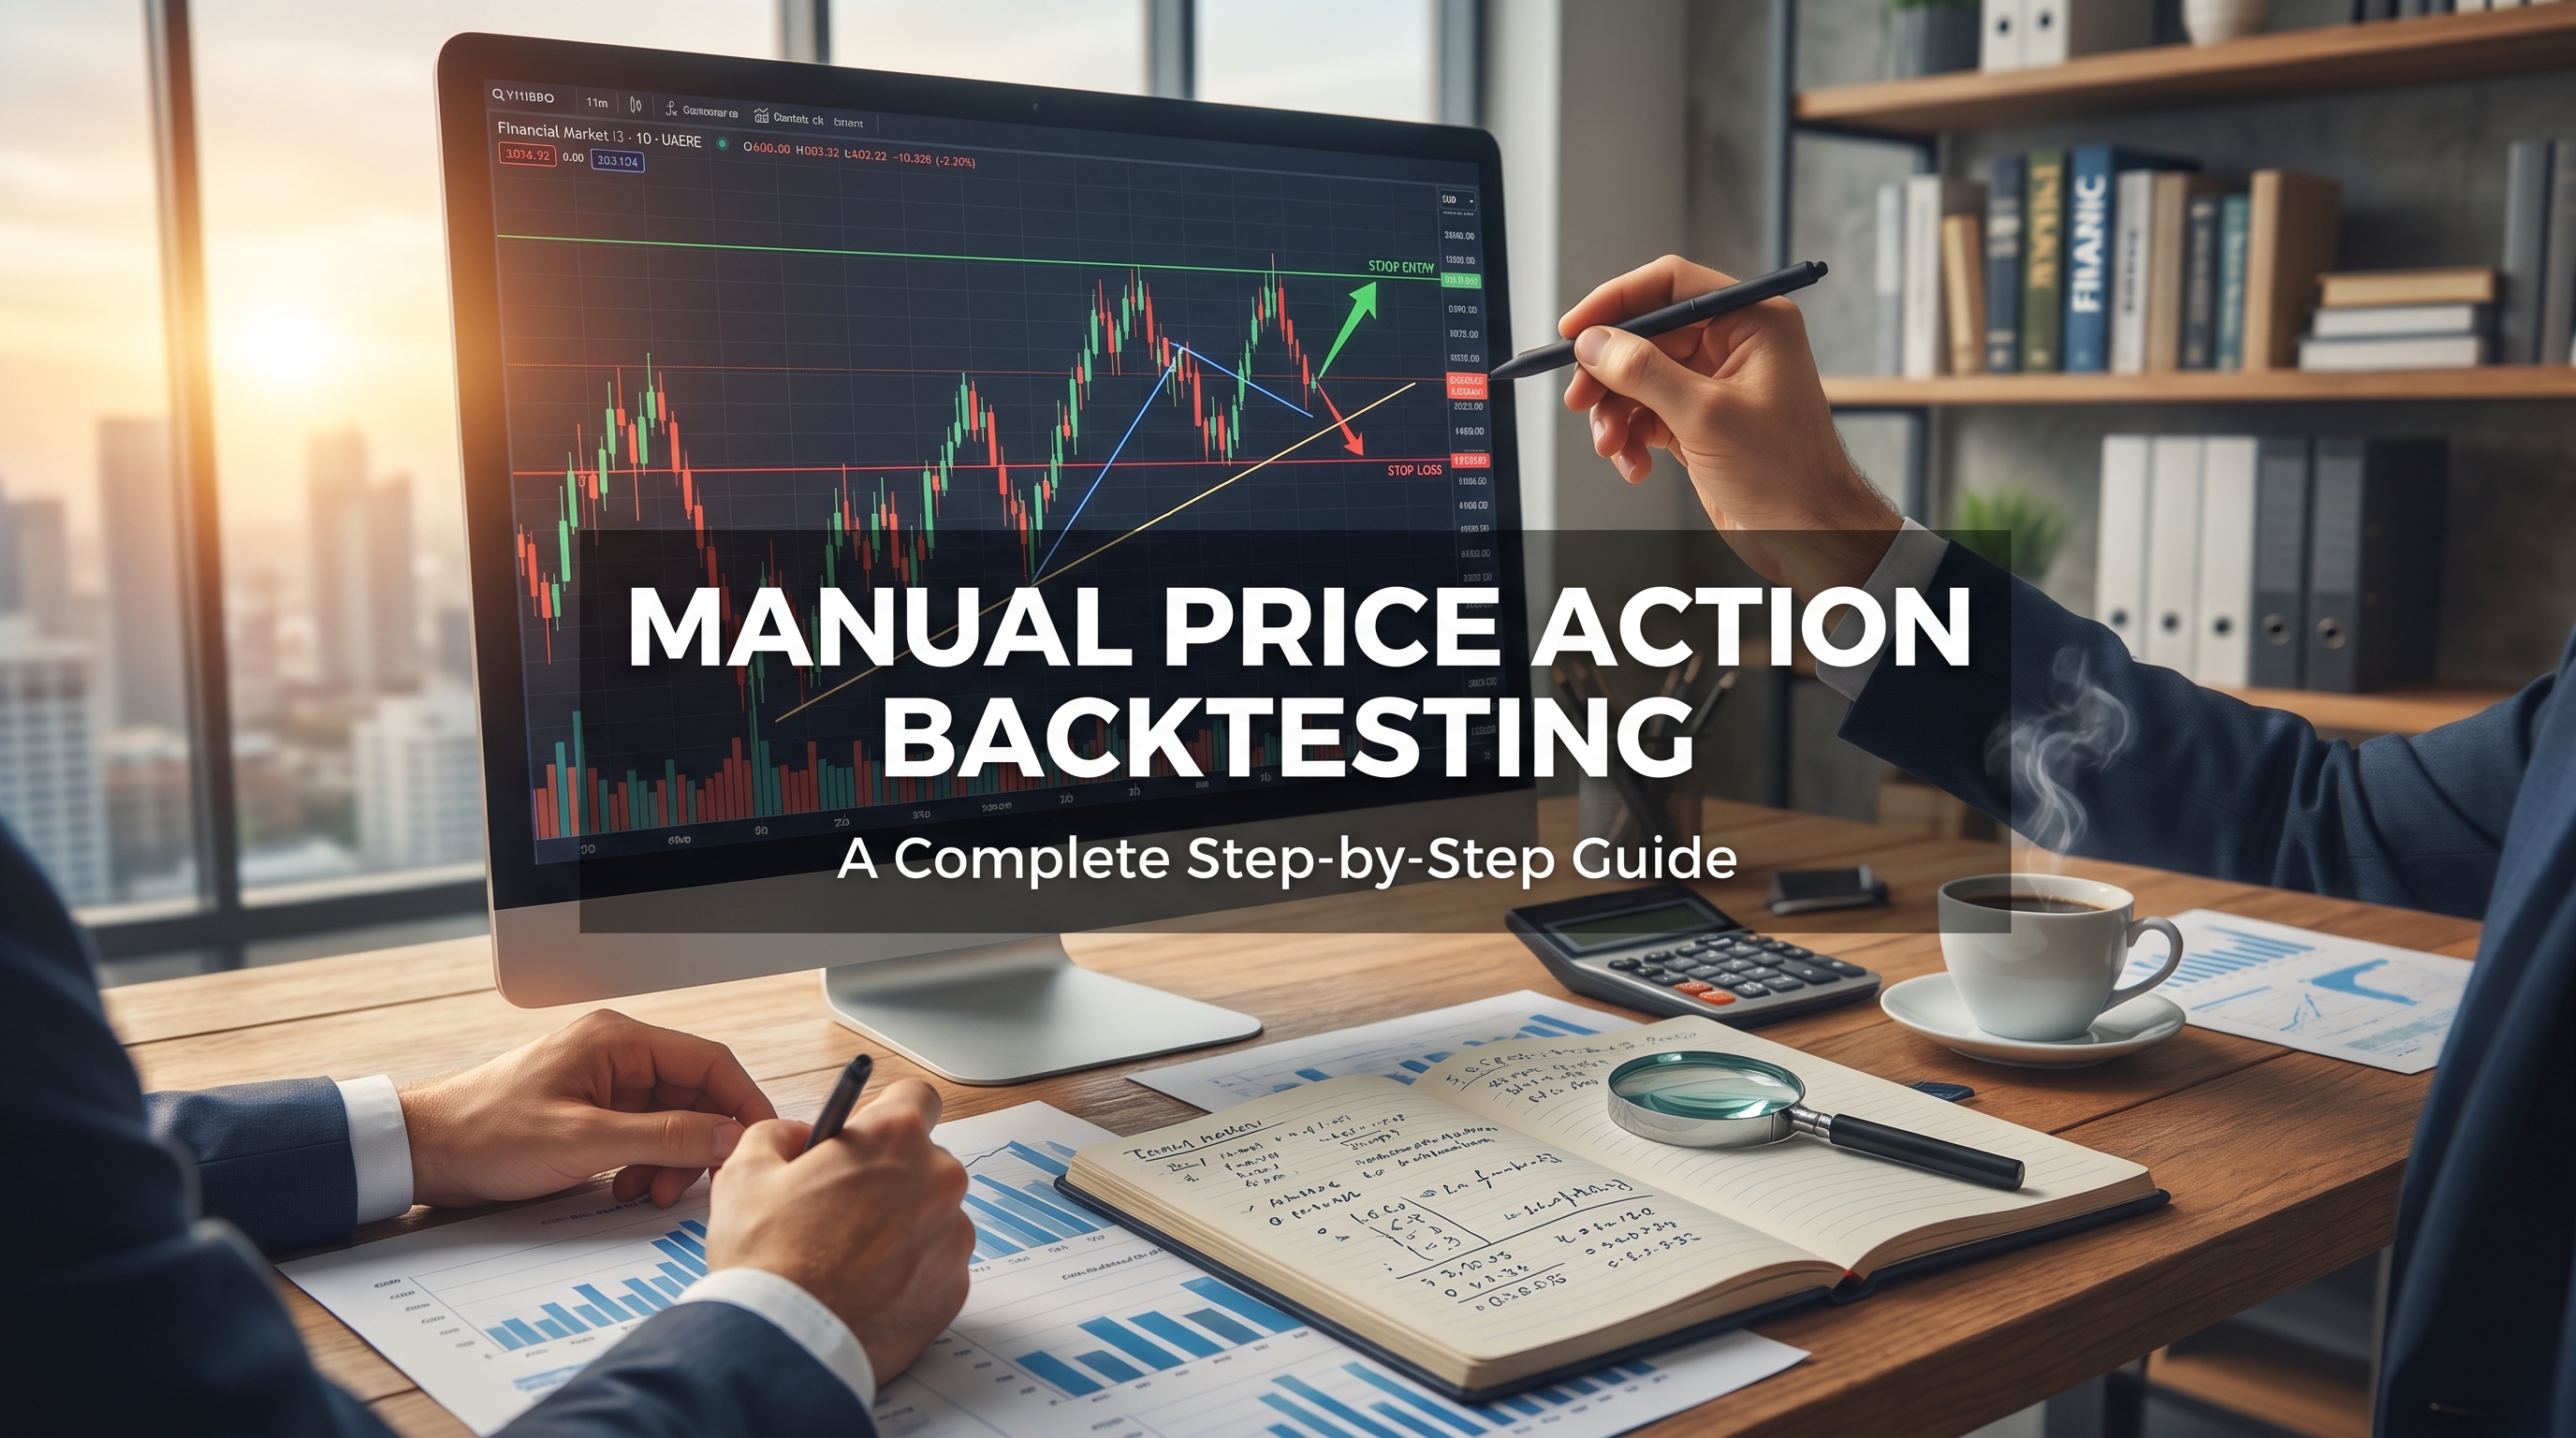
# How to Backtest a Price Action Strategy Manually: A Complete Step-by-Step Guide
Backtesting is the cornerstone of successful trading strategy development. When you backtest a price action strategy, you're essentially testing your trading approach against historical market data to validate its effectiveness before risking real capital. This comprehensive guide will walk you through the complete process of manual backtesting for price action strategies.
Unlike automated backtesting software, manual backtesting gives you the nuanced understanding of market behavior that only comes from personally analyzing each trade setup. You'll develop a deeper connection with your strategy and gain insights that automated systems might miss.
:::key-concept Manual backtesting involves systematically reviewing historical charts to identify trade setups based on your price action rules, then tracking the outcomes to measure strategy performance. :::
Table of Contents
- [Essential Preparation for Backtesting](#essential-preparation-for-backtesting)
- [Setting Up Your Backtesting Environment](#setting-up-your-backtesting-environment)
- [The Manual Backtesting Process](#the-manual-backtesting-process)
- [Recording and Analyzing Results](#recording-and-analyzing-results)
- [Optimizing Your Strategy](#optimizing-your-strategy)
- [Common Pitfalls to Avoid](#common-pitfalls-to-avoid)
Essential Preparation for Backtesting
Before you begin to backtest a price action strategy, you need clear, written rules that define your trading approach. Vague guidelines lead to inconsistent results and self-deception during the backtesting process.
Define Your Price Action Rules
Your strategy documentation should include:
- Entry criteria: Specific price action patterns or setups
- Exit rules: Both profit targets and stop loss levels
- Market conditions: When to trade and when to avoid trading
- Position sizing: How much capital to risk per trade
- Timeframe specifications: Which charts to use for analysis
:::example A simple price action strategy might be: "Enter long when price breaks above a significant resistance level with a strong bullish candle, place stop loss below the breakout candle's low, target 2:1 risk-reward ratio." :::
Choose Your Market and Timeframe
Select the specific market and timeframe you want to test. This decision impacts your results significantly:
- Forex pairs: Major pairs often provide cleaner price action
- Stock indices: Good for trend-following strategies
- Individual stocks: Require additional fundamental considerations
- Cryptocurrencies: Higher volatility affects risk management
Gather Historical Data
Ensure you have access to quality historical data spanning at least 1-2 years. This provides sufficient sample size for meaningful results while capturing various market conditions.
:::warning Avoid using data from extremely unusual market periods (like major crashes) as your only testing period, as this may skew results. :::
Setting Up Your Backtesting Environment
Creating an organized workspace streamlines the backtesting process and reduces errors.
Chart Setup
Configure your charting platform for optimal backtesting:
1. Remove indicators initially: Focus purely on price action 2. Use clean charts: Minimize distractions 3. Set appropriate timeframe: Match your strategy requirements 4. Enable historical data: Ensure you can scroll back through time
Create a Trading Journal Template
Develop a spreadsheet or document to record:
- Trade entry date and price
- Entry reason (which setup triggered the trade)
- Stop loss level
- Target profit level
- Actual exit date and price
- Profit/loss in pips/points and currency
- Trade duration
- Market conditions
- Screenshots of the setup
Simulation Rules
Establish realistic simulation parameters:
- Spread costs: Include typical bid-ask spreads
- Slippage: Account for execution delays
- Commission: Factor in broker fees
- Starting capital: Use realistic account size
:::tip Start with a fixed position size (like 1% risk per trade) to simplify calculations and focus on strategy performance rather than position sizing optimization. :::
The Manual Backtesting Process
Now comes the core work of actually testing your strategy. When you backtest a price action strategy manually, consistency and attention to detail are crucial.
Step 1: Start from the Beginning
Begin your analysis from the earliest point in your historical data. This prevents hindsight bias and mimics real-time trading conditions.
1. Set your chart to the starting date 2. Hide future price data if possible 3. Begin analyzing candle by candle 4. Look only at what would have been available at that moment
Step 2: Identify Trade Setups
Systematically move through the charts, identifying potential trades:
- Scan for your defined price action patterns
- Verify all entry criteria are met
- Note the exact entry point and reasoning
- Determine stop loss and take profit levels
:::example If trading pin bar reversals, you would: 1. Identify a pin bar at key support/resistance 2. Confirm the pattern meets your criteria (wick size, body position) 3. Check for confluence factors (trend direction, volume) 4. Record the potential trade parameters :::
Step 3: Execute Simulated Trades
Once you identify a valid setup:
1. Record entry details in your journal immediately 2. Calculate position size based on your risk rules 3. Set stop loss and take profit levels precisely 4. Take a screenshot of the setup for later review
Step 4: Track Trade Progress
Advance the chart to see how each trade develops:
- Monitor price movement toward your targets
- Note any changes in market conditions
- Record the actual exit point and reason
- Calculate profit/loss accurately
Step 5: Move to the Next Setup
Continue this process throughout your testing period, maintaining the same discipline for every potential trade.
:::warning Resist the temptation to "cherry-pick" trades or modify rules mid-test. Consistency is essential for valid results. :::
Recording and Analyzing Results
Proper documentation transforms raw backtesting data into actionable insights about your strategy's performance.
Key Metrics to Track
When you backtest a price action strategy, monitor these essential performance indicators:
Profitability Metrics:
- Total profit/loss
- Win rate percentage
- Average win vs. average loss
- Profit factor (gross profit ÷ gross loss)
- Maximum drawdown
Trade Quality Metrics:
- Number of trades taken
- Average trade duration
- Best and worst trades
- Consecutive wins/losses
Risk Metrics:
- Risk-reward ratio achieved
- Maximum consecutive losses
- Percentage of account at risk
- Sharpe ratio (if applicable)
Performance Analysis
After completing your backtest:
1. Calculate overall performance: Determine total return and win rate 2. Analyze trade distribution: Look for patterns in wins and losses 3. Review market conditions: Note which environments favor your strategy 4. Identify strengths and weaknesses: What worked best and what didn't
:::tip Create visual charts of your equity curve to better understand performance patterns and drawdown periods. :::
Pattern Recognition
Look for recurring themes in your results:
- Which setups produce the highest win rates?
- What market conditions reduce performance?
- Are there optimal trade duration patterns?
- Do certain exit strategies work better?
Optimizing Your Strategy
Backtesting reveals optimization opportunities to improve your price action approach.
Parameter Refinement
Based on your results, consider adjusting:
Entry Criteria:
- Tighten or loosen pattern recognition rules
- Add or remove confluence factors
- Modify timing requirements
Risk Management:
- Adjust stop loss placement
- Optimize risk-reward ratios
- Refine position sizing rules
Market Selection:
- Focus on best-performing instruments
- Avoid problematic market conditions
- Optimize timeframe selection
Forward Testing
After optimization:
1. Test refined rules on out-of-sample data 2. Verify improvements are genuine, not curve-fitted 3. Ensure the strategy remains robust across different periods
:::key-concept True optimization improves strategy logic, not just historical results. Focus on understanding why changes work rather than just maximizing past performance. :::
Common Pitfalls to Avoid
Successful manual backtesting requires awareness of potential biases and errors.
Hindsight Bias
The most dangerous trap when you backtest a price action strategy is using future knowledge:
- Don't identify patterns that only become clear later
- Avoid "perfect" entry and exit timing
- Stick to information available at decision points
Over-Optimization
Avoid creating strategies that work perfectly on historical data but fail in live trading:
- Don't adjust rules to fit every historical scenario
- Maintain simple, logical approaches
- Test on multiple time periods and markets
Insufficient Sample Size
Ensure statistical significance:
- Test at least 30-50 trades minimum
- Include various market conditions
- Span multiple months or years of data
Ignoring Transaction Costs
Real trading includes costs that affect profitability:
- Account for spreads and commissions
- Consider slippage in volatile markets
- Include any swap or financing costs
:::warning A strategy that appears profitable in backtesting may become unprofitable when realistic trading costs are included. :::
Emotional Simulation
Manual backtesting can't replicate the psychological pressure of live trading:
- Acknowledge this limitation
- Start with smaller position sizes when going live
- Practice emotional discipline during backtesting
Conclusion
Learning how to backtest a price action strategy manually is an essential skill that will dramatically improve your trading results. This systematic approach allows you to validate your ideas, identify weaknesses, and build confidence in your trading approach before risking real money.
Remember that manual backtesting is both an art and a science. While the process requires discipline and attention to detail, it provides invaluable insights that automated systems cannot match. You'll develop a deeper understanding of market behavior, improve your pattern recognition skills, and create more robust trading strategies.
The key to successful backtesting lies in maintaining objectivity, documenting everything thoroughly, and focusing on long-term statistical performance rather than individual trade outcomes. Your backtesting efforts today will pay dividends in improved trading performance tomorrow.
Ready to start testing your price action strategies? Begin by setting up your backtesting environment and defining clear trading rules. Remember, the time invested in thorough backtesting is time saved from costly mistakes in live trading.
Advanced Manual Backtesting Techniques
Once you've mastered the basic backtesting process, several advanced techniques can enhance the accuracy and depth of your analysis.
Multi-Timeframe Analysis
Price action strategies often benefit from multi-timeframe confirmation:
- Use higher timeframes to identify trend direction
- Enter trades on lower timeframes for better precision
- Validate signals across multiple chart periods
- Document how timeframe analysis affects trade outcomes
:::tip A trend-following strategy on the 4-hour chart combined with entry signals on the 1-hour chart often provides better risk-to-reward ratios. :::
Market Condition Classification
Different price action patterns perform better in specific market environments:
Trending Markets:
- Flag and pennant patterns excel
- Breakout strategies show higher success rates
- Support and resistance levels hold more firmly
Range-Bound Markets:
- Reversal patterns perform better
- Mean reversion strategies work well
- Breakout signals produce more false signals
High Volatility Markets:
- Wider stop-losses may be necessary
- Quick scalping strategies can be effective
- Risk management becomes critical
Seasonal and Time-Based Analysis
Consider how time factors affect your strategy performance:
- Test performance across different months
- Analyze results by day of the week
- Consider session overlap periods (London/New York)
- Look for patterns around major economic events
:::example A breakout strategy might perform better during the London session when volume is higher, while reversal patterns could be more effective during the quieter Asian session. :::
Building a Backtesting Database
Creating a comprehensive database of your backtesting results enables deeper analysis and strategy refinement.
Essential Data Fields
Track these key metrics for each backtested trade:
- Entry date and time
- Exit date and time
- Market conditions (trending/ranging/volatile)
- Setup quality score (1-5 scale)
- Risk-to-reward ratio achieved
- Maximum adverse excursion
- Maximum favorable excursion
Analysis Categories
Organize your results by:
Pattern Type:
- Pin bars, engulfing patterns, breakouts
- Compare performance across different setups
Market Conditions:
- Trend strength at entry
- Volatility levels
- Time of day/session
Trade Management:
- Different stop-loss placement methods
- Various profit-taking approaches
- Partial position management techniques
Performance Benchmarking
Compare your strategy against:
- Buy and hold returns
- Random entry systems
- Simple moving average strategies
- Market benchmark indices
Common Manual Backtesting Mistakes
Avoiding these pitfalls will significantly improve your backtesting accuracy:
Pattern Forcing
Don't force patterns where they don't clearly exist:
- Only count obvious, textbook setups
- Maintain consistent pattern identification criteria
- When in doubt, skip the trade in your backtest
Ignoring Market Context
Price action patterns don't exist in isolation:
- Consider overall market trend
- Analyze volume and momentum
- Account for nearby support/resistance levels
Unrealistic Execution Assumptions
Model realistic trading conditions:
- Account for market gaps over weekends
- Consider how your strategy handles major news events
- Model realistic slippage during volatile periods
:::warning A strategy that ignores overnight gaps and weekend events may significantly overestimate real-world performance. :::
Stop-Loss Hunting
Don't adjust historical stop-losses based on what you see happened:
- Set stops based only on information available at entry
- Stick to your predefined risk management rules
- Accept that some stops will be hit by market noise
Transitioning from Backtesting to Live Trading
Successfully moving from backtesting to live trading requires a structured approach:
Paper Trading Phase
Before risking real money:
- Execute your strategy in real-time with fake money
- Practice order entry and management procedures
- Test your emotional responses to winning and losing streaks
- Validate that live market conditions match backtesting assumptions
Micro Position Testing
Start with very small position sizes:
- Use minimum lot sizes or micro accounts
- Focus on execution quality over profit amounts
- Gradually increase position sizes as confidence builds
- Monitor how psychological factors affect decision-making
Performance Monitoring
Track live performance against backtesting expectations:
- Compare actual vs. expected win rates
- Monitor slippage and execution quality
- Analyze deviations from planned entries and exits
- Adjust strategy parameters if significant discrepancies emerge
:::key-concept The goal isn't perfect replication of backtesting results, but rather confirmation that the underlying edge remains valid in live market conditions. :::
Creating a Backtesting Routine
Developing a systematic backtesting routine ensures continuous strategy improvement:
Weekly Reviews
- Analyze recent market price action for potential setups
- Review current strategy performance
- Identify any emerging market pattern changes
- Update your trade database with new backtesting results
Monthly Deep Dives
- Conduct comprehensive strategy performance reviews
- Test strategy modifications or refinements
- Analyze correlation between different trading approaches
- Research new price action patterns or techniques
Quarterly Strategy Audits
- Evaluate overall strategy effectiveness
- Compare performance across different market periods
- Consider major strategy adjustments or new approaches
- Review and update risk management parameters
Final Thoughts and Next Steps
Manual backtesting of price action strategies is a foundational skill that separates successful traders from those who rely on hope and intuition. The systematic approach outlined in this guide provides you with the tools to validate your trading ideas, understand market behavior, and build confidence in your approach.
The key benefits of mastering manual backtesting include:
- Deep Market Understanding: You'll develop an intuitive feel for how price moves and responds to different conditions
- Pattern Recognition Skills: Regular backtesting sharpens your ability to spot high-probability setups quickly
- Risk Management Mastery: You'll understand how different risk parameters affect overall performance
- Emotional Preparation: Experiencing many trades through backtesting prepares you for the emotional aspects of live trading
Remember that backtesting is an ongoing process, not a one-time activity. Markets evolve, and your strategies must evolve with them. Regular backtesting keeps your edge sharp and your understanding current.
:::tip Set aside dedicated time each week for backtesting activities. Consistency in this practice will compound your trading skills over time. :::
Start your backtesting journey today. Choose a simple price action pattern, gather your historical charts, and begin the systematic process outlined in this guide. Every hour spent in careful backtesting analysis will save you from costly mistakes and missed opportunities in live trading.
The markets reward those who do their homework. Make manual backtesting your competitive advantage, and watch your trading performance improve dramatically over time.